| Param | Original file | Final file |
|---|---|---|
| Filename | modeM0/AS1A12_054T01_9000005392_38720cztM0_level2.fits | modeM0/AS1A12_054T01_9000005392_38720cztM0_level2_quad_clean.evt |
| Size (bytes) | 549,748,800 | 78,603,840 |
| Size | 524.3 MB | 75.0 MB |
| Events in quadrant A | 2,713,428 | 619,163 |
| Events in quadrant B | 2,576,983 | 635,102 |
| Events in quadrant C | 2,716,901 | 605,526 |
| Events in quadrant D | 11,935,741 | 154,002 |
| Mode M9 | |||
|---|---|---|---|
| Quadrant | BADHDUFLAG | Total packets | Discarded packets |
| A | 0 | 27 | 0 |
| B | 0 | 27 | 0 |
| C | 0 | 27 | 0 |
| D | 0 | 28 | 0 |
| Mode SS | |||
|---|---|---|---|
| Quadrant | BADHDUFLAG | Total packets | Discarded packets |
| A | 0 | 108 | 0 |
| B | 0 | 108 | 0 |
| C | 0 | 108 | 0 |
| D | 0 | 108 | 0 |
| Mode M0 | |||
|---|---|---|---|
| Quadrant | BADHDUFLAG | Total packets | Discarded packets |
| A | 0 | 11408 | 3 |
| B | 0 | 11055 | 2 |
| C | 0 | 11368 | 2 |
| D | 0 | 38996 | 2 |
| Quadrant | Total seconds | Saturated seconds | Saturation percentage |
|---|---|---|---|
| A | 5223 | 13 | 0.248899% |
| B | 5223 | 44 | 0.842428% |
| C | 5223 | 26 | 0.497798% |
| D | 5223 | 4094 | 78.384070% |
Noise dominated data is calculated using 1-second bins in cleaned event files. If a bin has >2000 counts, and if more than 50% of those come from <1% of pixels, then it is considered to be noise-dominated and hence unusable.
| Quadrant | # 1 sec bins | Bins with >0 counts | Bins with >2000 counts | High rate bins dominated by noise | Noise dominated (total time) | Noise dominated (detector-on time) | Marked lightcurve |
|---|---|---|---|---|---|---|---|
| A | 7047 | 5224 | 3 | 3 | 0.04% | 0.06% | 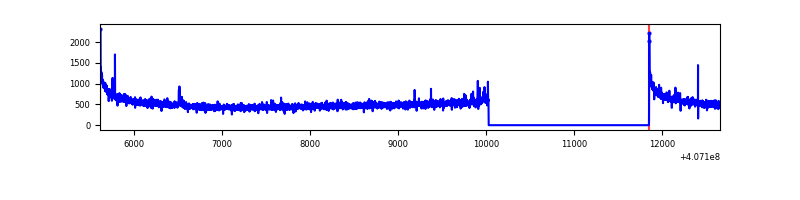 |
| B | 7047 | 5224 | 17 | 17 | 0.24% | 0.33% | 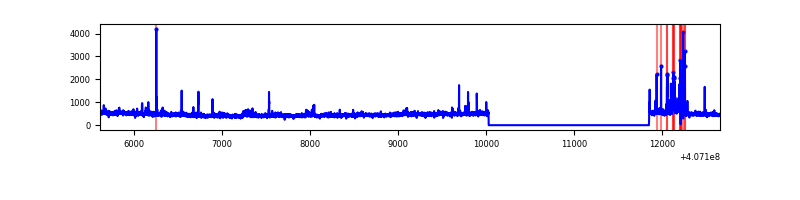 |
| C | 7047 | 5224 | 17 | 17 | 0.24% | 0.33% | 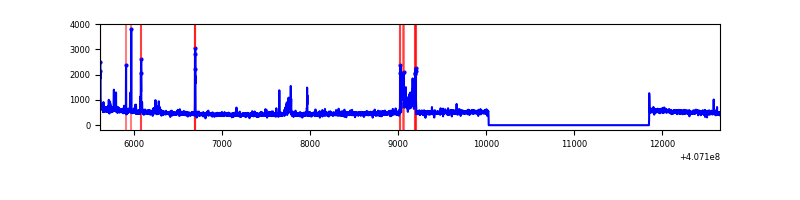 |
| D | 7047 | 5224 | 3715 | 3715 | 52.72% | 71.11% | 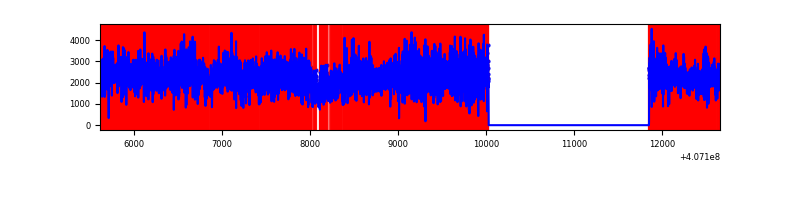 |
Top three noisy pixels from each quadrant. If the there are fewer than three noisy pixels in the level2.evt file, extra rows are filled as -1
| Pixel properties | Quadrant properties | ||||||
|---|---|---|---|---|---|---|---|
| Quadrant | DetID | PixID | Counts | Sigma | Mean | Median | Sigma |
| A | 10 | 83 | 377101 | 3132.23 | 593 | 582 | 120.2 |
| A | 0 | 8 | 20598 | 166.51 | 593 | 582 | 120.2 |
| A | 9 | 143 | 8066 | 62.26 | 593 | 582 | 120.2 |
| B | 4 | 171 | 144558 | 1252.55 | 592 | 576 | 115.0 |
| B | 0 | 213 | 55945 | 481.67 | 592 | 576 | 115.0 |
| B | 0 | 230 | 15387 | 128.84 | 592 | 576 | 115.0 |
| C | 15 | 214 | 217278 | 1596.81 | 581 | 587 | 135.7 |
| C | 15 | 208 | 174523 | 1281.74 | 581 | 587 | 135.7 |
| C | 14 | 254 | 31418 | 227.2 | 581 | 587 | 135.7 |
| D | 12 | 235 | 5851499 | 59459.7 | 399 | 389 | 98.4 |
| D | 2 | 16 | 4129767 | 41963.25 | 399 | 389 | 98.4 |
| D | 10 | 118 | 100896 | 1021.36 | 399 | 389 | 98.4 |
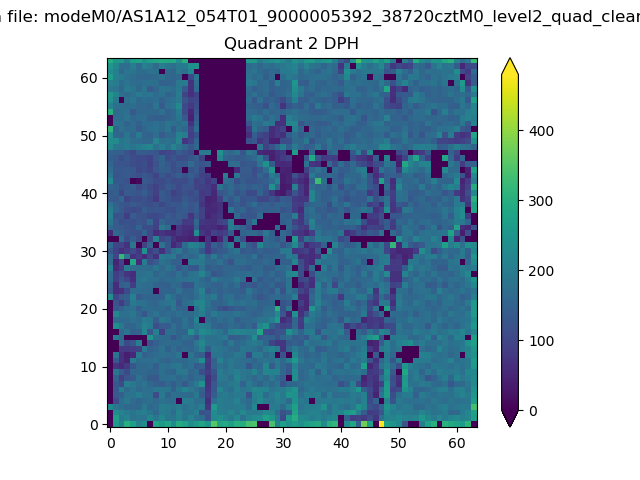
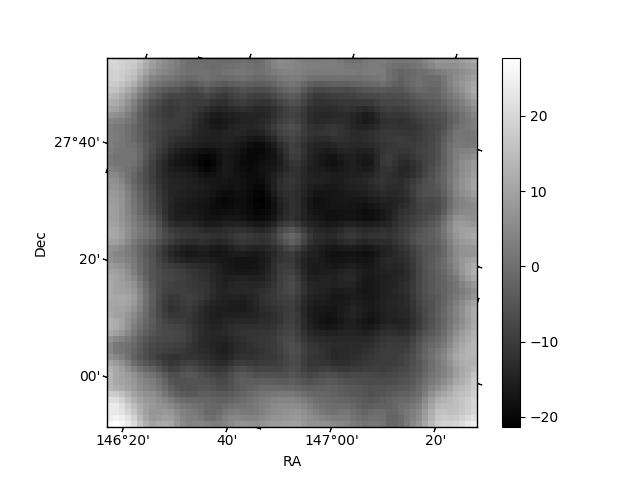
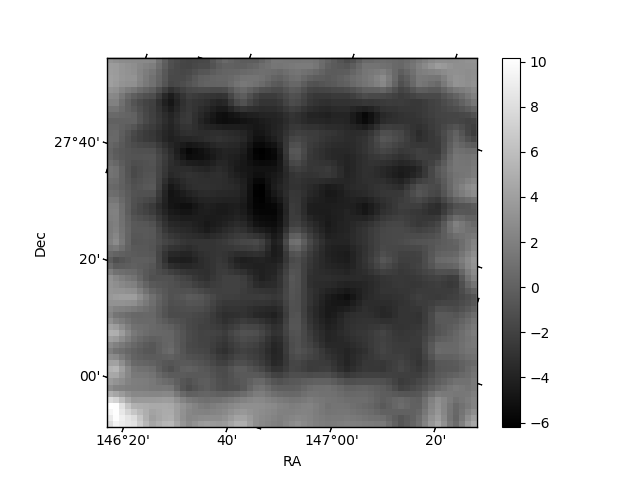
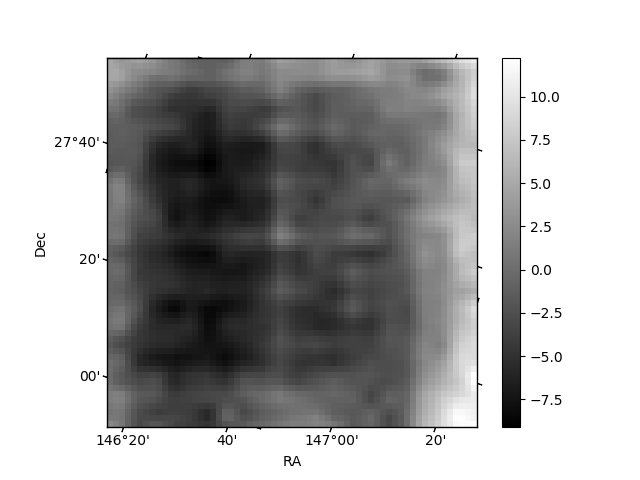
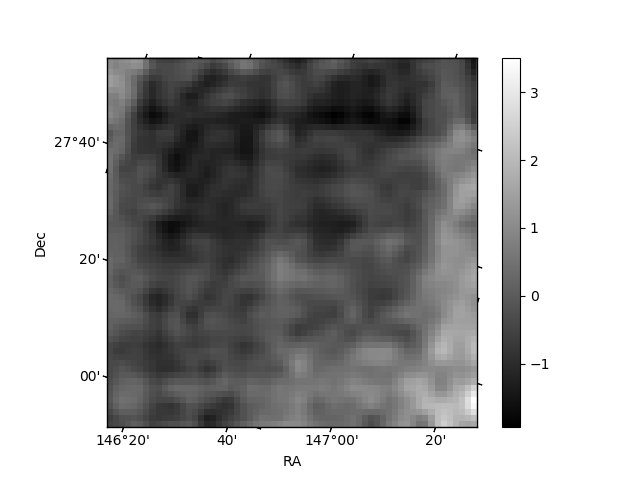
Histogram calculated using DETX and DETY for each event in the final _common_clean file
| Quadrant A | 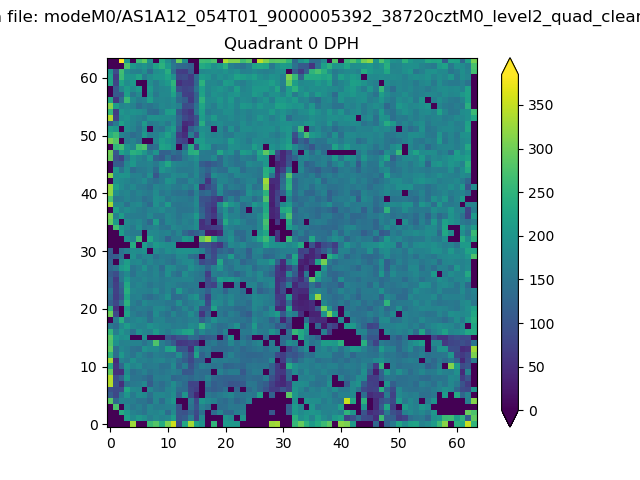 |
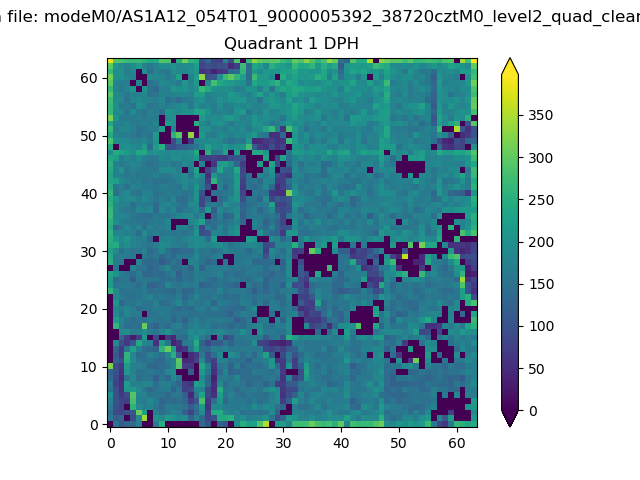 |
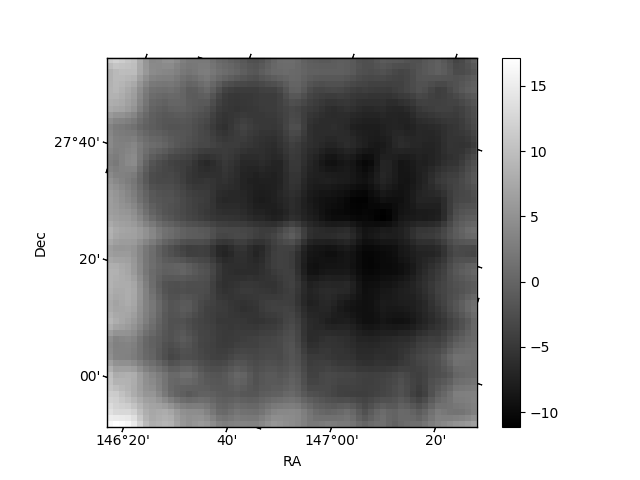
Quadrant B |
|---|---|---|---|
| Quadrant D | 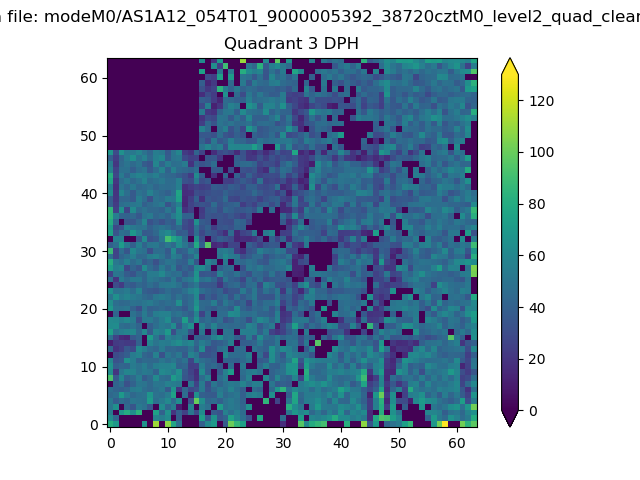 |
 |
Quadrant C |
| Plot type | Count rate plots | Images |
|---|---|---|
| Comparison with Poisson distribution Blue bars denote a histogram of data divided into 1 sec bins. Red curve is a Poisson curve with rate = median count rate of data. |
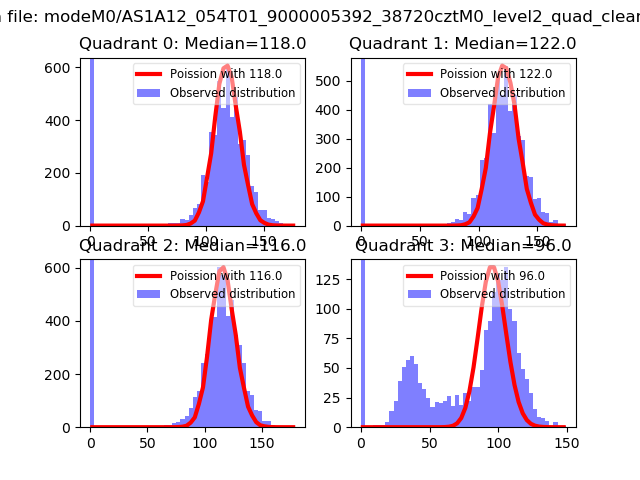 |
 |
| Quadrant-wise count rates Data is divided into 100 sec bins |
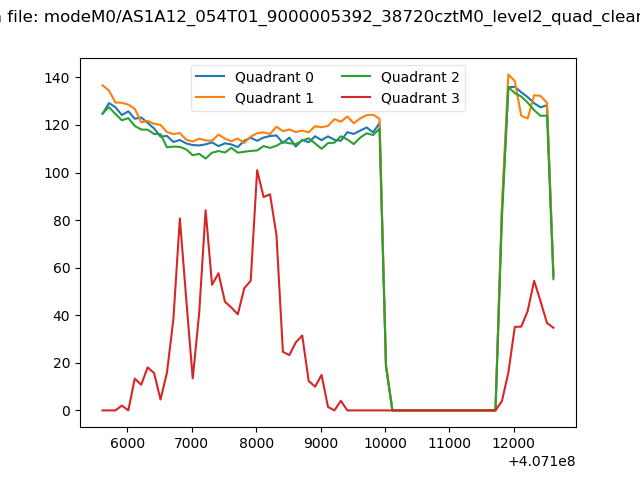 |
|
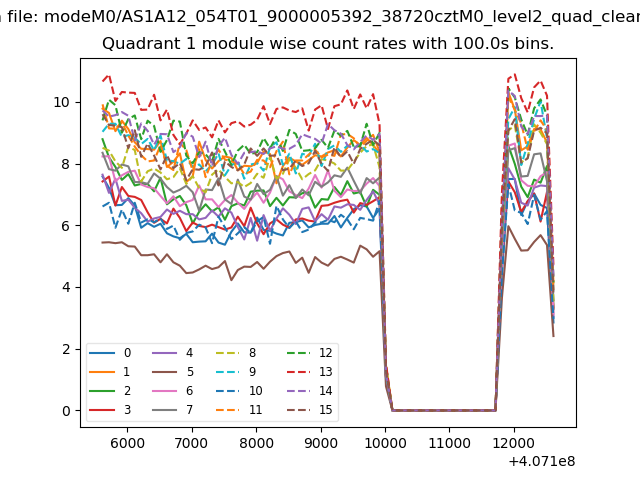
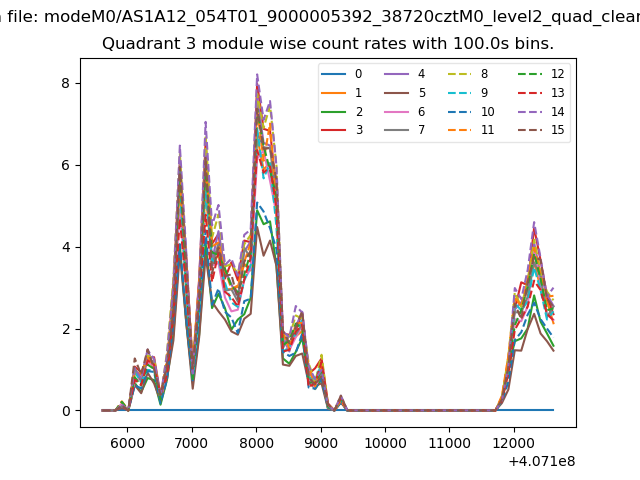
| Module-wise count rates for Quadrant A Data is divided into 100 sec bins |
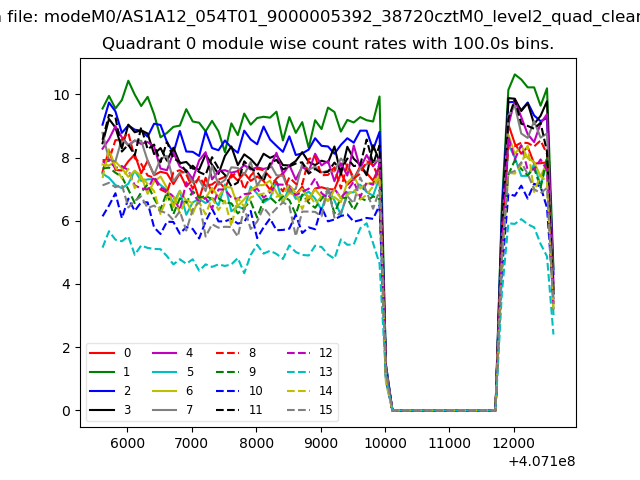 |
 |
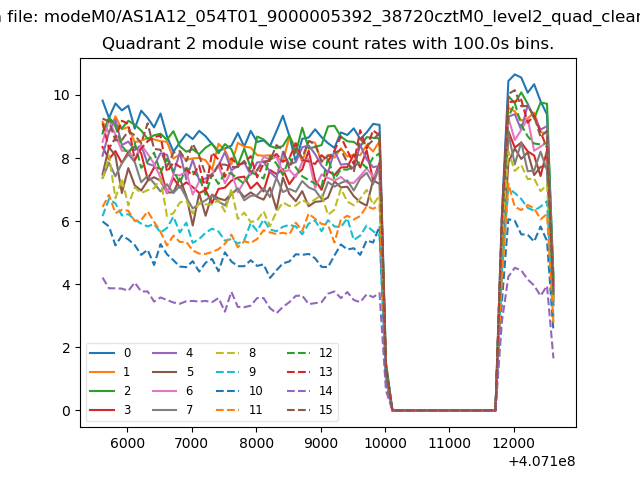
| Module-wise count rates for Quadrant B Data is divided into 100 sec bins |
 |
 |
| Module-wise count rates for Quadrant C Data is divided into 100 sec bins |
 |
 |
| Module-wise count rates for Quadrant D Data is divided into 100 sec bins |
 |
 |
| Parameter | Plot |
|---|---|
| CZT HV Monitor | 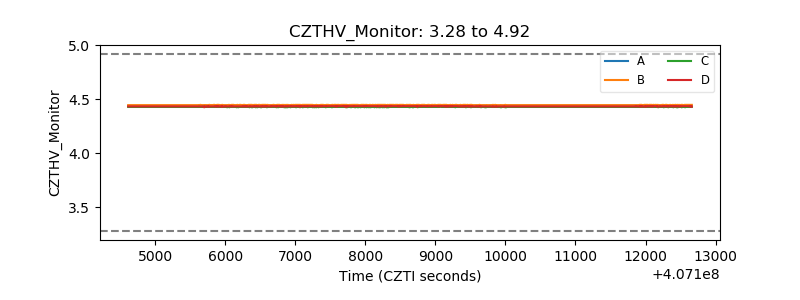 |
| D_VDD | 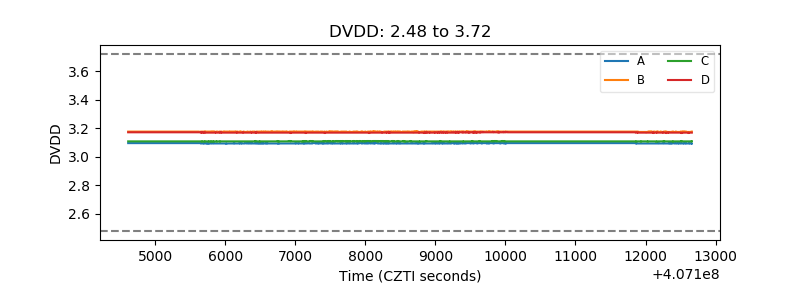 |
| Temperature 1 | 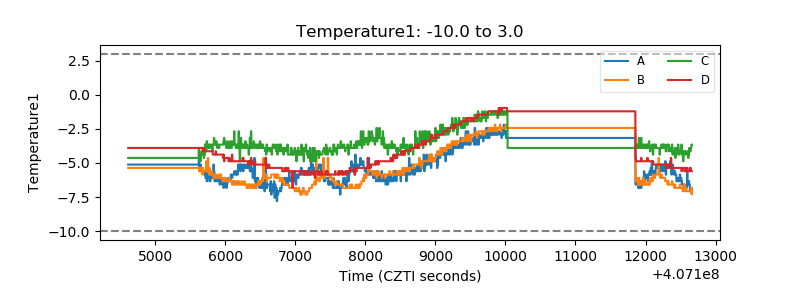 |
| Veto HV Monitor | 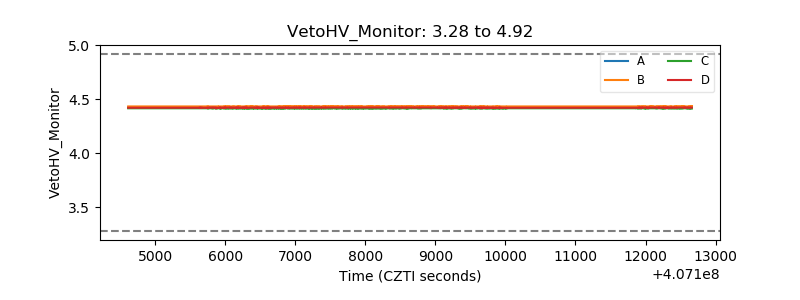 |
| Veto LLD | 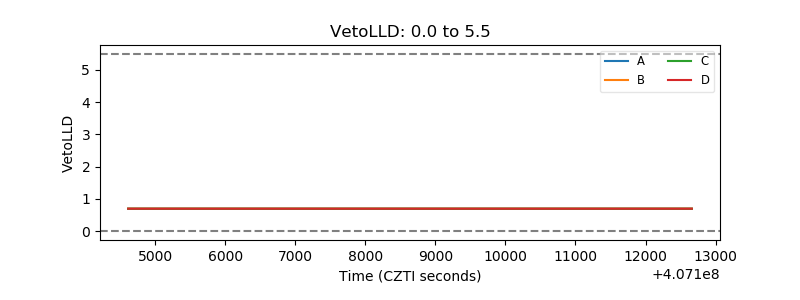 |
| Alpha Counter | 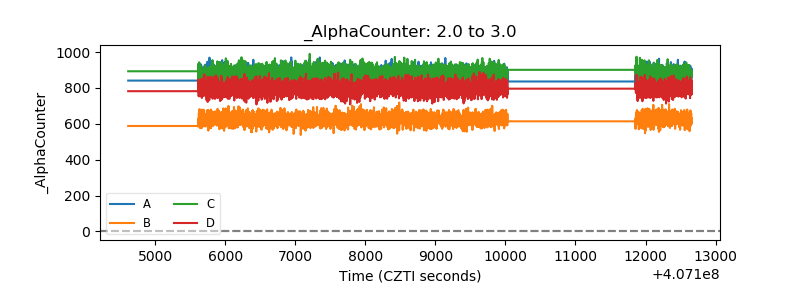 |
| _CPM_Rate | 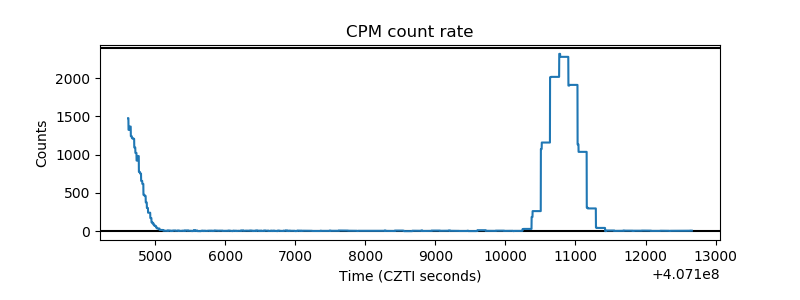 |
| CZT Counter | 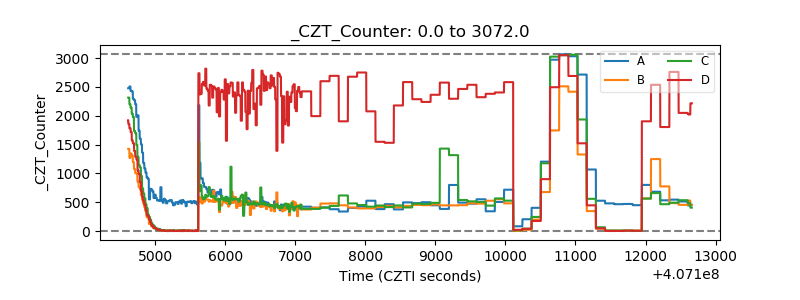 |
| +2.5 Volts monitor | 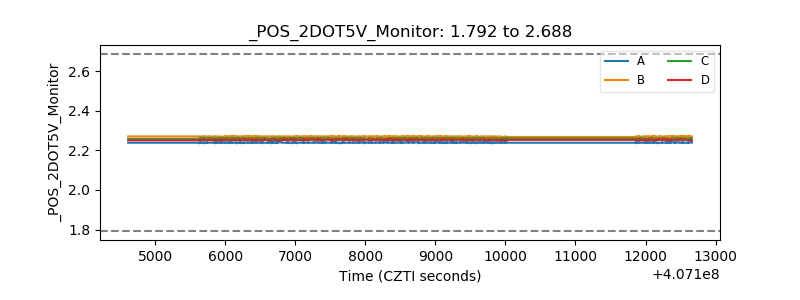 |
| +5 Volts monitor | 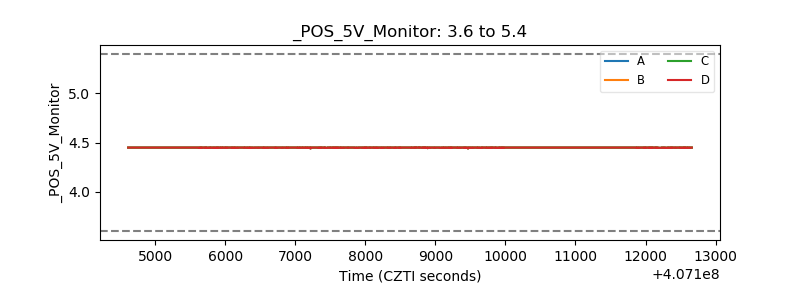 |
| _ROLL_ROT | 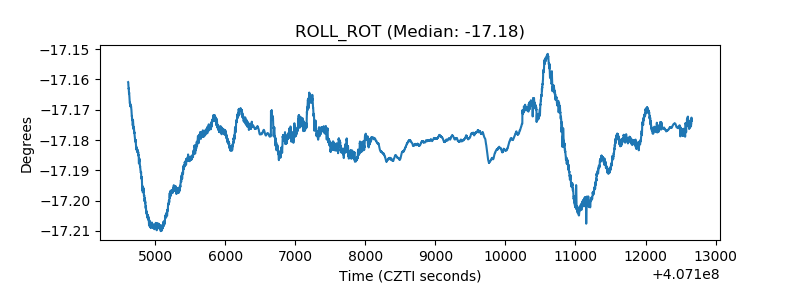 |
| _Roll_DEC | 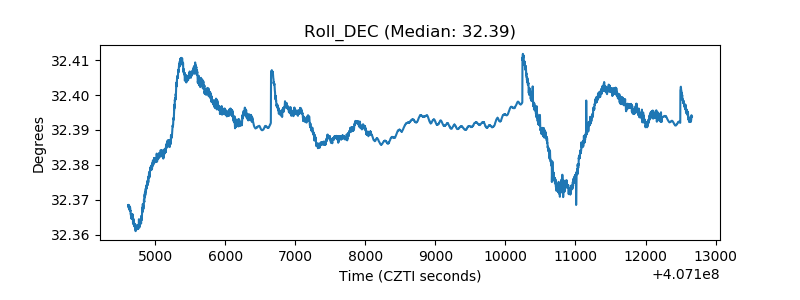 |
| _Roll_RA | 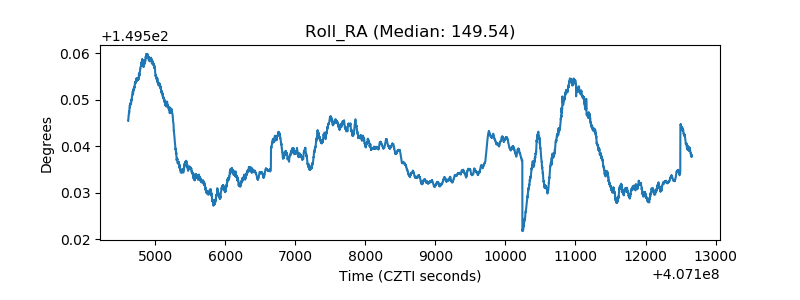 |
| Veto Counter | 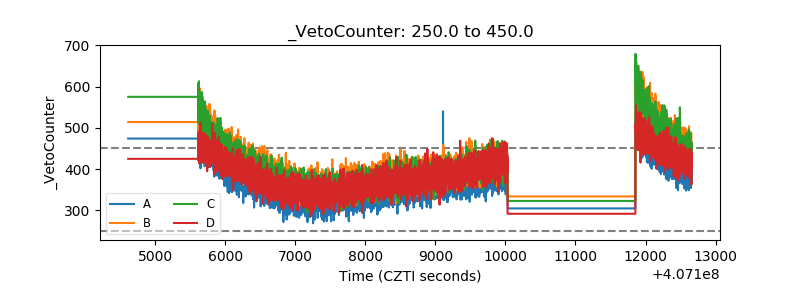 |