| Param | Original file | Final file |
|---|---|---|
| Filename | modeM0/AS1A12_054T01_9000005392_38721cztM0_level2.fits | modeM0/AS1A12_054T01_9000005392_38721cztM0_level2_quad_clean.evt |
| Size (bytes) | 557,991,360 | 88,680,960 |
| Size | 532.1 MB | 84.6 MB |
| Events in quadrant A | 2,966,767 | 674,184 |
| Events in quadrant B | 3,363,055 | 666,628 |
| Events in quadrant C | 2,738,711 | 654,774 |
| Events in quadrant D | 11,161,948 | 307,470 |
| Mode M9 | |||
|---|---|---|---|
| Quadrant | BADHDUFLAG | Total packets | Discarded packets |
| A | 0 | 27 | 0 |
| B | 0 | 27 | 0 |
| C | 0 | 27 | 0 |
| D | 0 | 28 | 0 |
| Mode SS | |||
|---|---|---|---|
| Quadrant | BADHDUFLAG | Total packets | Discarded packets |
| A | 0 | 110 | 0 |
| B | 0 | 110 | 0 |
| C | 0 | 110 | 0 |
| D | 0 | 110 | 0 |
| Mode M0 | |||
|---|---|---|---|
| Quadrant | BADHDUFLAG | Total packets | Discarded packets |
| A | 0 | 12140 | 3 |
| B | 0 | 13600 | 2 |
| C | 0 | 11387 | 2 |
| D | 0 | 36876 | 2 |
| Quadrant | Total seconds | Saturated seconds | Saturation percentage |
|---|---|---|---|
| A | 5463 | 25 | 0.457624% |
| B | 5463 | 282 | 5.161999% |
| C | 5463 | 15 | 0.274574% |
| D | 5463 | 3101 | 56.763683% |
Noise dominated data is calculated using 1-second bins in cleaned event files. If a bin has >2000 counts, and if more than 50% of those come from <1% of pixels, then it is considered to be noise-dominated and hence unusable.
| Quadrant | # 1 sec bins | Bins with >0 counts | Bins with >2000 counts | High rate bins dominated by noise | Noise dominated (total time) | Noise dominated (detector-on time) | Marked lightcurve |
|---|---|---|---|---|---|---|---|
| A | 7406 | 5464 | 16 | 16 | 0.22% | 0.29% | 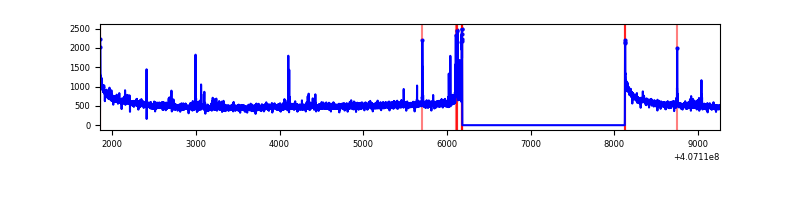 |
| B | 7406 | 5464 | 177 | 177 | 2.39% | 3.24% | 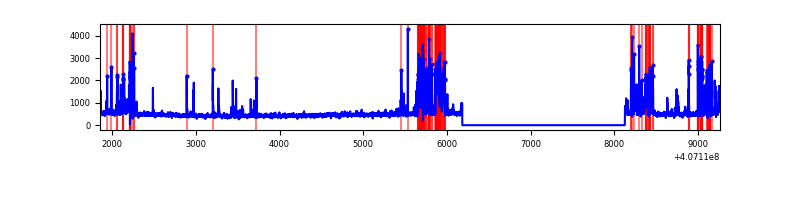 |
| C | 7406 | 5464 | 10 | 10 | 0.14% | 0.18% | 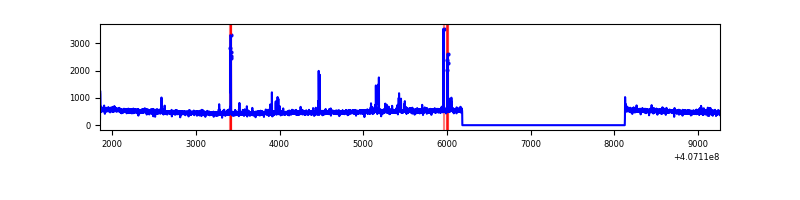 |
| D | 7406 | 5464 | 2929 | 2929 | 39.55% | 53.61% | 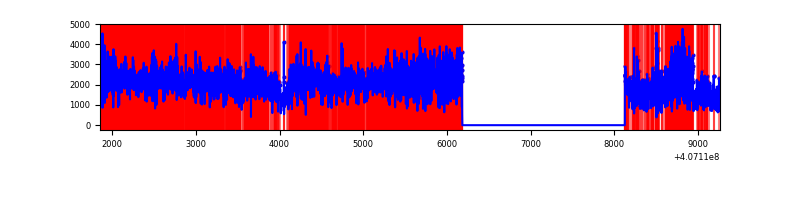 |
Top three noisy pixels from each quadrant. If the there are fewer than three noisy pixels in the level2.evt file, extra rows are filled as -1
| Pixel properties | Quadrant properties | ||||||
|---|---|---|---|---|---|---|---|
| Quadrant | DetID | PixID | Counts | Sigma | Mean | Median | Sigma |
| A | 10 | 83 | 397446 | 3103.0 | 629 | 619 | 127.9 |
| A | 0 | 8 | 58791 | 454.88 | 629 | 619 | 127.9 |
| A | 9 | 143 | 38751 | 298.17 | 629 | 619 | 127.9 |
| B | 4 | 171 | 859267 | 7299.78 | 619 | 604 | 117.6 |
| B | 5 | 172 | 30604 | 255.04 | 619 | 604 | 117.6 |
| B | 0 | 230 | 17439 | 143.12 | 619 | 604 | 117.6 |
| C | 15 | 214 | 227436 | 1592.35 | 616 | 622 | 142.4 |
| C | 15 | 208 | 93080 | 649.1 | 616 | 622 | 142.4 |
| C | 14 | 254 | 12965 | 86.65 | 616 | 622 | 142.4 |
| D | 2 | 16 | 5023903 | 41708.11 | 492 | 477 | 120.4 |
| D | 12 | 235 | 3256327 | 27032.42 | 492 | 477 | 120.4 |
| D | 2 | 249 | 415084 | 3442.37 | 492 | 477 | 120.4 |
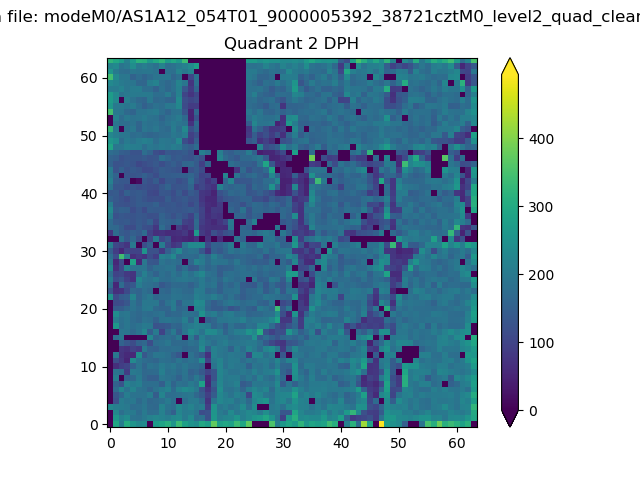
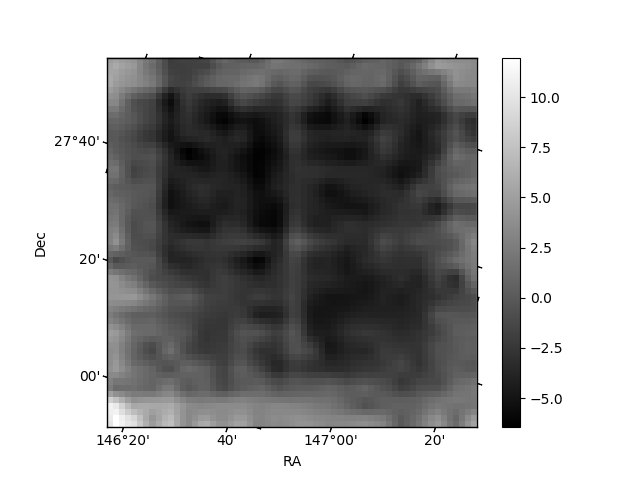
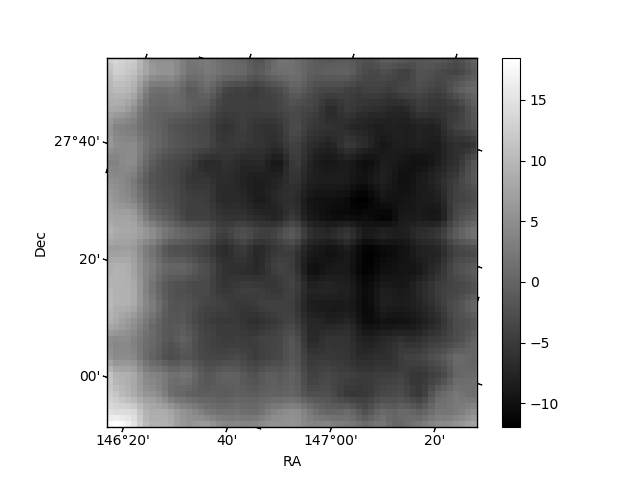
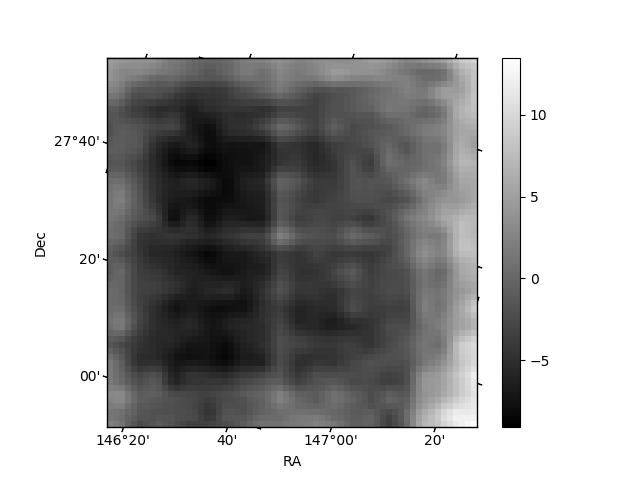
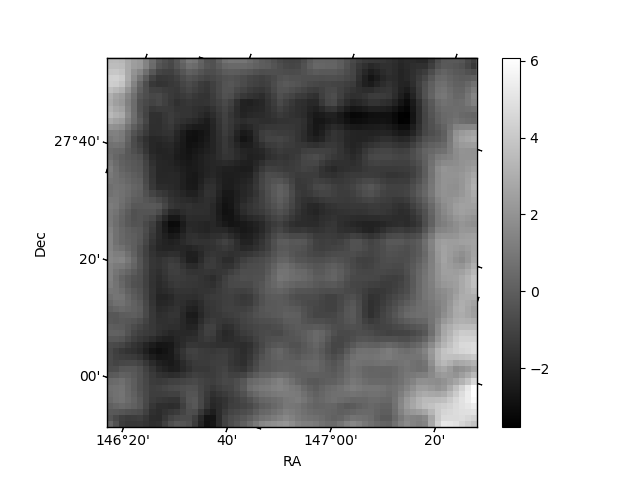
Histogram calculated using DETX and DETY for each event in the final _common_clean file
| Quadrant A | 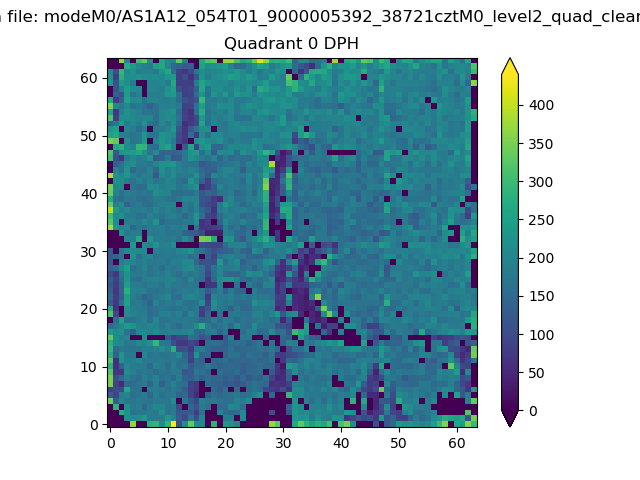 |
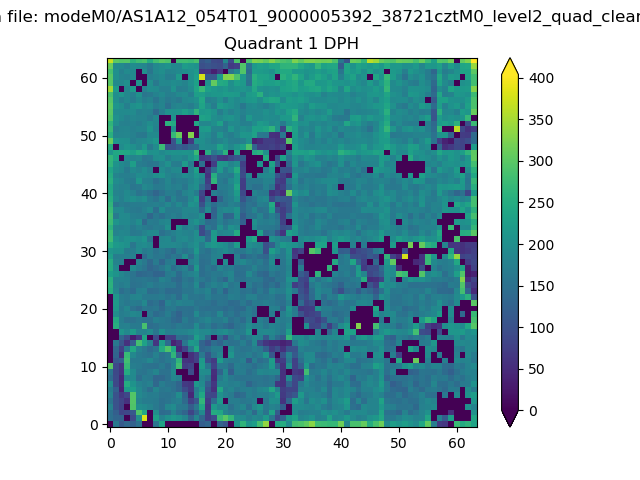 |
Quadrant B |
|---|---|---|---|
| Quadrant D | 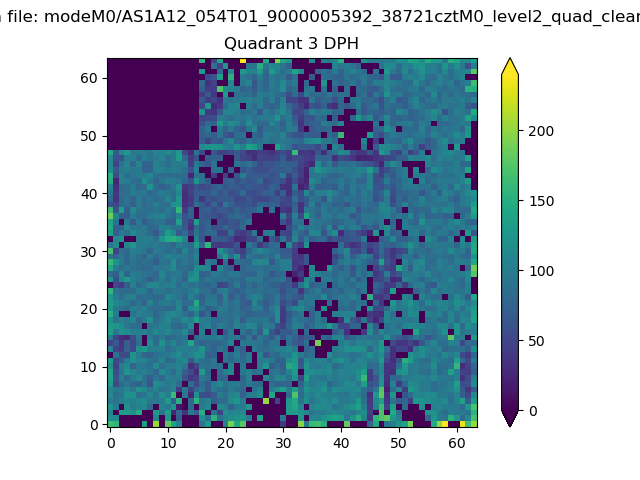 |
 |
Quadrant C |
| Plot type | Count rate plots | Images |
|---|---|---|
| Comparison with Poisson distribution Blue bars denote a histogram of data divided into 1 sec bins. Red curve is a Poisson curve with rate = median count rate of data. |
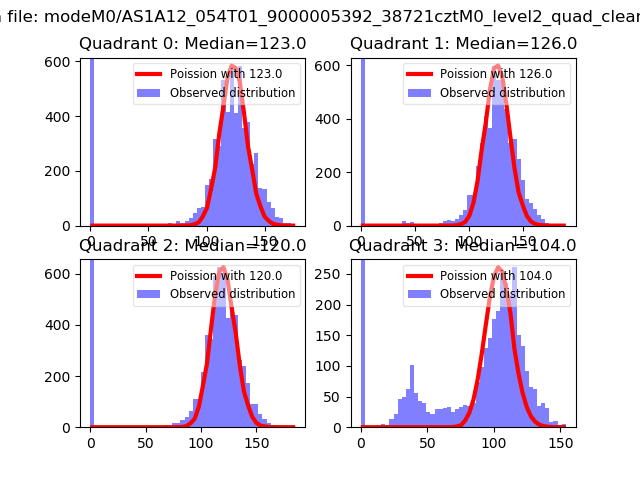 |
 |
| Quadrant-wise count rates Data is divided into 100 sec bins |
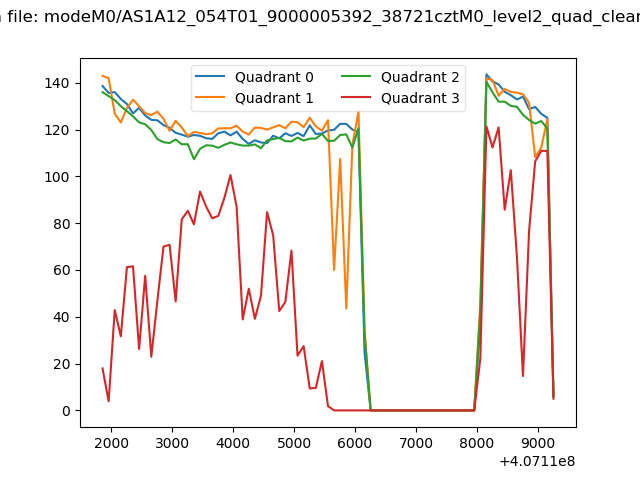 |
|
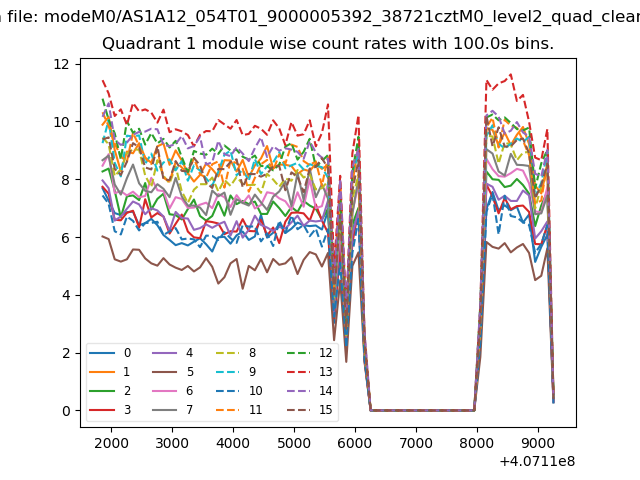
| Module-wise count rates for Quadrant A Data is divided into 100 sec bins |
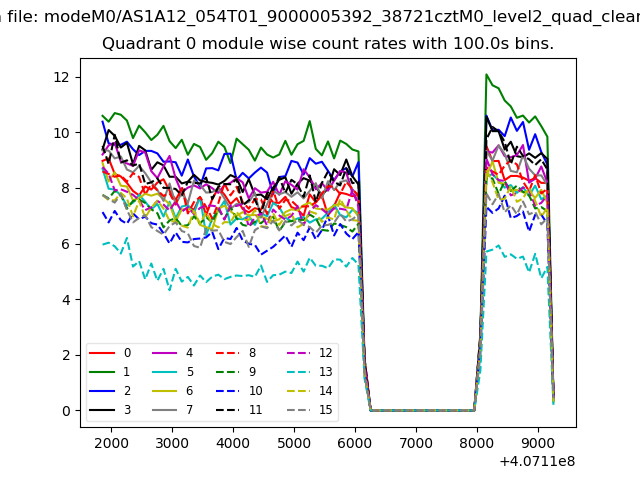 |
 |
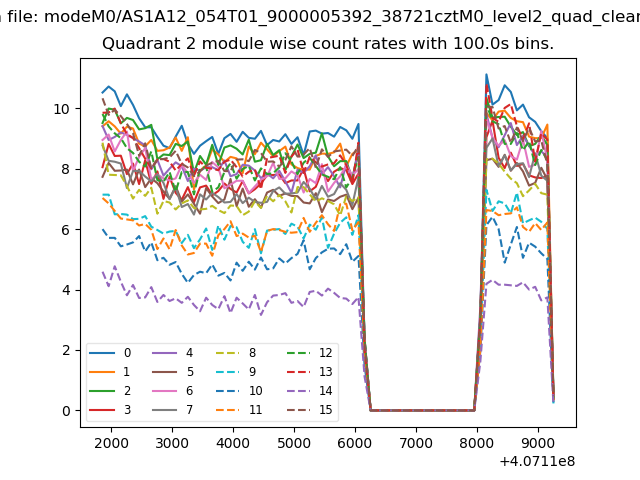
| Module-wise count rates for Quadrant B Data is divided into 100 sec bins |
 |
 |
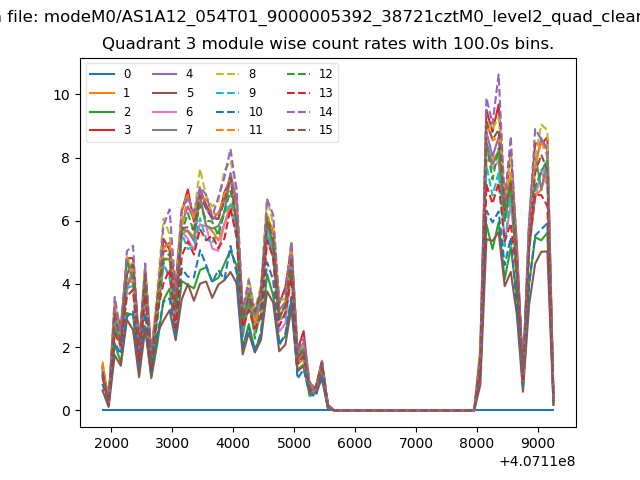
| Module-wise count rates for Quadrant C Data is divided into 100 sec bins |
 |
 |
| Module-wise count rates for Quadrant D Data is divided into 100 sec bins |
 |
 |
| Parameter | Plot |
|---|---|
| CZT HV Monitor | 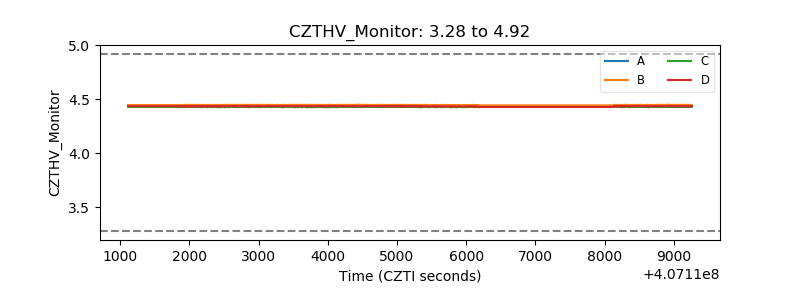 |
| D_VDD | 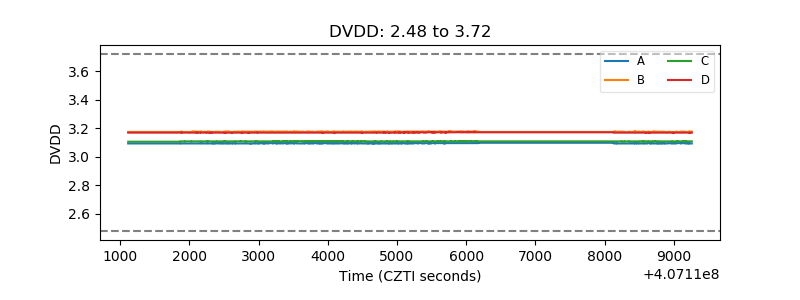 |
| Temperature 1 | 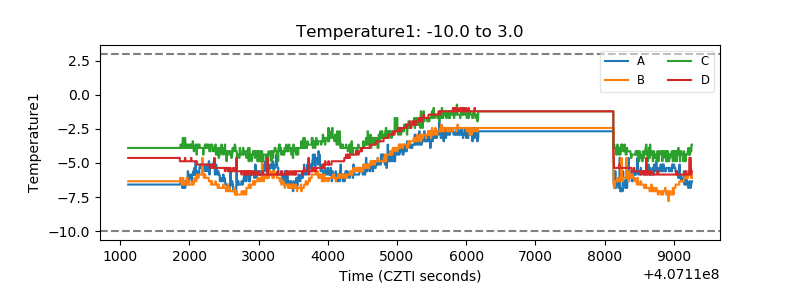 |
| Veto HV Monitor | 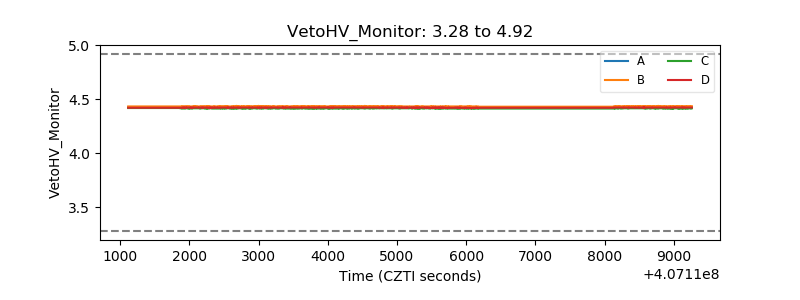 |
| Veto LLD | 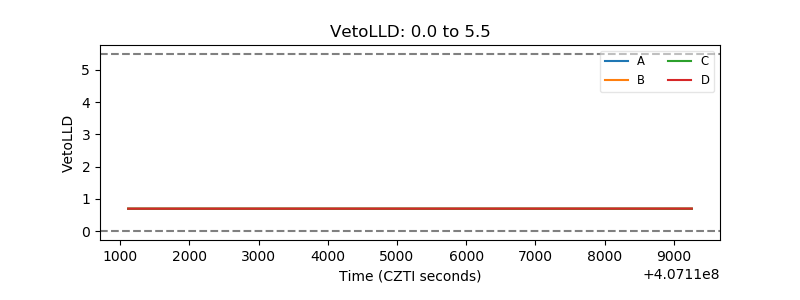 |
| Alpha Counter | 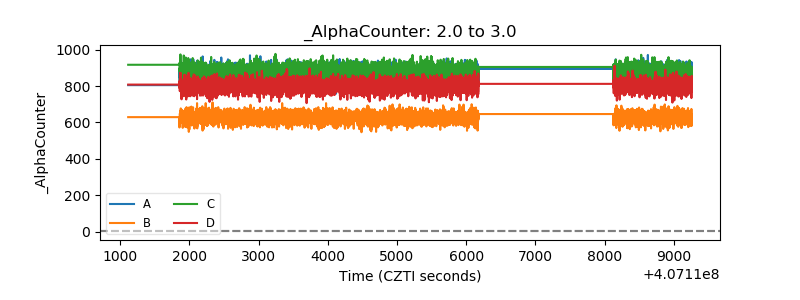 |
| _CPM_Rate | 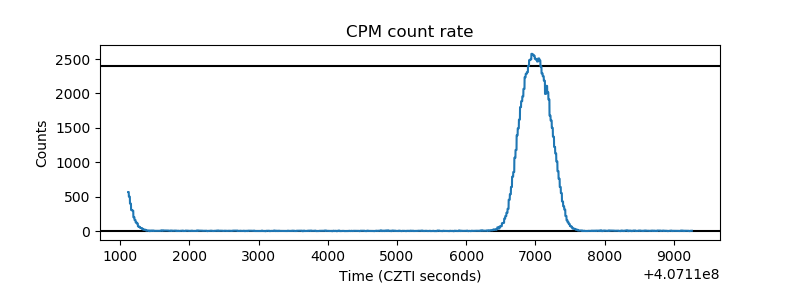 |
| CZT Counter | 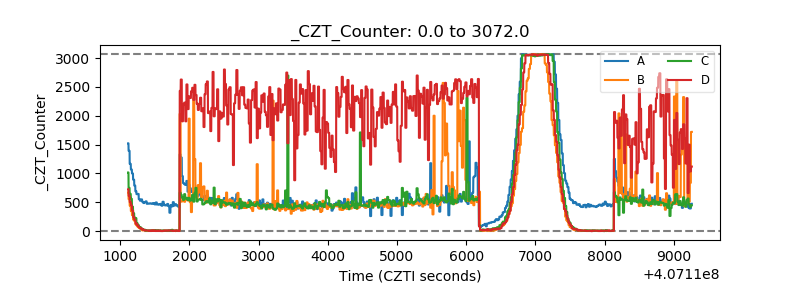 |
| +2.5 Volts monitor | 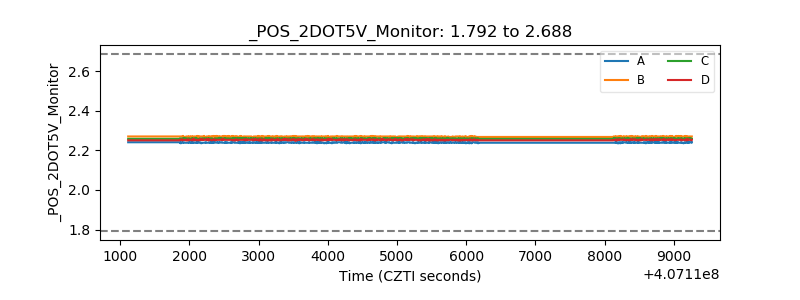 |
| +5 Volts monitor | 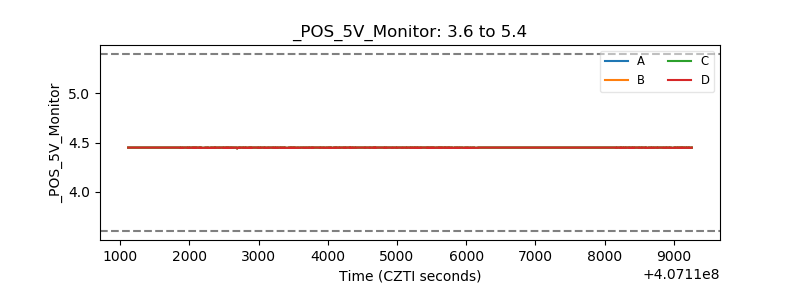 |
| _ROLL_ROT | 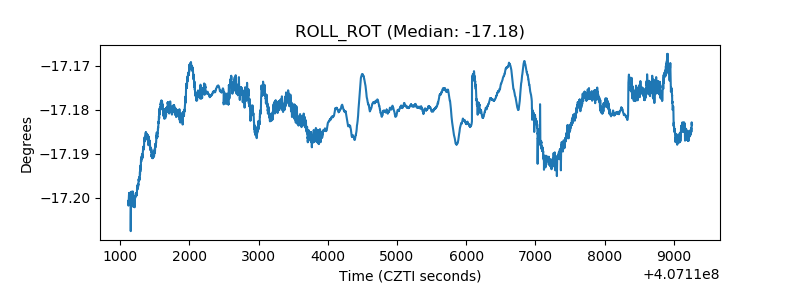 |
| _Roll_DEC | 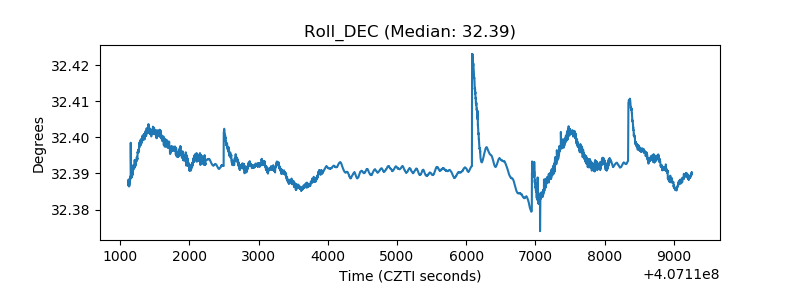 |
| _Roll_RA | 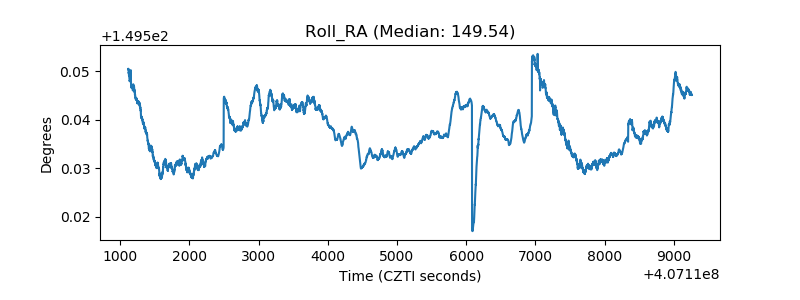 |
| Veto Counter | 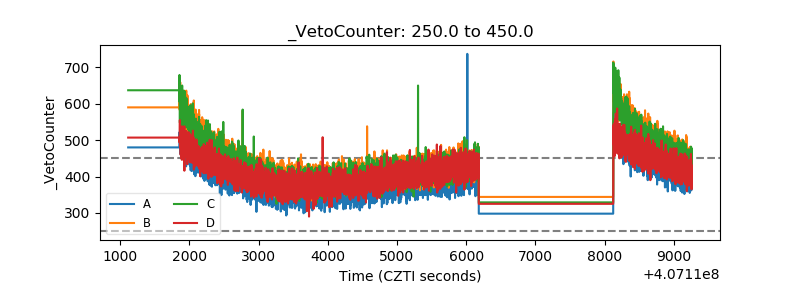 |