| Param | Original file | Final file |
|---|---|---|
| Filename | modeM0/AS1A12_054T01_9000005392_38722cztM0_level2.fits | modeM0/AS1A12_054T01_9000005392_38722cztM0_level2_quad_clean.evt |
| Size (bytes) | 507,850,560 | 93,522,240 |
| Size | 484.3 MB | 89.2 MB |
| Events in quadrant A | 2,950,050 | 678,762 |
| Events in quadrant B | 3,022,840 | 690,096 |
| Events in quadrant C | 2,739,973 | 657,763 |
| Events in quadrant D | 9,668,643 | 428,652 |
| Mode M9 | |||
|---|---|---|---|
| Quadrant | BADHDUFLAG | Total packets | Discarded packets |
| A | 0 | 26 | 0 |
| B | 0 | 26 | 0 |
| C | 0 | 26 | 0 |
| D | 0 | 27 | 0 |
| Mode SS | |||
|---|---|---|---|
| Quadrant | BADHDUFLAG | Total packets | Discarded packets |
| A | 0 | 110 | 0 |
| B | 0 | 110 | 0 |
| C | 0 | 110 | 0 |
| D | 0 | 110 | 0 |
| Mode M0 | |||
|---|---|---|---|
| Quadrant | BADHDUFLAG | Total packets | Discarded packets |
| A | 0 | 12027 | 3 |
| B | 0 | 12381 | 2 |
| C | 0 | 11308 | 2 |
| D | 0 | 32436 | 2 |
| Quadrant | Total seconds | Saturated seconds | Saturation percentage |
|---|---|---|---|
| A | 5378 | 11 | 0.204537% |
| B | 5378 | 104 | 1.933804% |
| C | 5378 | 7 | 0.130160% |
| D | 5378 | 1924 | 35.775381% |
Noise dominated data is calculated using 1-second bins in cleaned event files. If a bin has >2000 counts, and if more than 50% of those come from <1% of pixels, then it is considered to be noise-dominated and hence unusable.
| Quadrant | # 1 sec bins | Bins with >0 counts | Bins with >2000 counts | High rate bins dominated by noise | Noise dominated (total time) | Noise dominated (detector-on time) | Marked lightcurve |
|---|---|---|---|---|---|---|---|
| A | 7439 | 5379 | 9 | 9 | 0.12% | 0.17% | 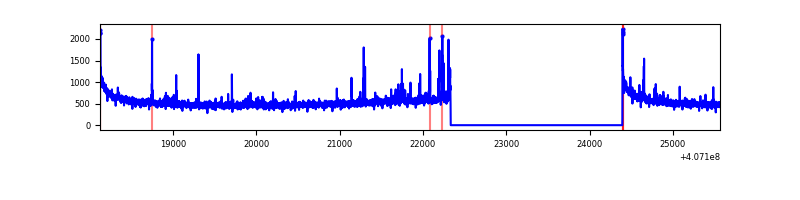 |
| B | 7439 | 5379 | 74 | 74 | 0.99% | 1.38% | 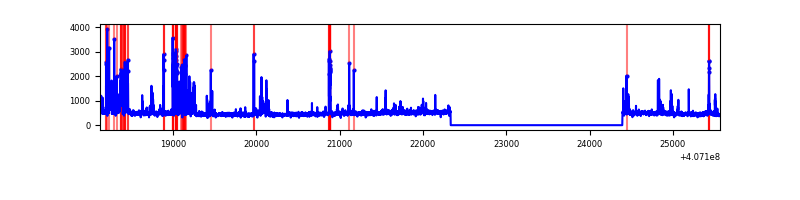 |
| C | 7439 | 5379 | 5 | 5 | 0.07% | 0.09% | 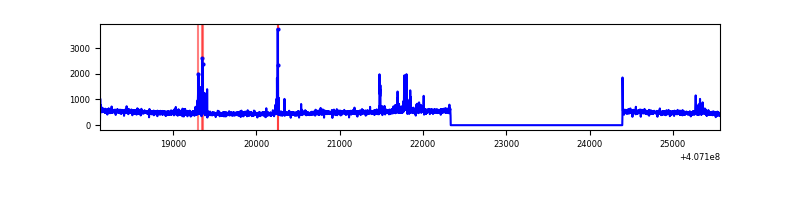 |
| D | 7439 | 5379 | 1710 | 1710 | 22.99% | 31.79% | 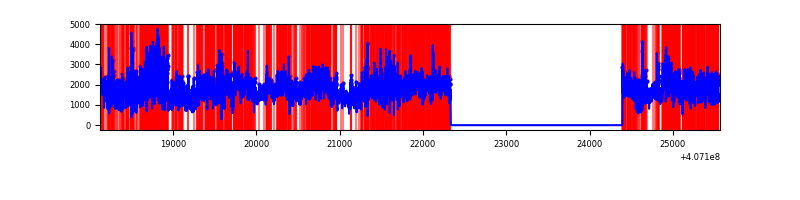 |
Top three noisy pixels from each quadrant. If the there are fewer than three noisy pixels in the level2.evt file, extra rows are filled as -1
| Pixel properties | Quadrant properties | ||||||
|---|---|---|---|---|---|---|---|
| Quadrant | DetID | PixID | Counts | Sigma | Mean | Median | Sigma |
| A | 10 | 83 | 396963 | 3131.51 | 627 | 618 | 126.6 |
| A | 13 | 248 | 86053 | 675.02 | 627 | 618 | 126.6 |
| A | 9 | 143 | 27271 | 210.58 | 627 | 618 | 126.6 |
| B | 4 | 171 | 483901 | 4066.79 | 624 | 608 | 118.8 |
| B | 5 | 184 | 30109 | 248.24 | 624 | 608 | 118.8 |
| B | 0 | 230 | 25854 | 212.44 | 624 | 608 | 118.8 |
| C | 15 | 214 | 223538 | 1578.18 | 610 | 614 | 141.3 |
| C | 15 | 208 | 129275 | 910.85 | 610 | 614 | 141.3 |
| C | 0 | 10 | 7925 | 51.76 | 610 | 614 | 141.3 |
| D | 2 | 16 | 5819261 | 43627.26 | 544 | 530 | 133.4 |
| D | 12 | 227 | 614860 | 4606.08 | 544 | 530 | 133.4 |
| D | 2 | 249 | 503524 | 3771.31 | 544 | 530 | 133.4 |
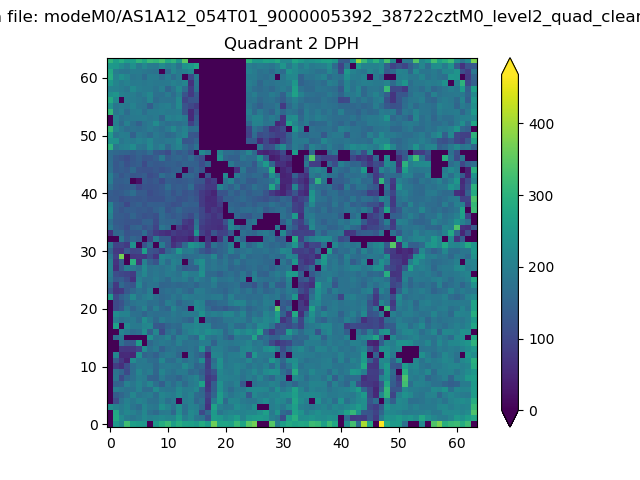
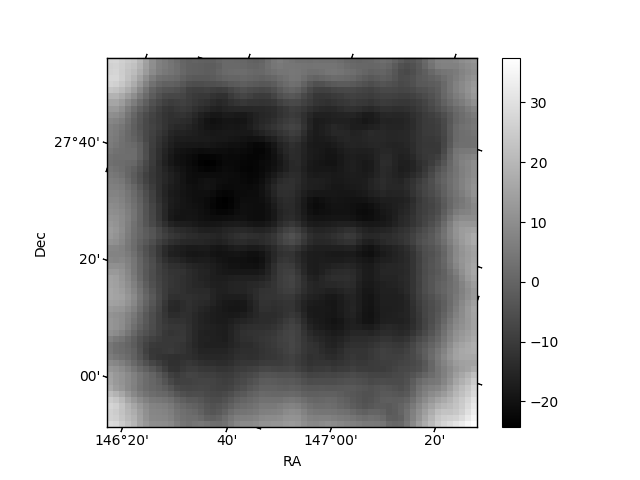
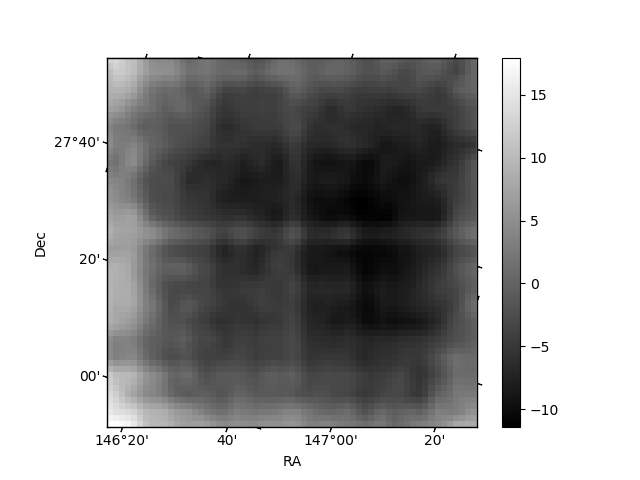
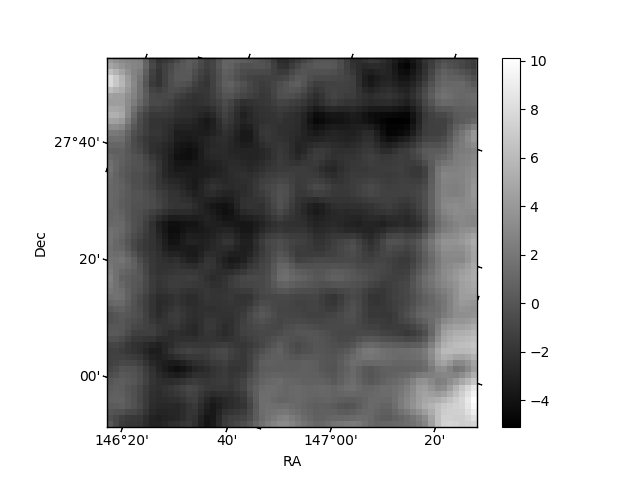
Histogram calculated using DETX and DETY for each event in the final _common_clean file
| Quadrant A | 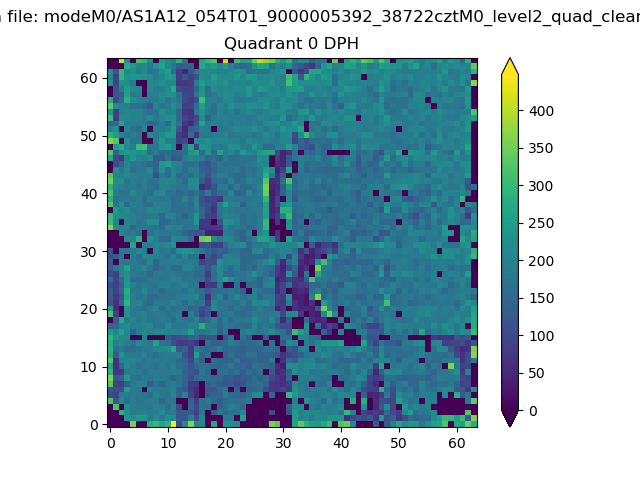 |
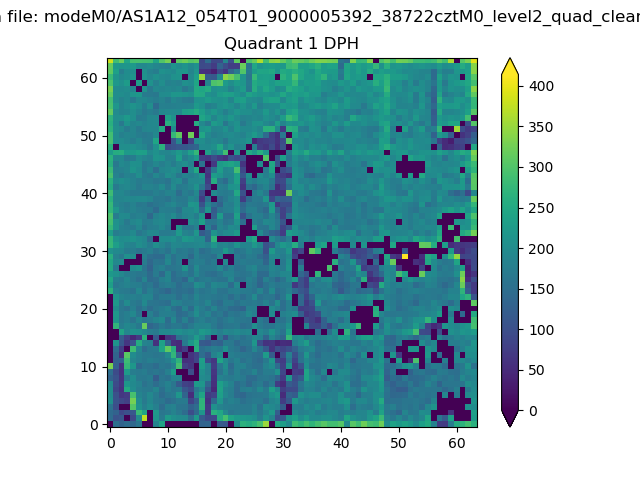 |
Quadrant B |
|---|---|---|---|
| Quadrant D | 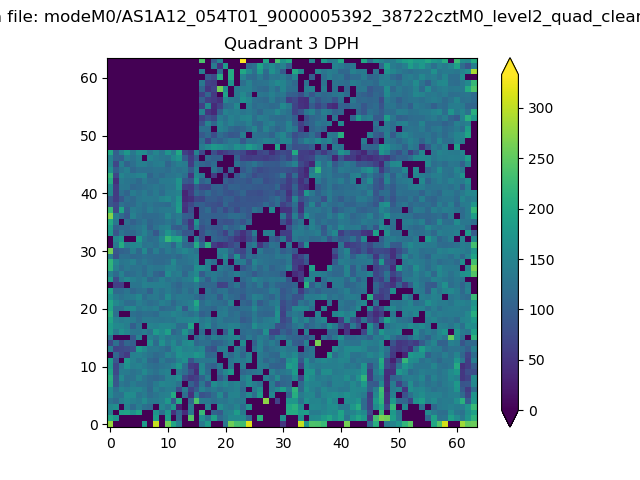 |
 |
Quadrant C |
| Plot type | Count rate plots | Images |
|---|---|---|
| Comparison with Poisson distribution Blue bars denote a histogram of data divided into 1 sec bins. Red curve is a Poisson curve with rate = median count rate of data. |
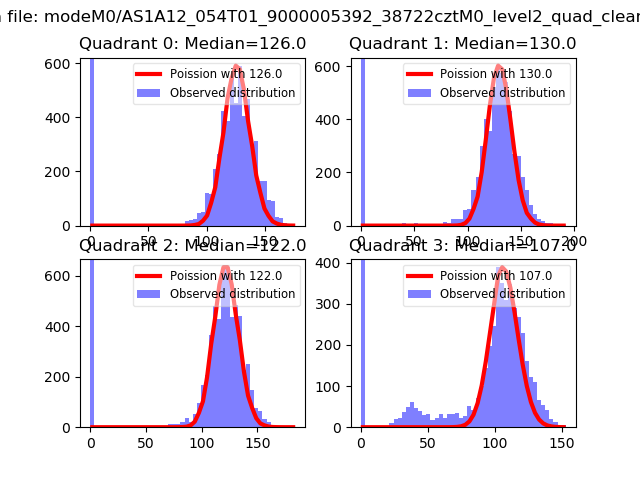 |
 |
| Quadrant-wise count rates Data is divided into 100 sec bins |
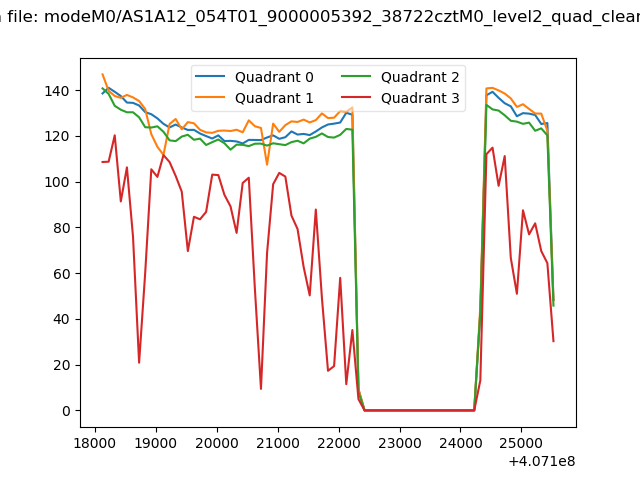 |
|
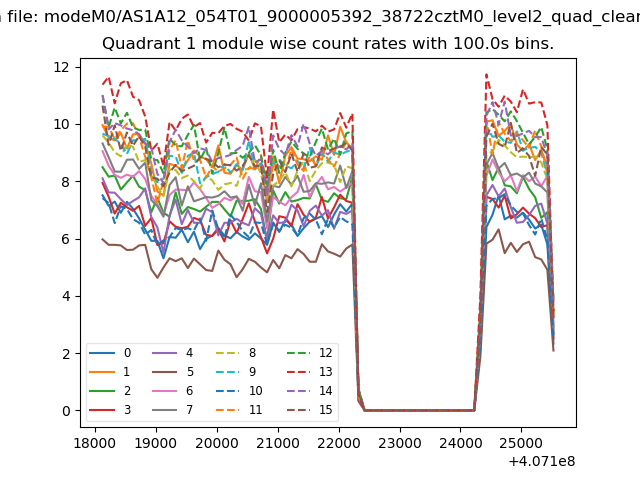
| Module-wise count rates for Quadrant A Data is divided into 100 sec bins |
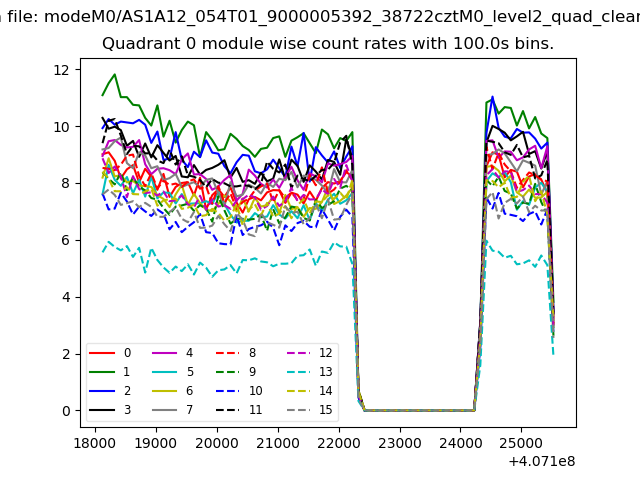 |
 |
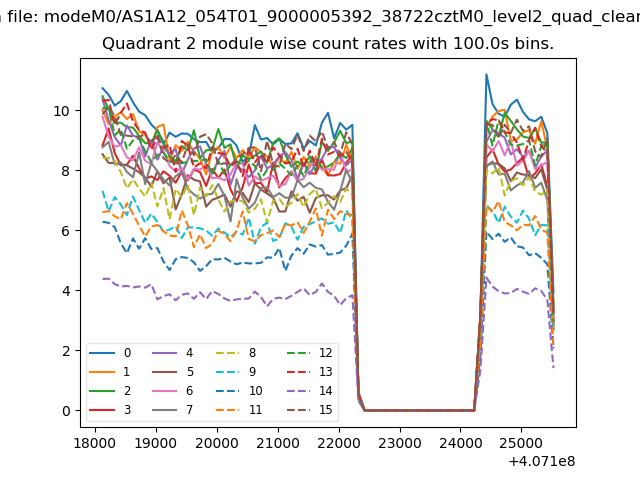
| Module-wise count rates for Quadrant B Data is divided into 100 sec bins |
 |
 |
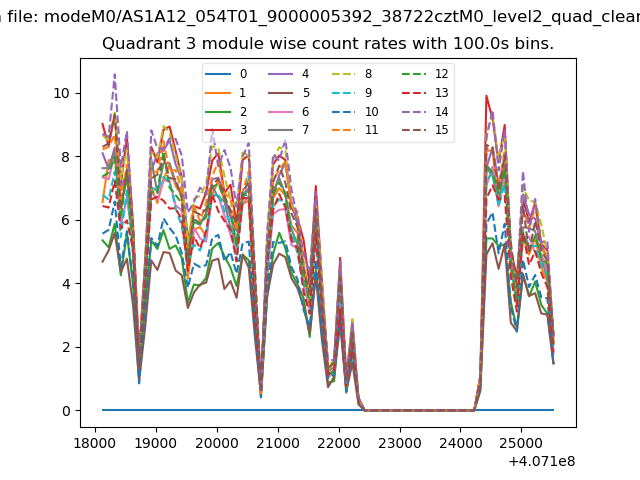
| Module-wise count rates for Quadrant C Data is divided into 100 sec bins |
 |
 |
| Module-wise count rates for Quadrant D Data is divided into 100 sec bins |
 |
 |
| Parameter | Plot |
|---|---|
| CZT HV Monitor | 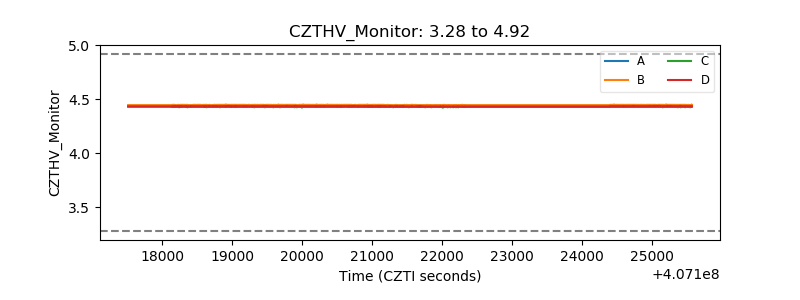 |
| D_VDD | 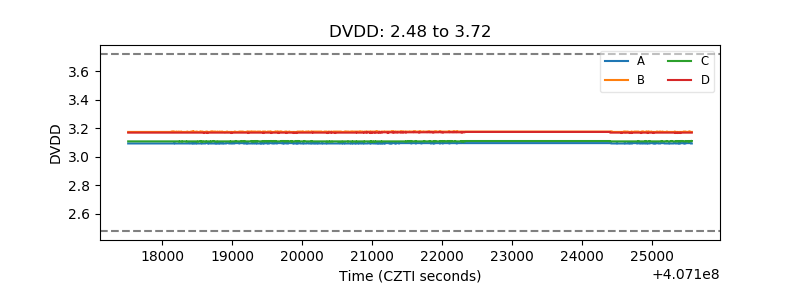 |
| Temperature 1 | 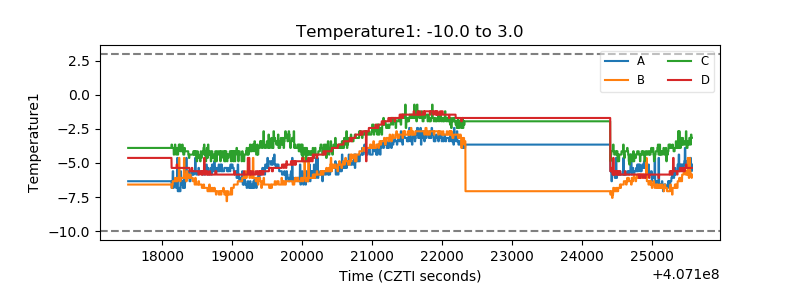 |
| Veto HV Monitor | 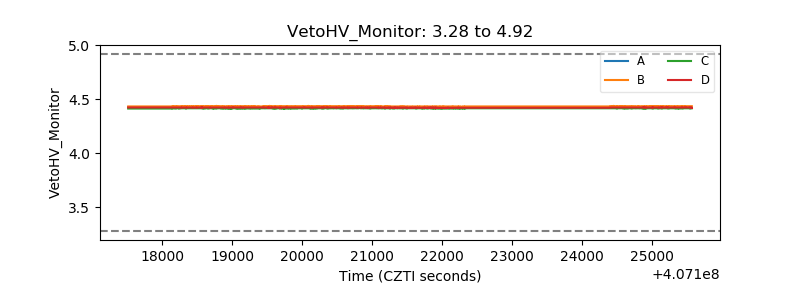 |
| Veto LLD | 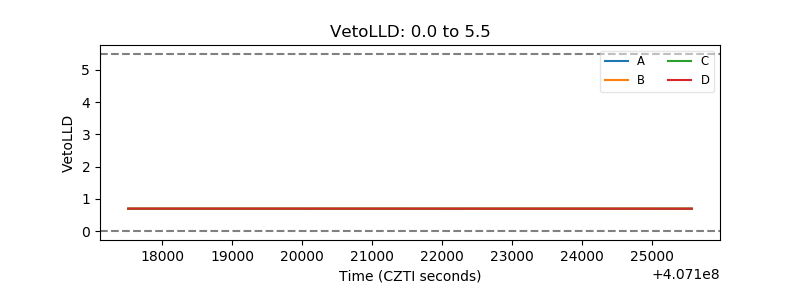 |
| Alpha Counter | 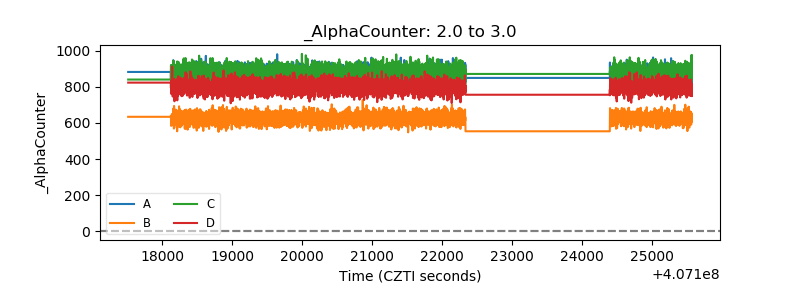 |
| _CPM_Rate | 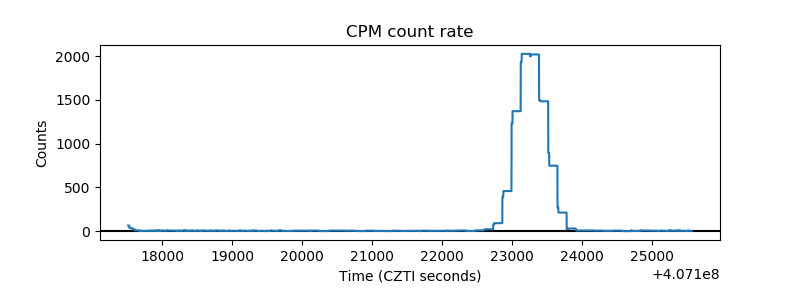 |
| CZT Counter | 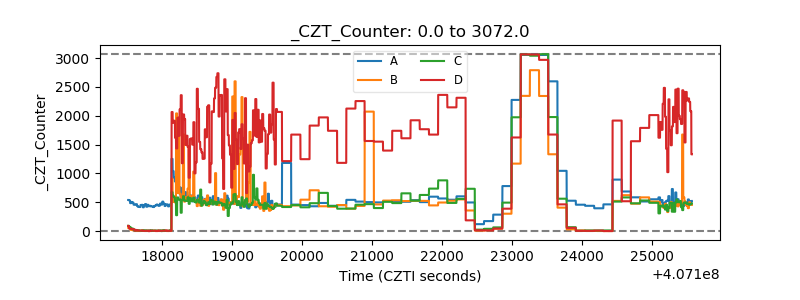 |
| +2.5 Volts monitor | 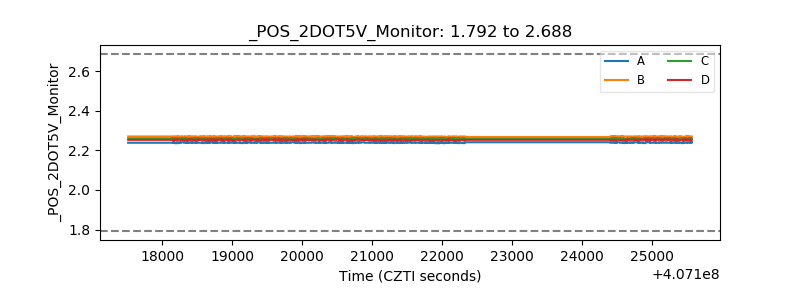 |
| +5 Volts monitor | 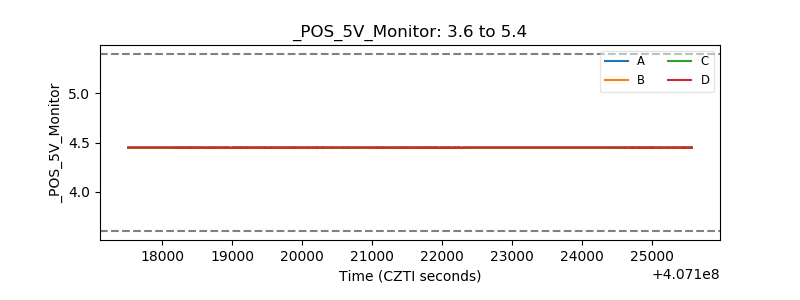 |
| _ROLL_ROT | 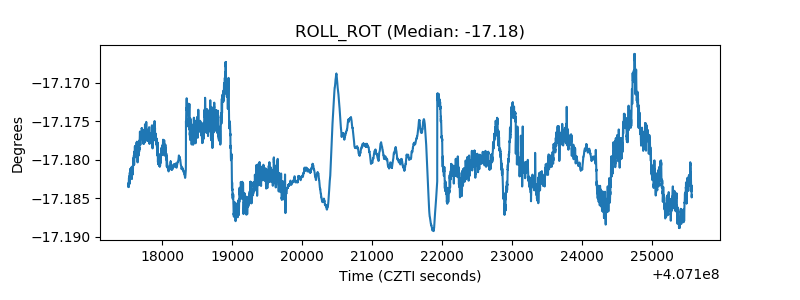 |
| _Roll_DEC | 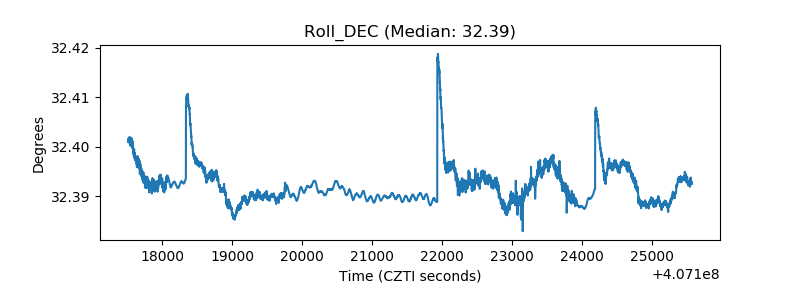 |
| _Roll_RA | 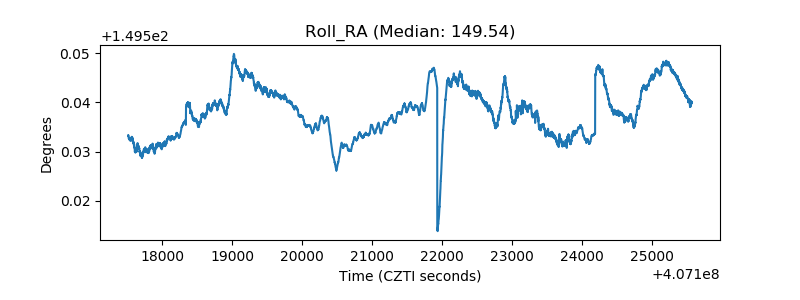 |
| Veto Counter | 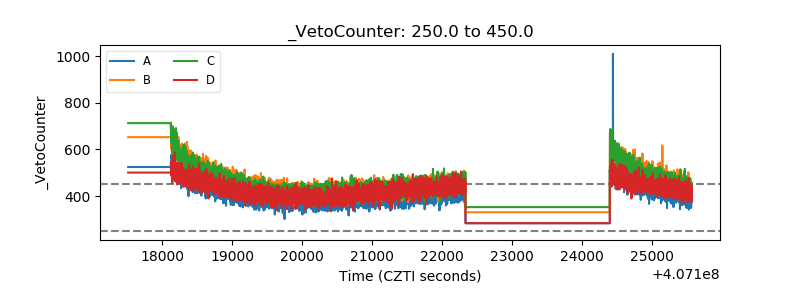 |