| Param | Original file | Final file |
|---|---|---|
| Filename | modeM0/AS1A12_054T01_9000005392_38723cztM0_level2.fits | modeM0/AS1A12_054T01_9000005392_38723cztM0_level2_quad_clean.evt |
| Size (bytes) | 498,228,480 | 85,639,680 |
| Size | 475.1 MB | 81.7 MB |
| Events in quadrant A | 3,009,036 | 637,334 |
| Events in quadrant B | 2,678,801 | 661,776 |
| Events in quadrant C | 2,513,474 | 621,631 |
| Events in quadrant D | 9,839,953 | 310,825 |
| Mode M9 | |||
|---|---|---|---|
| Quadrant | BADHDUFLAG | Total packets | Discarded packets |
| A | 0 | 21 | 0 |
| B | 0 | 21 | 0 |
| C | 0 | 21 | 0 |
| D | 0 | 21 | 0 |
| Mode SS | |||
|---|---|---|---|
| Quadrant | BADHDUFLAG | Total packets | Discarded packets |
| A | 0 | 106 | 0 |
| B | 0 | 106 | 0 |
| C | 0 | 106 | 0 |
| D | 0 | 106 | 0 |
| Mode M0 | |||
|---|---|---|---|
| Quadrant | BADHDUFLAG | Total packets | Discarded packets |
| A | 0 | 12055 | 3 |
| B | 0 | 11169 | 2 |
| C | 0 | 10503 | 2 |
| D | 0 | 32769 | 2 |
| Quadrant | Total seconds | Saturated seconds | Saturation percentage |
|---|---|---|---|
| A | 5162 | 61 | 1.181713% |
| B | 5162 | 27 | 0.523053% |
| C | 5162 | 3 | 0.058117% |
| D | 5162 | 2705 | 52.402170% |
Noise dominated data is calculated using 1-second bins in cleaned event files. If a bin has >2000 counts, and if more than 50% of those come from <1% of pixels, then it is considered to be noise-dominated and hence unusable.
| Quadrant | # 1 sec bins | Bins with >0 counts | Bins with >2000 counts | High rate bins dominated by noise | Noise dominated (total time) | Noise dominated (detector-on time) | Marked lightcurve |
|---|---|---|---|---|---|---|---|
| A | 7285 | 5163 | 48 | 48 | 0.66% | 0.93% | 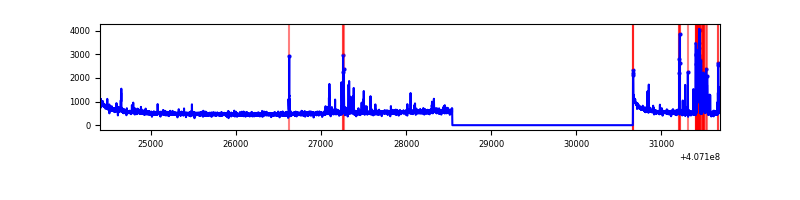 |
| B | 7285 | 5163 | 15 | 15 | 0.21% | 0.29% | 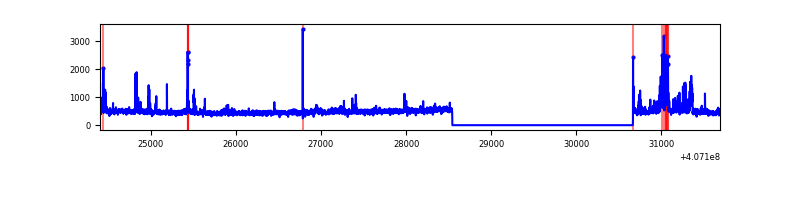 |
| C | 7285 | 5163 | 0 | 0 | 0.00% | 0.00% | 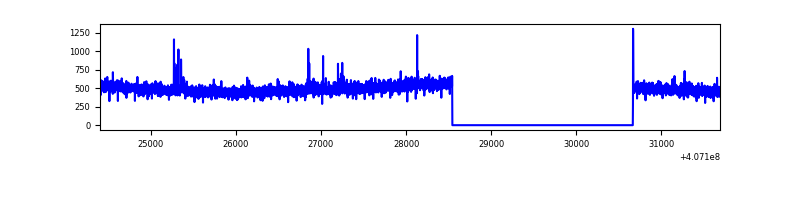 |
| D | 7285 | 5163 | 2343 | 2343 | 32.16% | 45.38% | 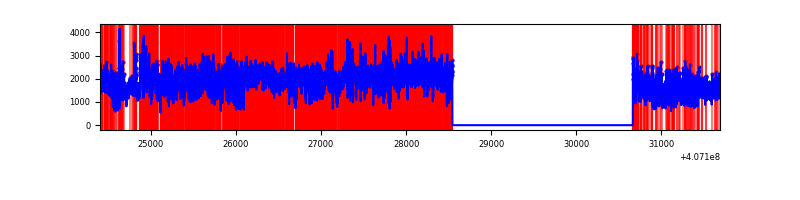 |
Top three noisy pixels from each quadrant. If the there are fewer than three noisy pixels in the level2.evt file, extra rows are filled as -1
| Pixel properties | Quadrant properties | ||||||
|---|---|---|---|---|---|---|---|
| Quadrant | DetID | PixID | Counts | Sigma | Mean | Median | Sigma |
| A | 10 | 83 | 383034 | 3164.04 | 599 | 589 | 120.9 |
| A | 9 | 143 | 240314 | 1983.29 | 599 | 589 | 120.9 |
| A | 13 | 248 | 64269 | 526.84 | 599 | 589 | 120.9 |
| B | 5 | 184 | 198454 | 1748.63 | 599 | 586 | 113.2 |
| B | 4 | 171 | 66164 | 579.54 | 599 | 586 | 113.2 |
| B | 0 | 213 | 20292 | 174.15 | 599 | 586 | 113.2 |
| C | 15 | 214 | 216405 | 1606.55 | 582 | 588 | 134.3 |
| C | 15 | 208 | 19004 | 137.09 | 582 | 588 | 134.3 |
| C | 0 | 10 | 4101 | 26.15 | 582 | 588 | 134.3 |
| D | 2 | 16 | 6390581 | 52278.86 | 496 | 482 | 122.2 |
| D | 12 | 235 | 672328 | 5496.53 | 496 | 482 | 122.2 |
| D | 12 | 227 | 503450 | 4114.9 | 496 | 482 | 122.2 |
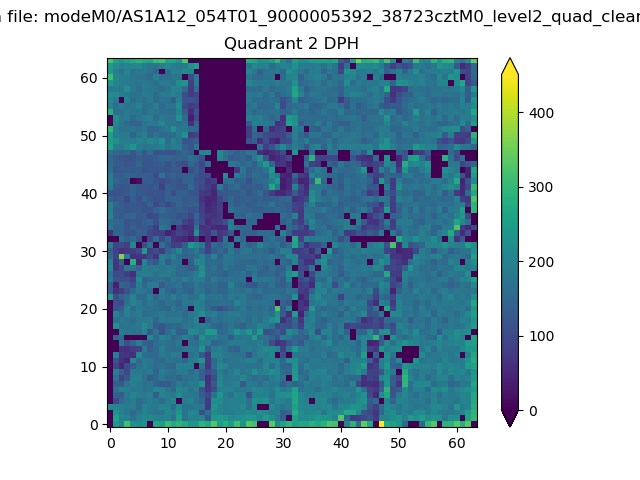
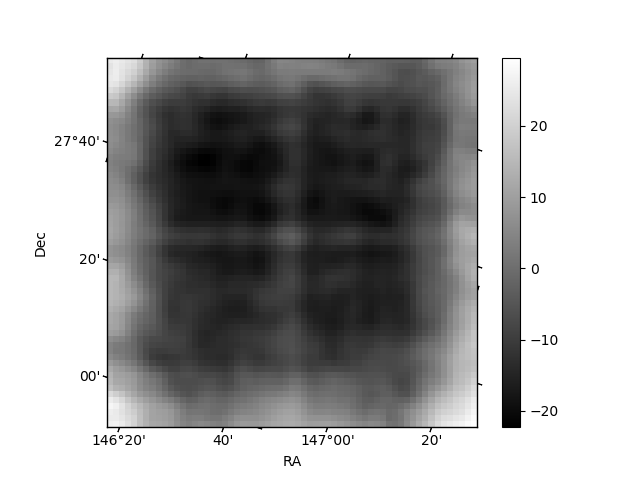
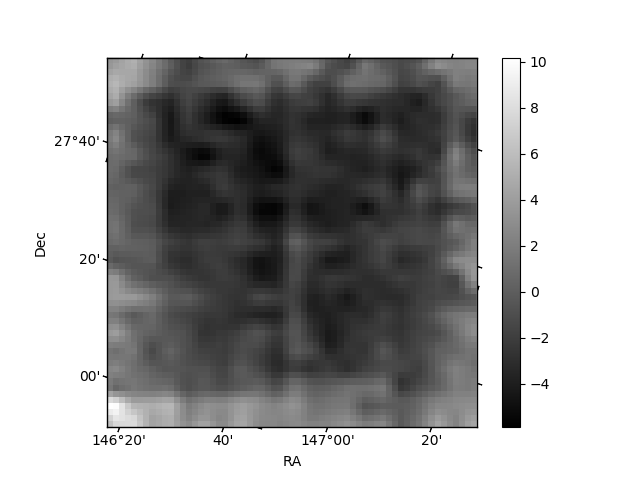
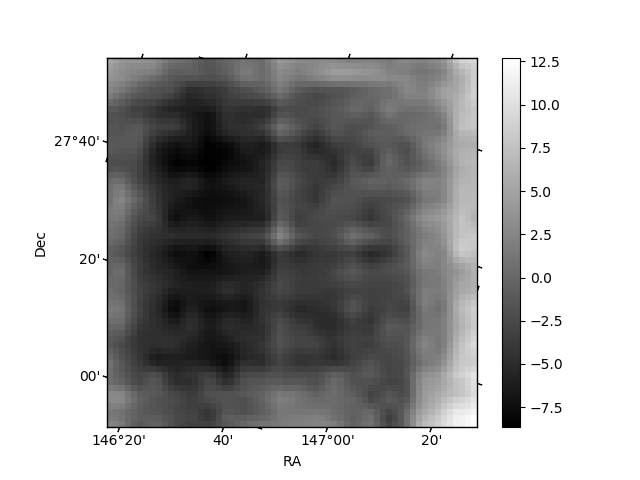
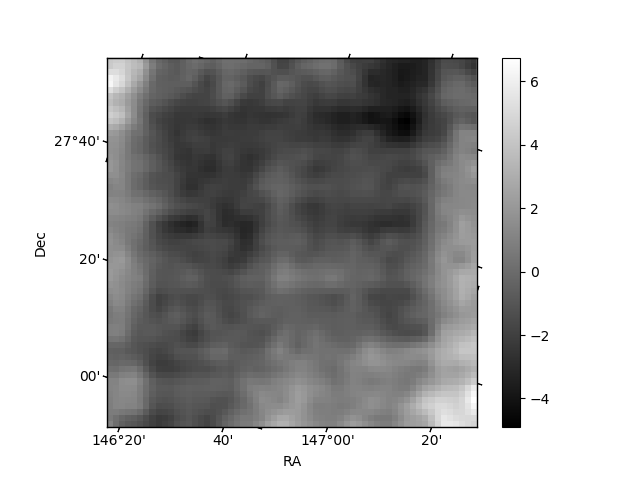
Histogram calculated using DETX and DETY for each event in the final _common_clean file
| Quadrant A | 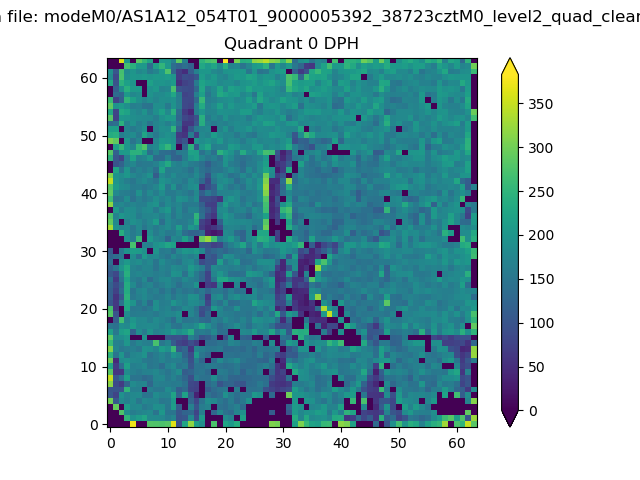 |
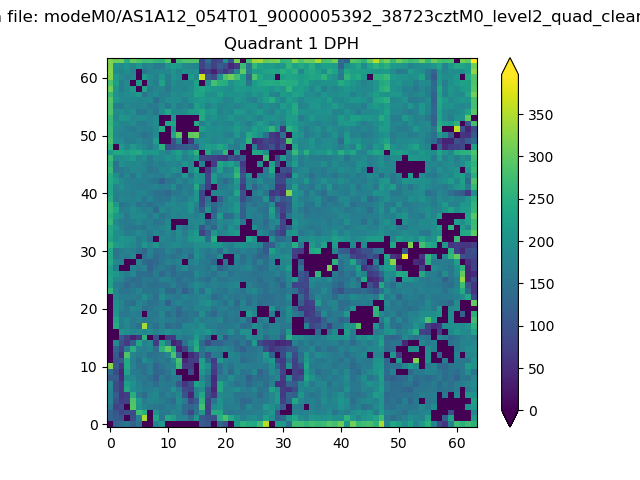 |
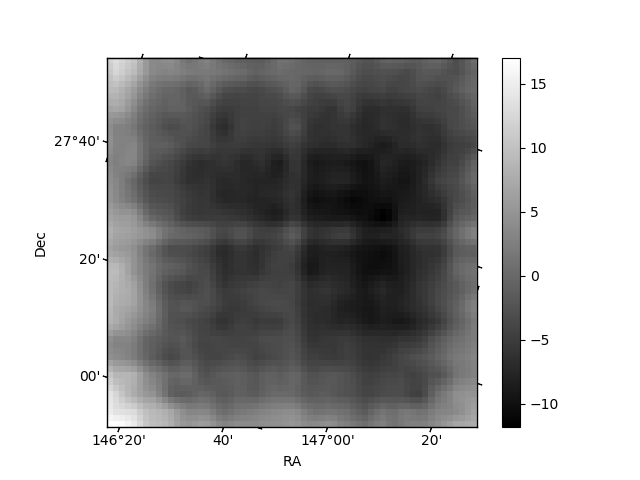
Quadrant B |
|---|---|---|---|
| Quadrant D | 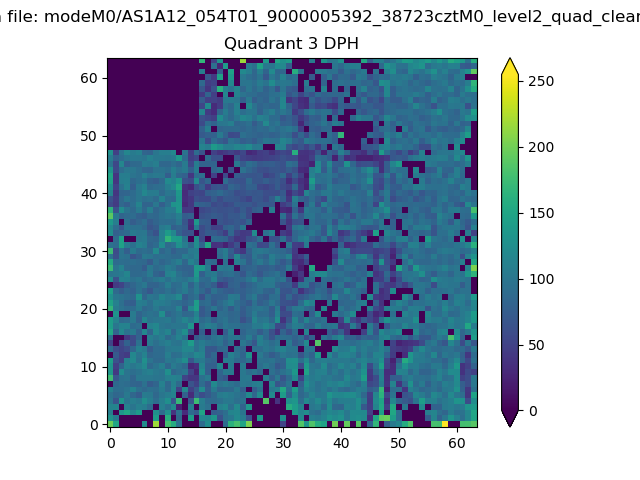 |
 |
Quadrant C |
| Plot type | Count rate plots | Images |
|---|---|---|
| Comparison with Poisson distribution Blue bars denote a histogram of data divided into 1 sec bins. Red curve is a Poisson curve with rate = median count rate of data. |
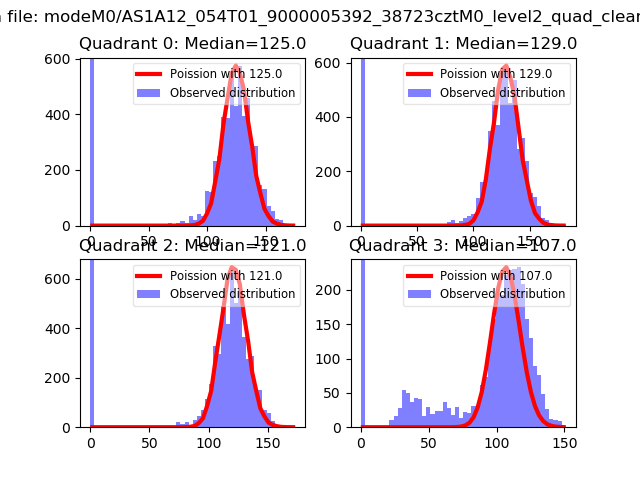 |
 |
| Quadrant-wise count rates Data is divided into 100 sec bins |
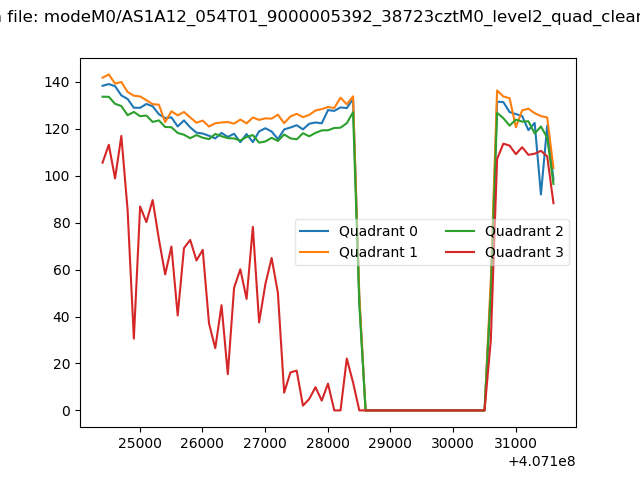 |
|
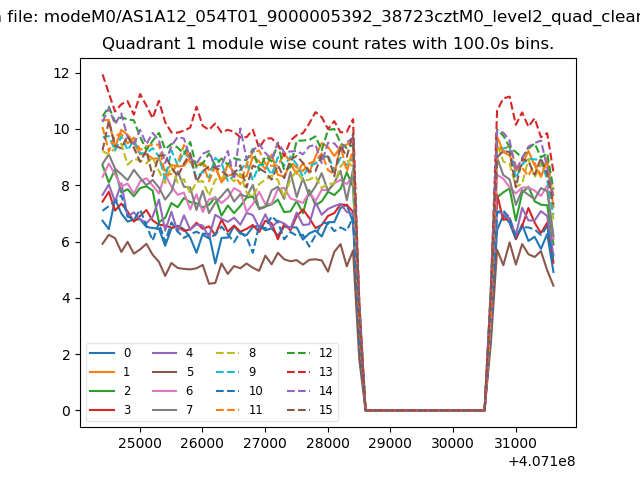
| Module-wise count rates for Quadrant A Data is divided into 100 sec bins |
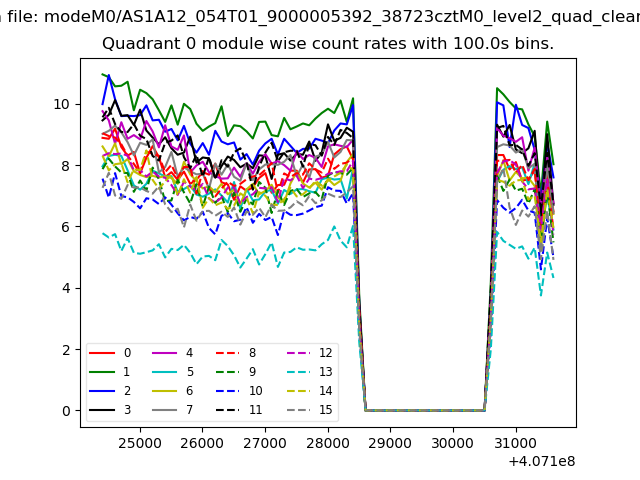 |
 |
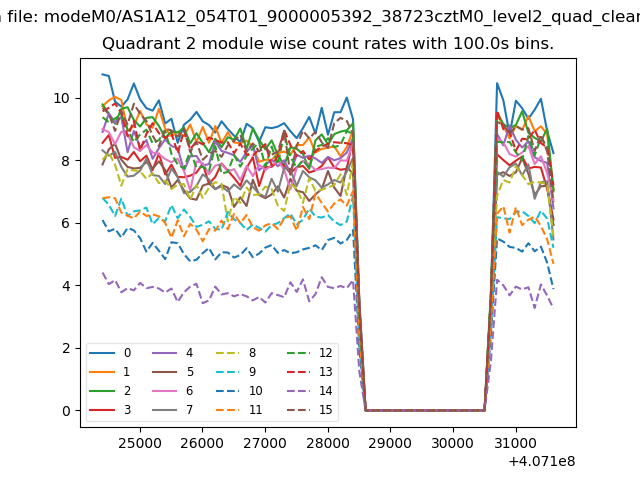
| Module-wise count rates for Quadrant B Data is divided into 100 sec bins |
 |
 |
| Module-wise count rates for Quadrant C Data is divided into 100 sec bins |
 |
 |
| Module-wise count rates for Quadrant D Data is divided into 100 sec bins |
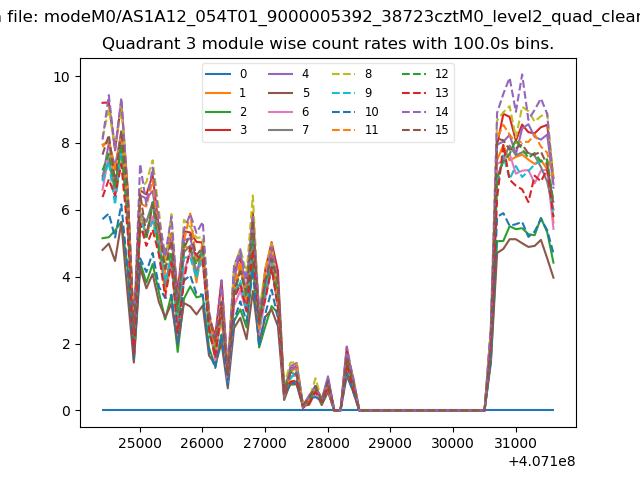 |
 |
| Parameter | Plot |
|---|---|
| CZT HV Monitor | 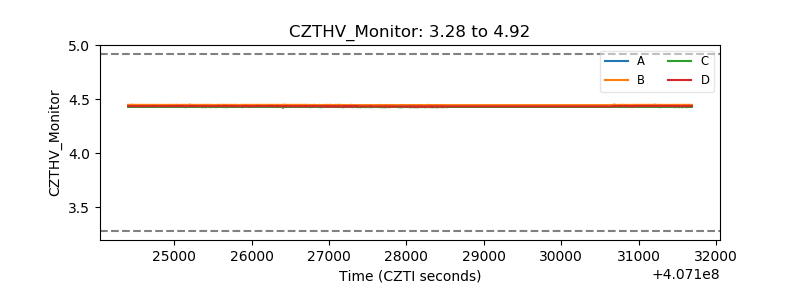 |
| D_VDD | 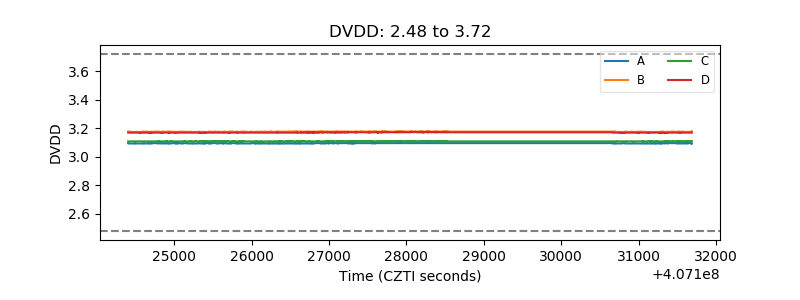 |
| Temperature 1 | 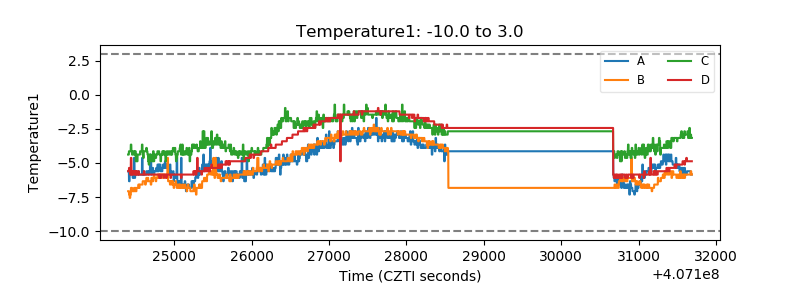 |
| Veto HV Monitor | 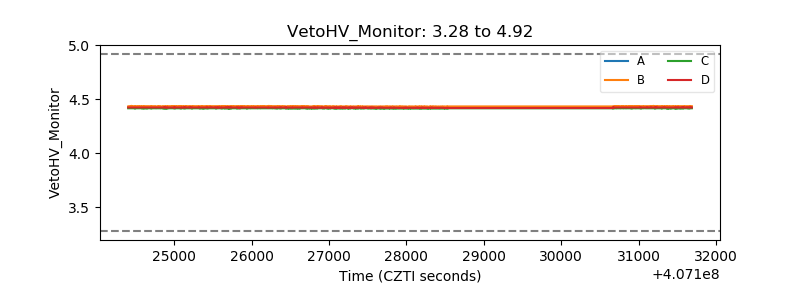 |
| Veto LLD | 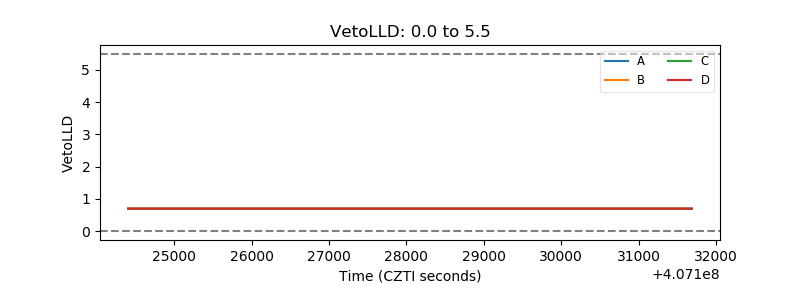 |
| Alpha Counter | 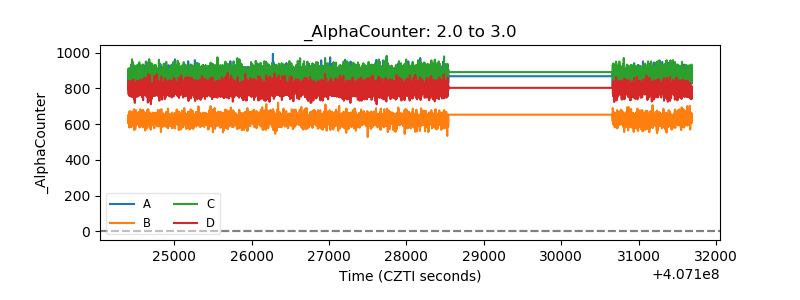 |
| _CPM_Rate | 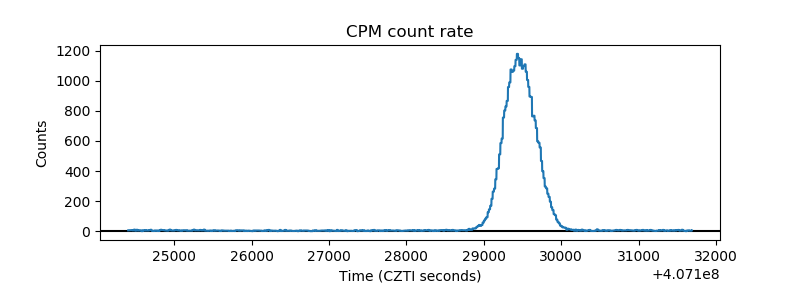 |
| CZT Counter |  |
| +2.5 Volts monitor | 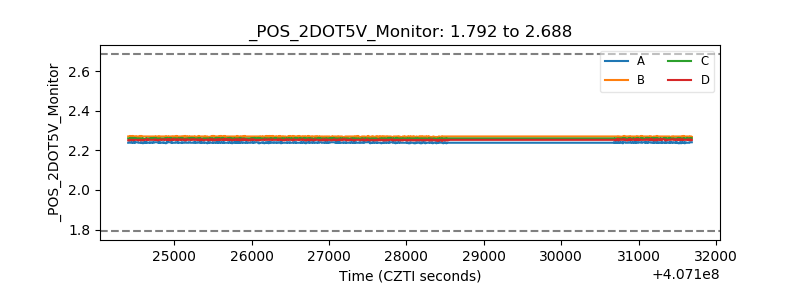 |
| +5 Volts monitor | 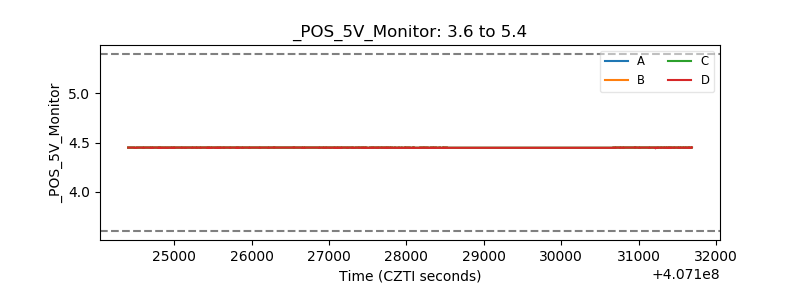 |
| _ROLL_ROT | 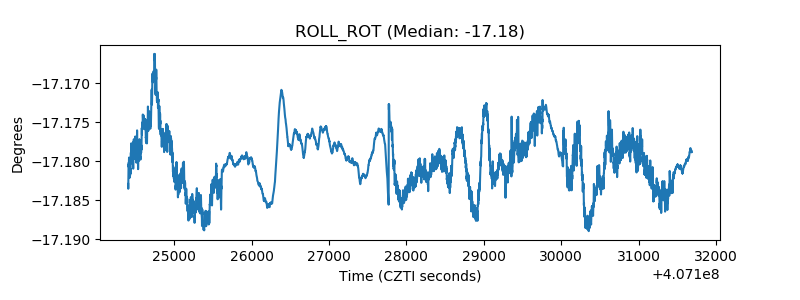 |
| _Roll_DEC | 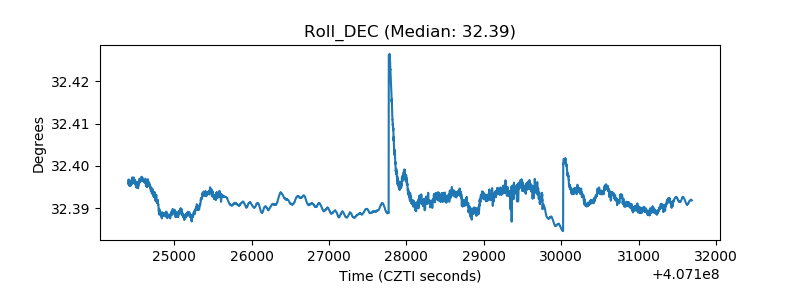 |
| _Roll_RA | 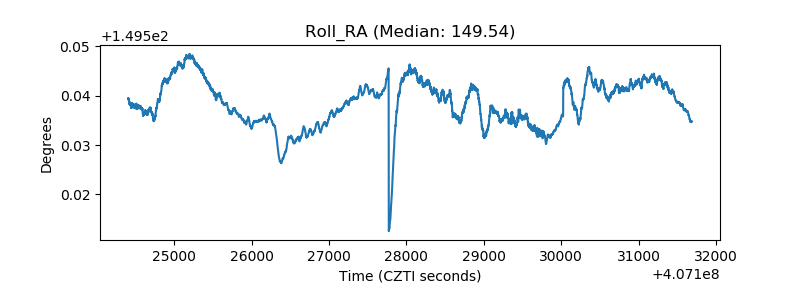 |
| Veto Counter | 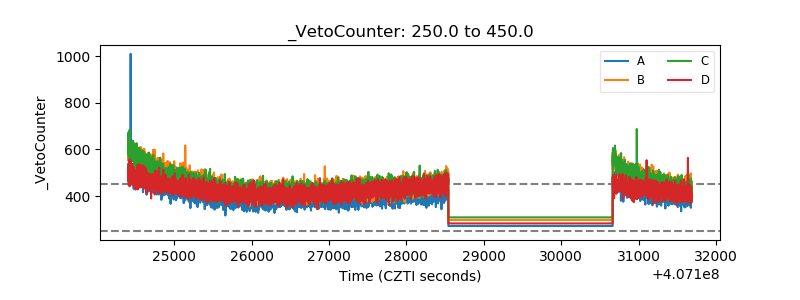 |