| Param | Original file | Final file |
|---|---|---|
| Filename | modeM0/AS1A12_054T01_9000005392_38724cztM0_level2.fits | modeM0/AS1A12_054T01_9000005392_38724cztM0_level2_quad_clean.evt |
| Size (bytes) | 482,950,080 | 86,967,360 |
| Size | 460.6 MB | 82.9 MB |
| Events in quadrant A | 3,153,537 | 617,286 |
| Events in quadrant B | 2,702,094 | 635,542 |
| Events in quadrant C | 2,544,341 | 599,442 |
| Events in quadrant D | 9,075,878 | 418,942 |
| Mode M9 | |||
|---|---|---|---|
| Quadrant | BADHDUFLAG | Total packets | Discarded packets |
| A | 0 | 34 | 0 |
| B | 0 | 34 | 0 |
| C | 0 | 34 | 0 |
| D | 0 | 35 | 0 |
| Mode SS | |||
|---|---|---|---|
| Quadrant | BADHDUFLAG | Total packets | Discarded packets |
| A | 0 | 104 | 0 |
| B | 0 | 104 | 0 |
| C | 0 | 104 | 0 |
| D | 0 | 104 | 0 |
| Mode M0 | |||
|---|---|---|---|
| Quadrant | BADHDUFLAG | Total packets | Discarded packets |
| A | 0 | 12526 | 3 |
| B | 0 | 11375 | 2 |
| C | 0 | 10676 | 2 |
| D | 0 | 30577 | 2 |
| Quadrant | Total seconds | Saturated seconds | Saturation percentage |
|---|---|---|---|
| A | 5171 | 79 | 1.527751% |
| B | 5171 | 61 | 1.179656% |
| C | 5171 | 7 | 0.135370% |
| D | 5171 | 1556 | 30.090892% |
Noise dominated data is calculated using 1-second bins in cleaned event files. If a bin has >2000 counts, and if more than 50% of those come from <1% of pixels, then it is considered to be noise-dominated and hence unusable.
| Quadrant | # 1 sec bins | Bins with >0 counts | Bins with >2000 counts | High rate bins dominated by noise | Noise dominated (total time) | Noise dominated (detector-on time) | Marked lightcurve |
|---|---|---|---|---|---|---|---|
| A | 7293 | 5172 | 66 | 66 | 0.90% | 1.28% | 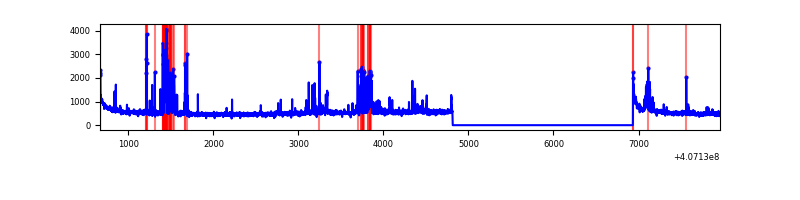 |
| B | 7293 | 5172 | 34 | 34 | 0.47% | 0.66% | 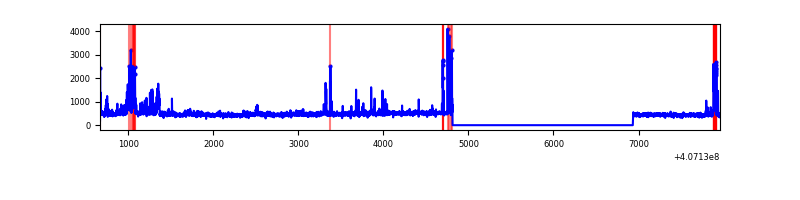 |
| C | 7293 | 5172 | 6 | 6 | 0.08% | 0.12% | 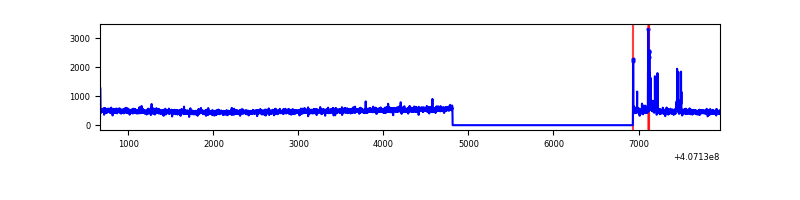 |
| D | 7293 | 5172 | 1465 | 1465 | 20.09% | 28.33% | 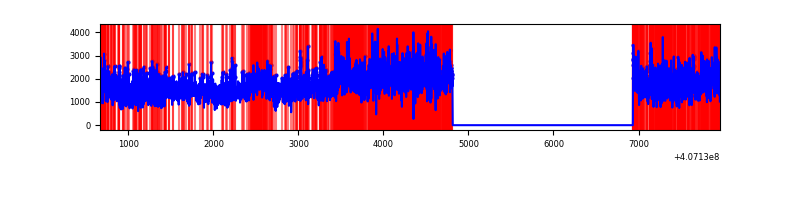 |
Top three noisy pixels from each quadrant. If the there are fewer than three noisy pixels in the level2.evt file, extra rows are filled as -1
| Pixel properties | Quadrant properties | ||||||
|---|---|---|---|---|---|---|---|
| Quadrant | DetID | PixID | Counts | Sigma | Mean | Median | Sigma |
| A | 10 | 83 | 394408 | 3282.39 | 592 | 580 | 120.0 |
| A | 9 | 143 | 252168 | 2096.88 | 592 | 580 | 120.0 |
| A | 0 | 8 | 111164 | 921.67 | 592 | 580 | 120.0 |
| B | 5 | 184 | 216332 | 1921.55 | 587 | 572 | 112.3 |
| B | 4 | 171 | 138308 | 1226.67 | 587 | 572 | 112.3 |
| B | 0 | 183 | 15192 | 130.21 | 587 | 572 | 112.3 |
| C | 15 | 214 | 215951 | 1608.86 | 575 | 579 | 133.9 |
| C | 15 | 208 | 54018 | 399.2 | 575 | 579 | 133.9 |
| C | 14 | 254 | 20181 | 146.43 | 575 | 579 | 133.9 |
| D | 2 | 16 | 5869090 | 46118.92 | 520 | 507 | 127.2 |
| D | 12 | 235 | 550418 | 4321.54 | 520 | 507 | 127.2 |
| D | 12 | 227 | 345280 | 2709.44 | 520 | 507 | 127.2 |
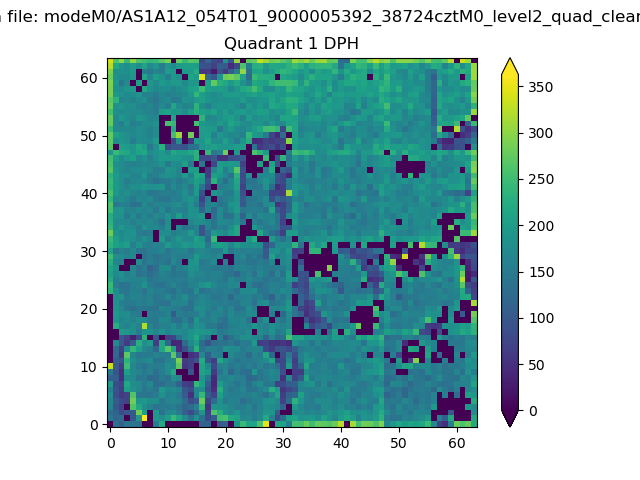
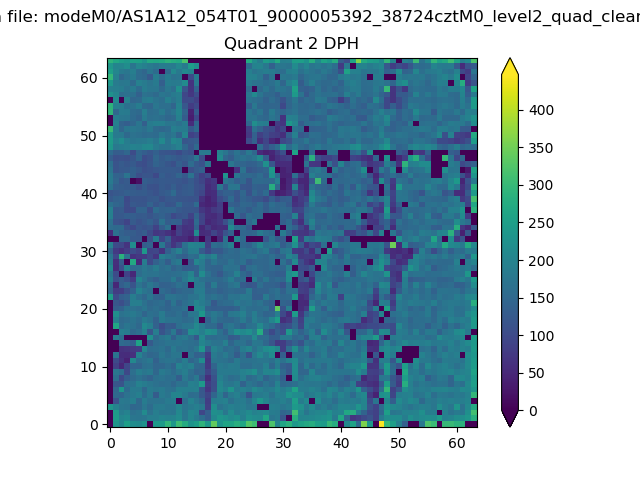
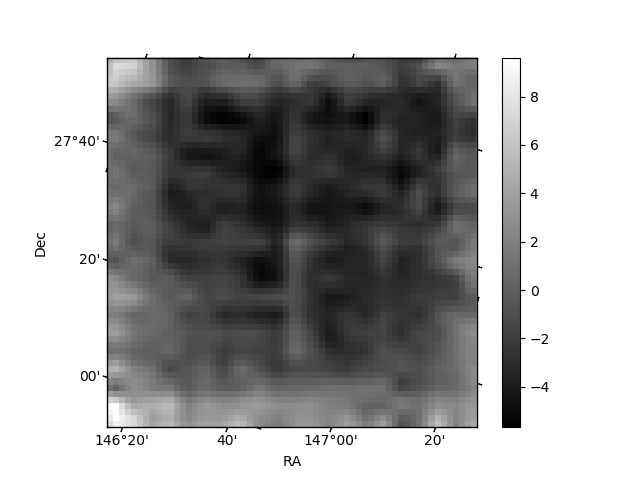
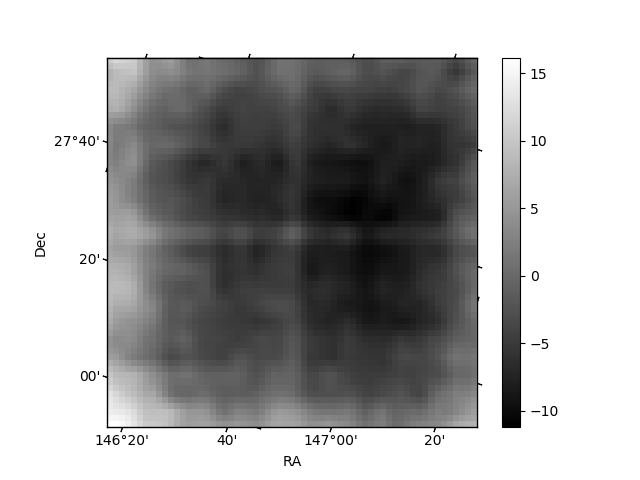
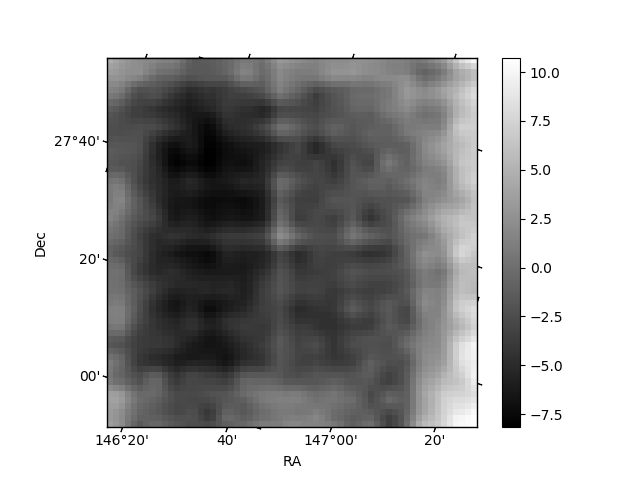
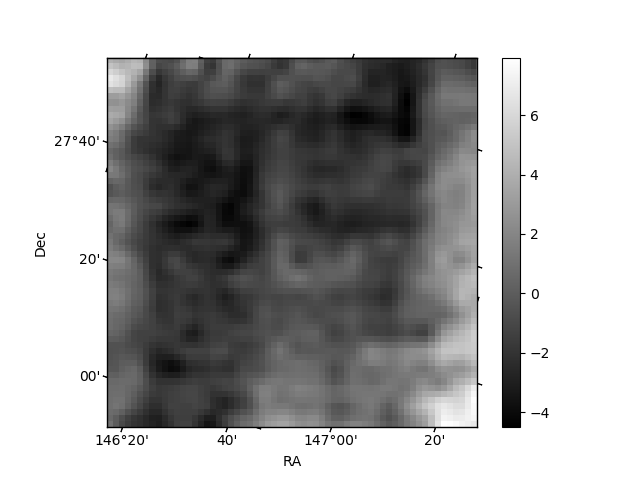
Histogram calculated using DETX and DETY for each event in the final _common_clean file
| Quadrant A |  |
 |
Quadrant B |
|---|---|---|---|
| Quadrant D |  |
 |
Quadrant C |
| Plot type | Count rate plots | Images |
|---|---|---|
| Comparison with Poisson distribution Blue bars denote a histogram of data divided into 1 sec bins. Red curve is a Poisson curve with rate = median count rate of data. |
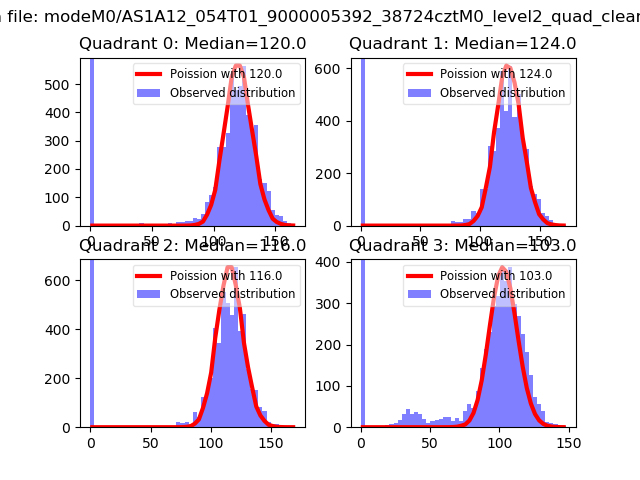 |
 |
| Quadrant-wise count rates Data is divided into 100 sec bins |
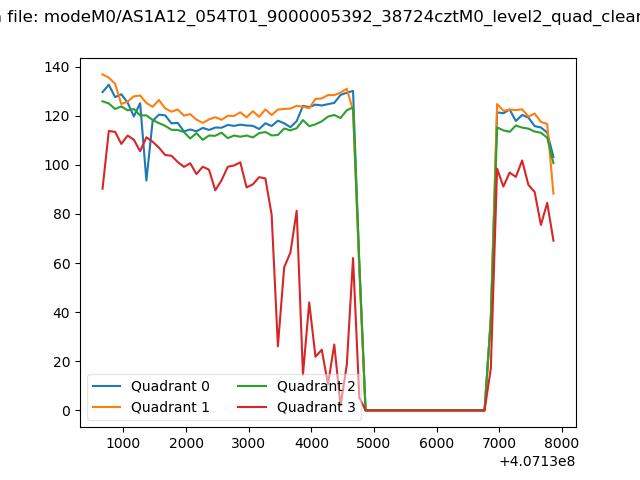 |
|
| Module-wise count rates for Quadrant A Data is divided into 100 sec bins |
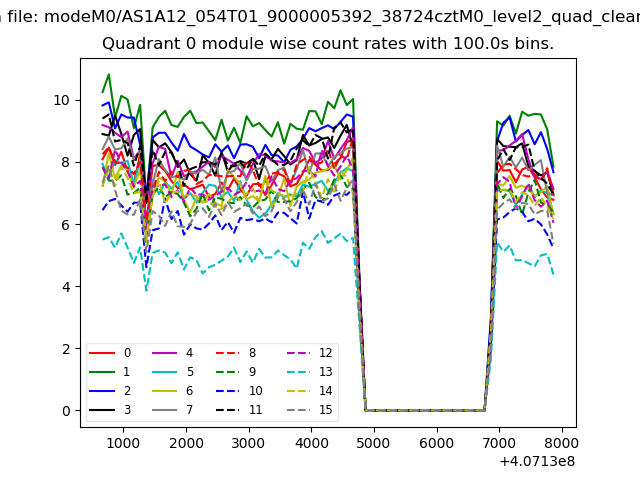 |
 |
| Module-wise count rates for Quadrant B Data is divided into 100 sec bins |
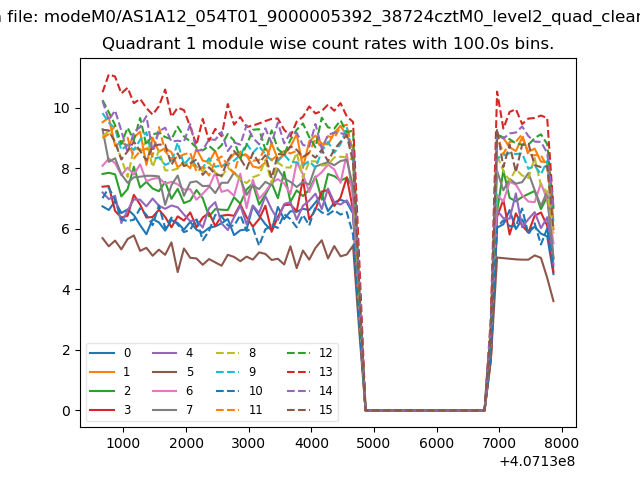 |
 |
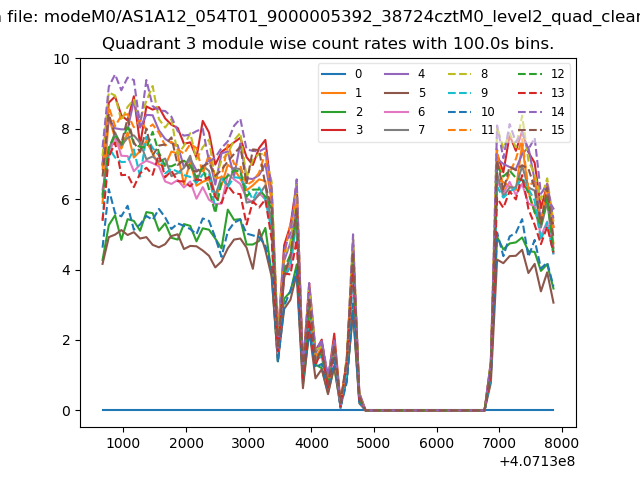
| Module-wise count rates for Quadrant C Data is divided into 100 sec bins |
 |
 |
| Module-wise count rates for Quadrant D Data is divided into 100 sec bins |
 |
 |
| Parameter | Plot |
|---|---|
| CZT HV Monitor | 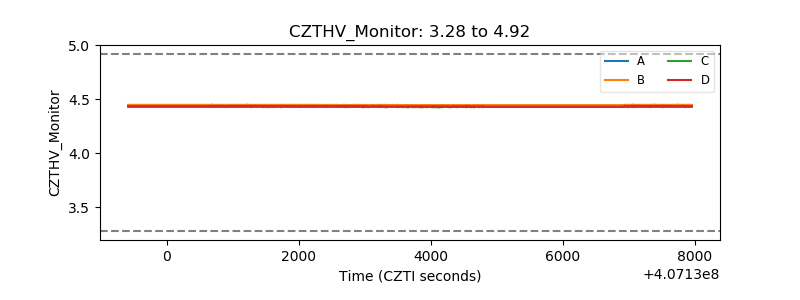 |
| D_VDD | 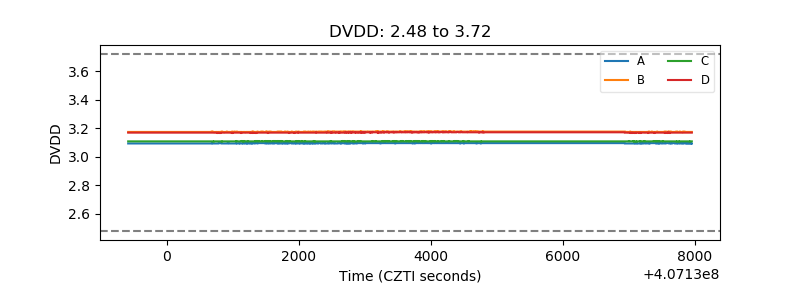 |
| Temperature 1 | 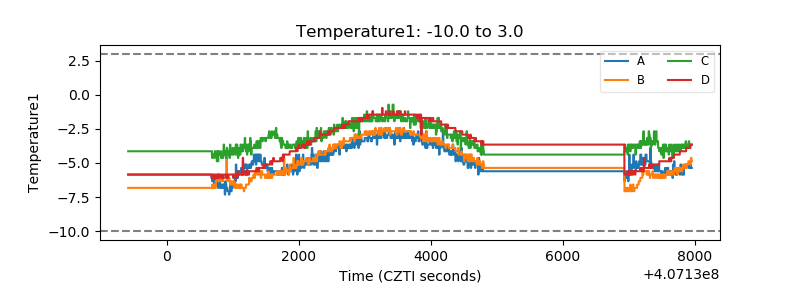 |
| Veto HV Monitor | 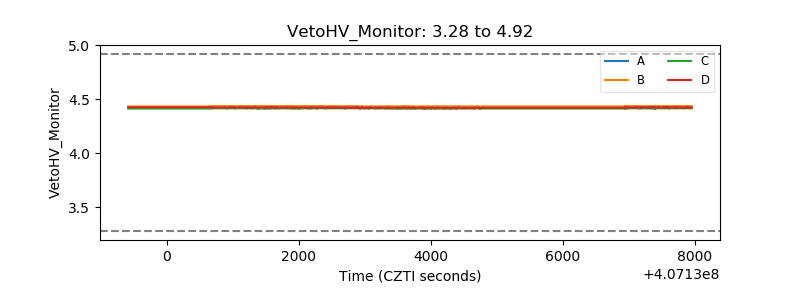 |
| Veto LLD | 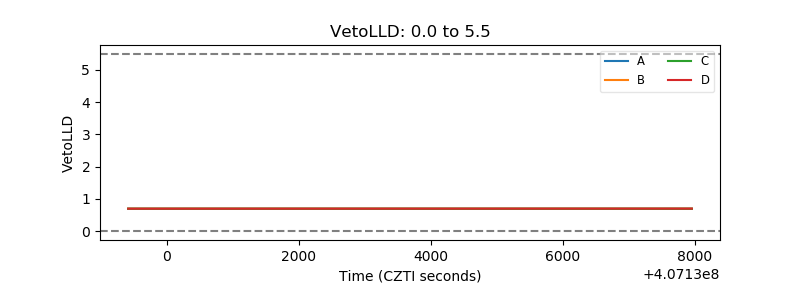 |
| Alpha Counter | 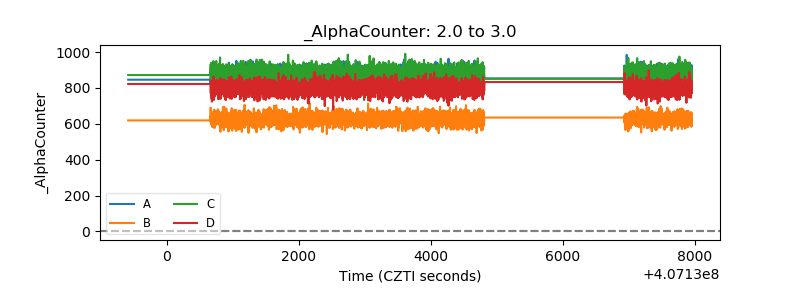 |
| _CPM_Rate | 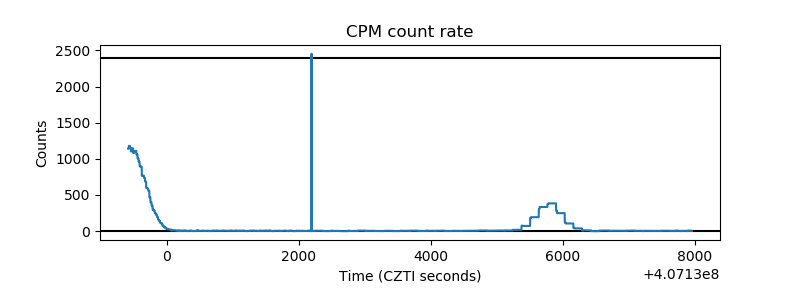 |
| CZT Counter | 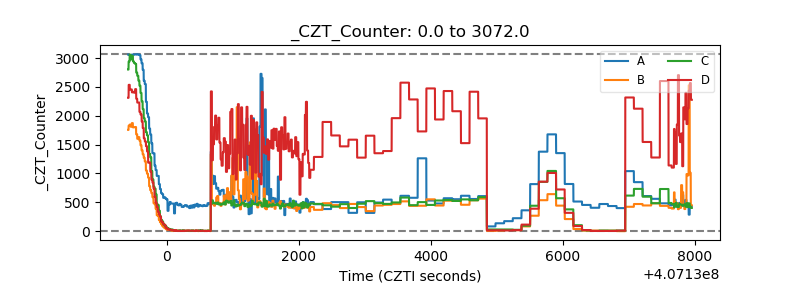 |
| +2.5 Volts monitor | 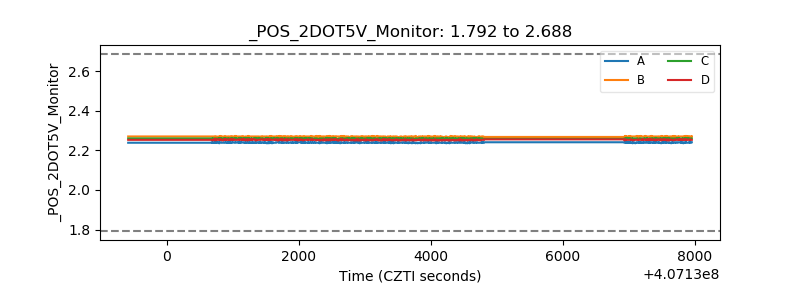 |
| +5 Volts monitor | 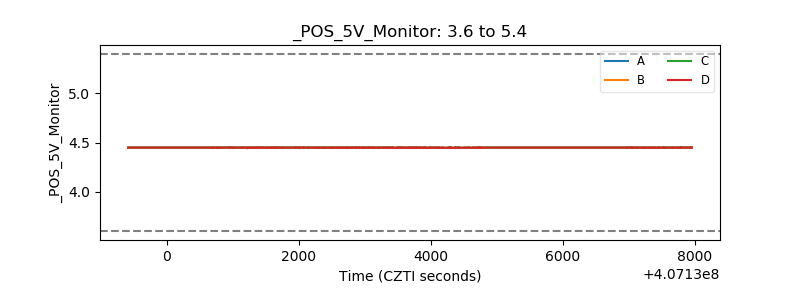 |
| _ROLL_ROT | 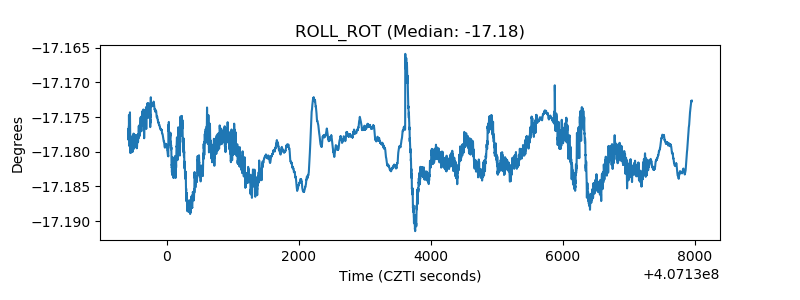 |
| _Roll_DEC | 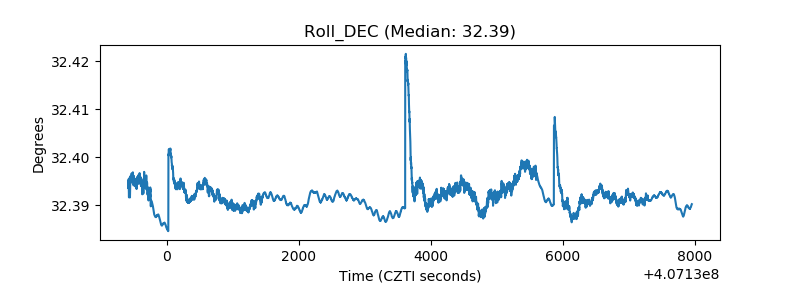 |
| _Roll_RA | 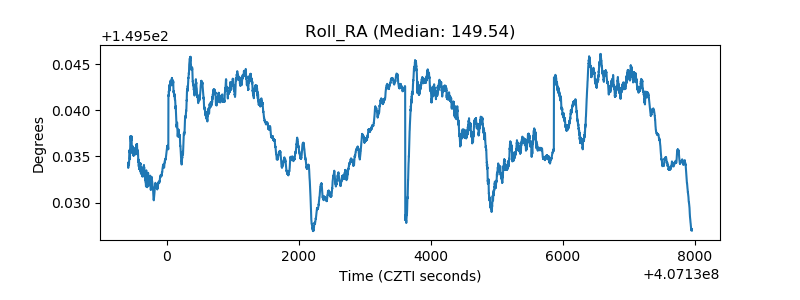 |
| Veto Counter | 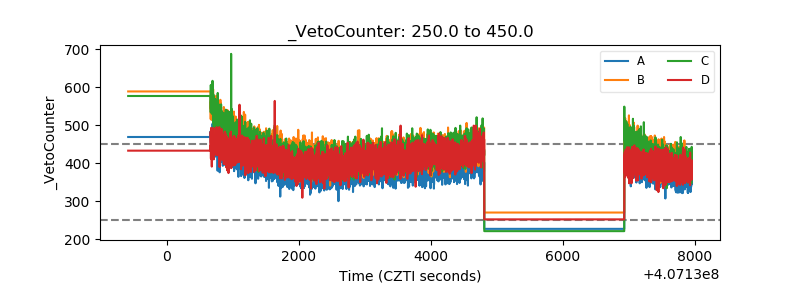 |