| Param | Original file | Final file |
|---|---|---|
| Filename | modeM0/AS1A12_054T01_9000005392_38725cztM0_level2.fits | modeM0/AS1A12_054T01_9000005392_38725cztM0_level2_quad_clean.evt |
| Size (bytes) | 501,926,400 | 79,683,840 |
| Size | 478.7 MB | 76.0 MB |
| Events in quadrant A | 2,979,946 | 587,441 |
| Events in quadrant B | 2,592,696 | 602,155 |
| Events in quadrant C | 2,501,637 | 569,594 |
| Events in quadrant D | 10,108,958 | 296,026 |
| Mode M9 | |||
|---|---|---|---|
| Quadrant | BADHDUFLAG | Total packets | Discarded packets |
| A | 0 | 23 | 0 |
| B | 0 | 23 | 0 |
| C | 0 | 23 | 0 |
| D | 0 | 24 | 0 |
| Mode SS | |||
|---|---|---|---|
| Quadrant | BADHDUFLAG | Total packets | Discarded packets |
| A | 0 | 104 | 0 |
| B | 0 | 104 | 0 |
| C | 0 | 104 | 0 |
| D | 0 | 104 | 0 |
| Mode M0 | |||
|---|---|---|---|
| Quadrant | BADHDUFLAG | Total packets | Discarded packets |
| A | 0 | 11892 | 3 |
| B | 0 | 11110 | 2 |
| C | 0 | 10528 | 2 |
| D | 0 | 33550 | 2 |
| Quadrant | Total seconds | Saturated seconds | Saturation percentage |
|---|---|---|---|
| A | 5098 | 53 | 1.039623% |
| B | 5098 | 53 | 1.039623% |
| C | 5098 | 11 | 0.215771% |
| D | 5098 | 2735 | 53.648490% |
Noise dominated data is calculated using 1-second bins in cleaned event files. If a bin has >2000 counts, and if more than 50% of those come from <1% of pixels, then it is considered to be noise-dominated and hence unusable.
| Quadrant | # 1 sec bins | Bins with >0 counts | Bins with >2000 counts | High rate bins dominated by noise | Noise dominated (total time) | Noise dominated (detector-on time) | Marked lightcurve |
|---|---|---|---|---|---|---|---|
| A | 7101 | 5099 | 25 | 25 | 0.35% | 0.49% | 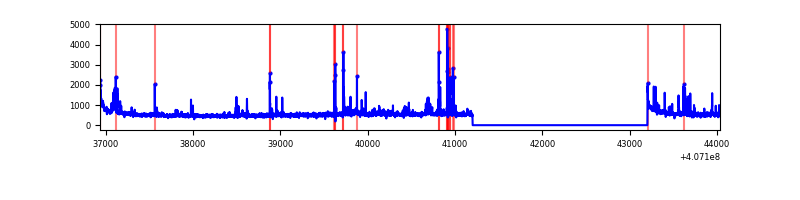 |
| B | 7101 | 5099 | 33 | 33 | 0.46% | 0.65% | 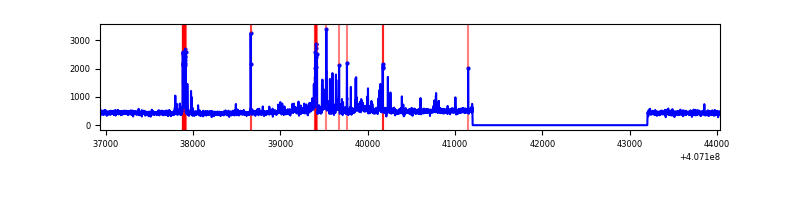 |
| C | 7101 | 5099 | 10 | 10 | 0.14% | 0.20% | 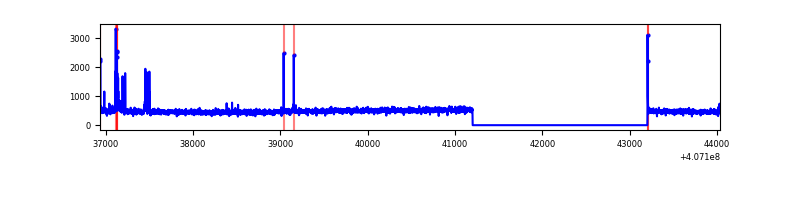 |
| D | 7101 | 5099 | 2520 | 2520 | 35.49% | 49.42% | 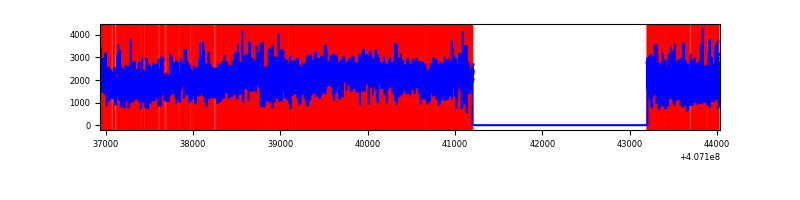 |
Top three noisy pixels from each quadrant. If the there are fewer than three noisy pixels in the level2.evt file, extra rows are filled as -1
| Pixel properties | Quadrant properties | ||||||
|---|---|---|---|---|---|---|---|
| Quadrant | DetID | PixID | Counts | Sigma | Mean | Median | Sigma |
| A | 10 | 83 | 392300 | 3347.99 | 580 | 569 | 117.0 |
| A | 9 | 143 | 215534 | 1837.23 | 580 | 569 | 117.0 |
| A | 13 | 248 | 63699 | 539.55 | 580 | 569 | 117.0 |
| B | 4 | 171 | 301882 | 2706.23 | 574 | 558 | 111.3 |
| B | 12 | 111 | 13915 | 119.96 | 574 | 558 | 111.3 |
| B | 0 | 230 | 13110 | 112.73 | 574 | 558 | 111.3 |
| C | 15 | 214 | 212304 | 1607.67 | 562 | 565 | 131.7 |
| C | 15 | 208 | 62010 | 466.53 | 562 | 565 | 131.7 |
| C | 14 | 254 | 20117 | 148.45 | 562 | 565 | 131.7 |
| D | 2 | 16 | 5606375 | 47693.93 | 479 | 466 | 117.5 |
| D | 12 | 235 | 1293637 | 11002.03 | 479 | 466 | 117.5 |
| D | 12 | 227 | 857072 | 7287.83 | 479 | 466 | 117.5 |
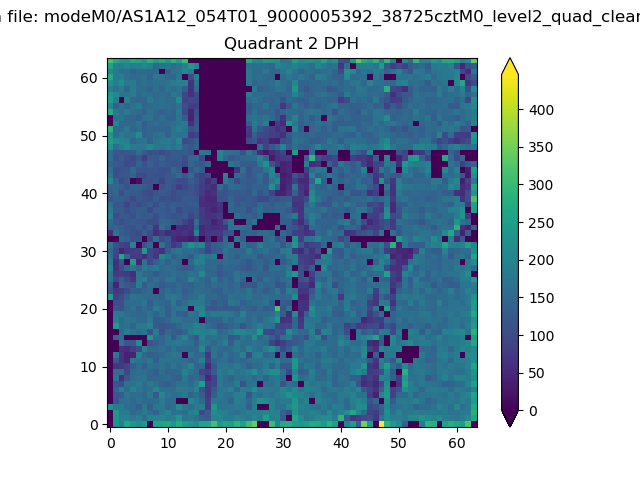
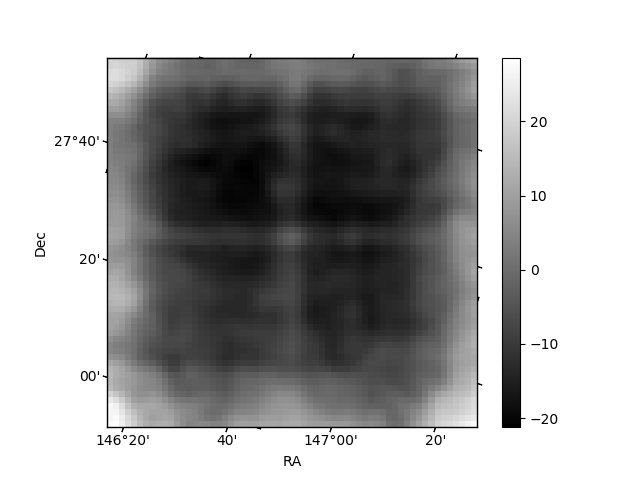
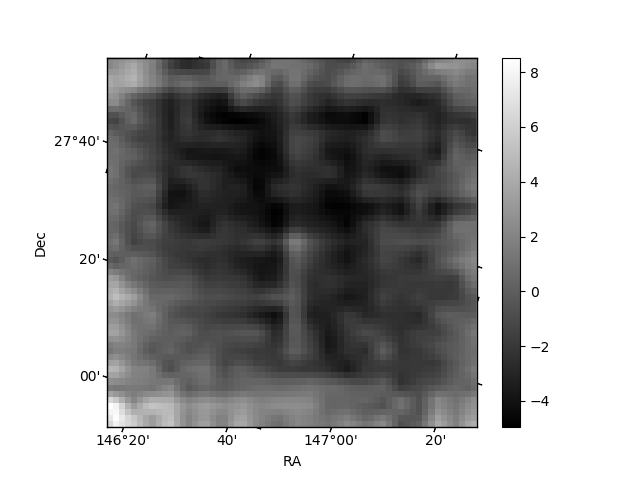
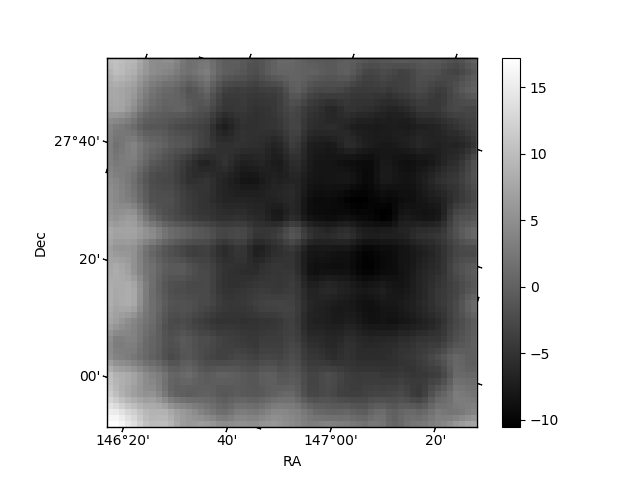
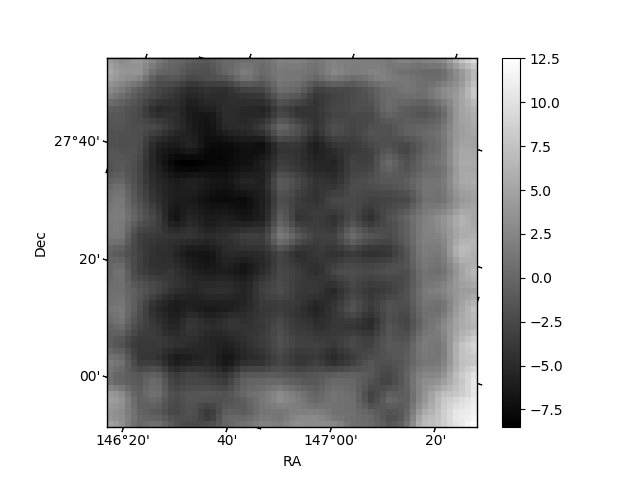
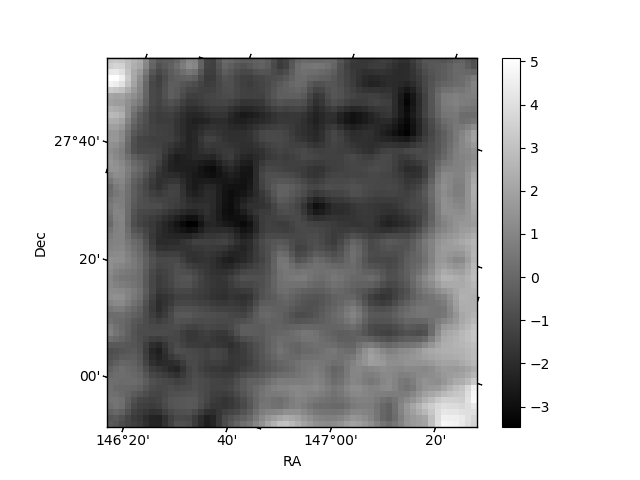
Histogram calculated using DETX and DETY for each event in the final _common_clean file
| Quadrant A | 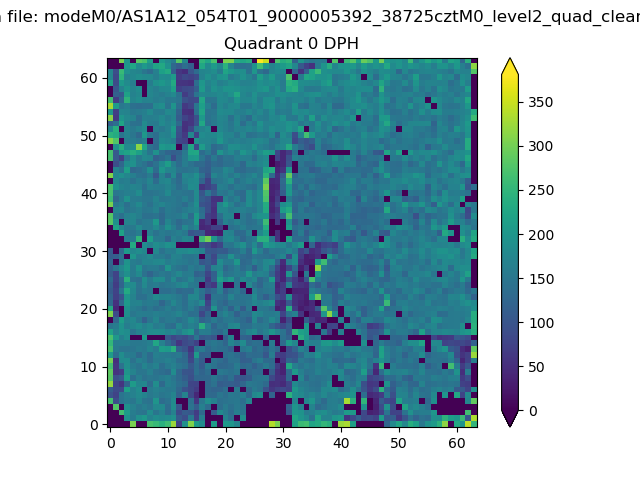 |
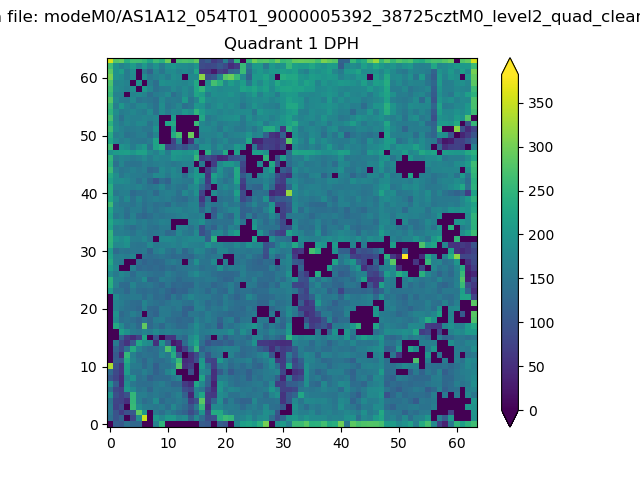 |
Quadrant B |
|---|---|---|---|
| Quadrant D | 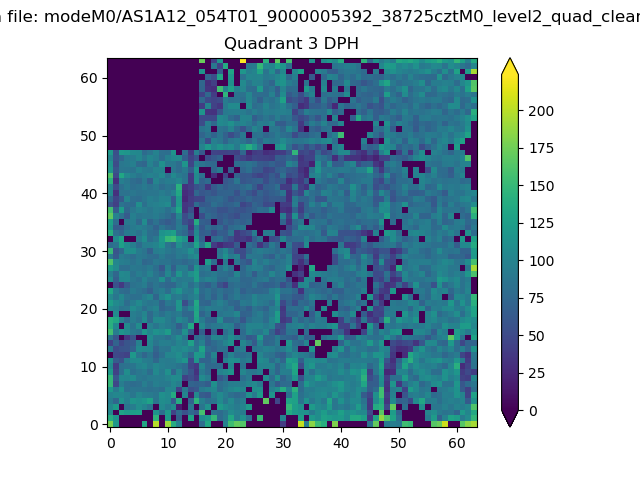 |
 |
Quadrant C |
| Plot type | Count rate plots | Images |
|---|---|---|
| Comparison with Poisson distribution Blue bars denote a histogram of data divided into 1 sec bins. Red curve is a Poisson curve with rate = median count rate of data. |
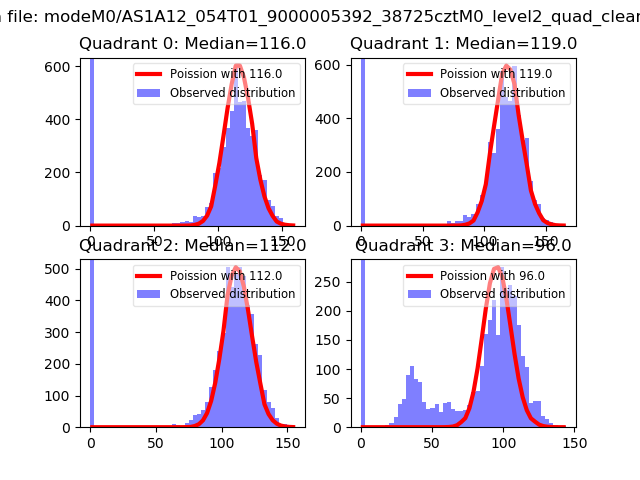 |
 |
| Quadrant-wise count rates Data is divided into 100 sec bins |
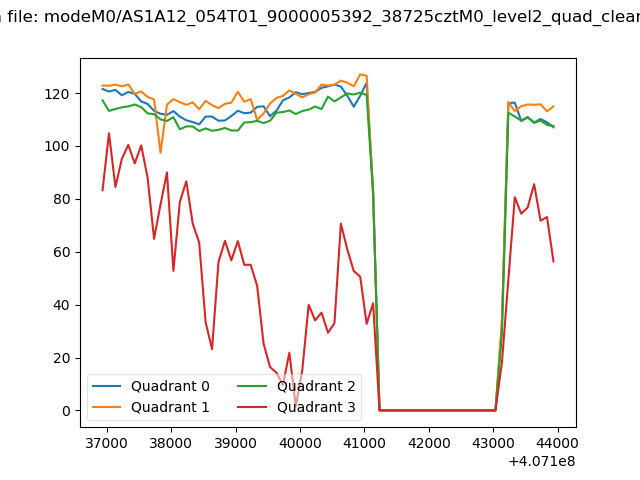 |
|
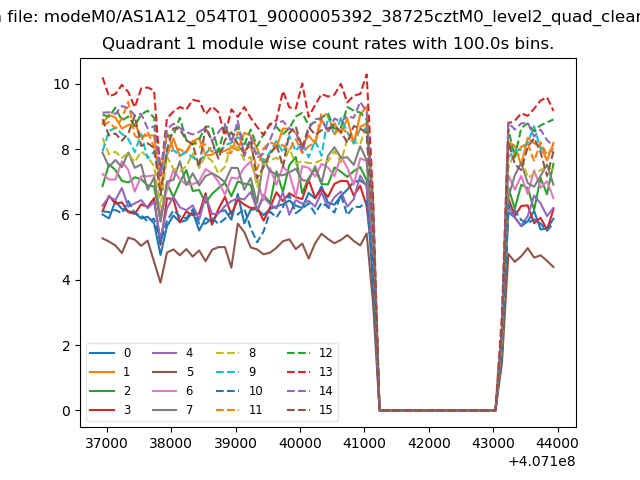
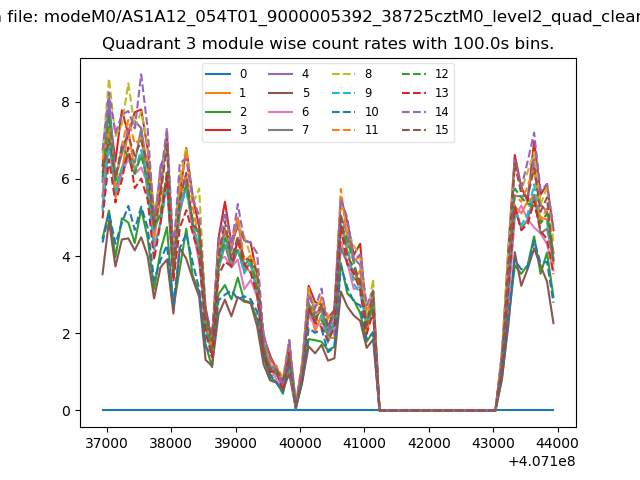
| Module-wise count rates for Quadrant A Data is divided into 100 sec bins |
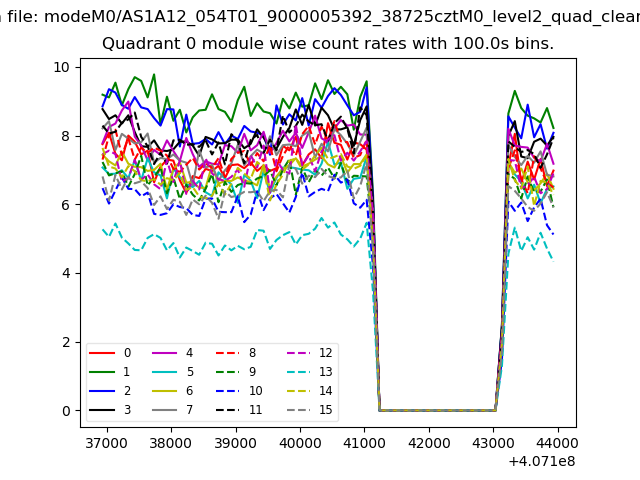 |
 |
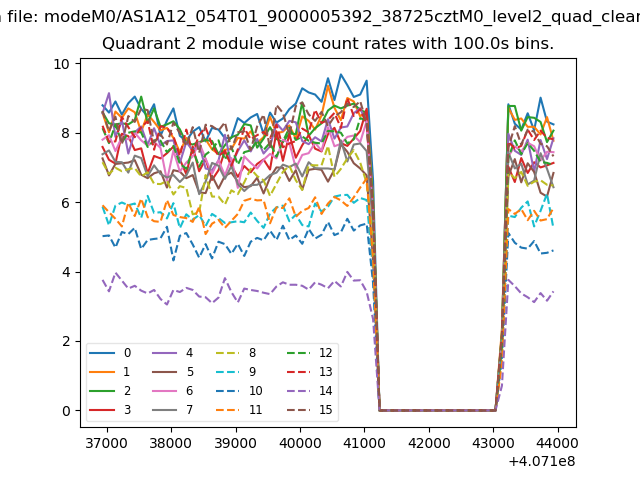
| Module-wise count rates for Quadrant B Data is divided into 100 sec bins |
 |
 |
| Module-wise count rates for Quadrant C Data is divided into 100 sec bins |
 |
 |
| Module-wise count rates for Quadrant D Data is divided into 100 sec bins |
 |
 |
| Parameter | Plot |
|---|---|
| CZT HV Monitor | 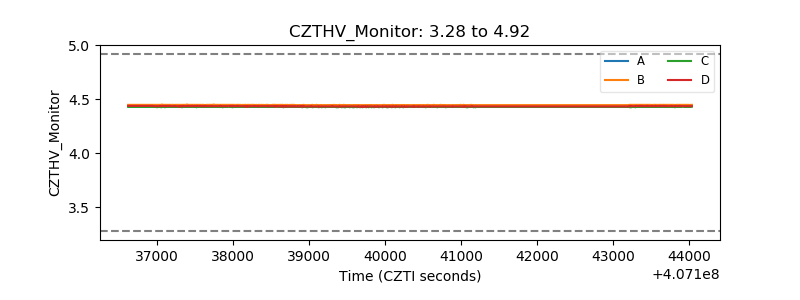 |
| D_VDD | 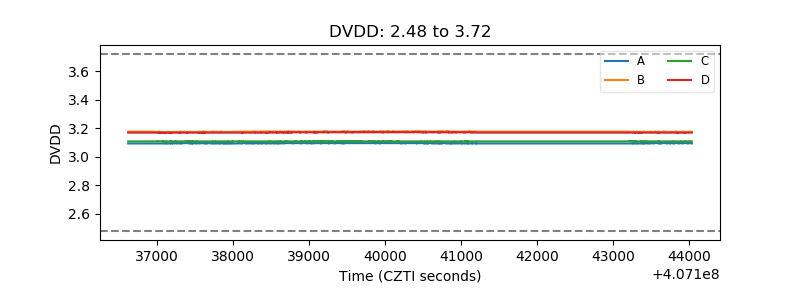 |
| Temperature 1 | 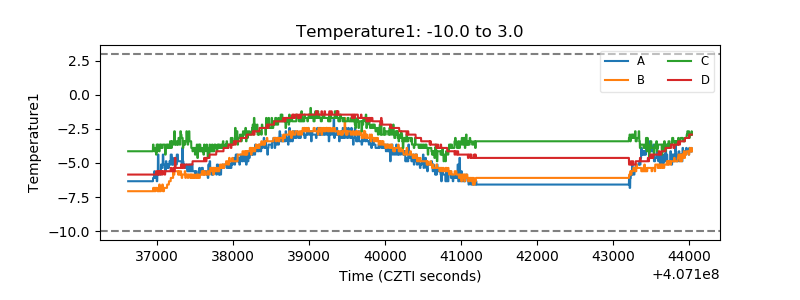 |
| Veto HV Monitor | 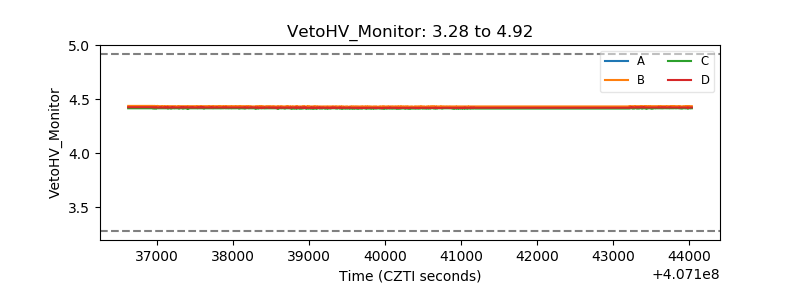 |
| Veto LLD | 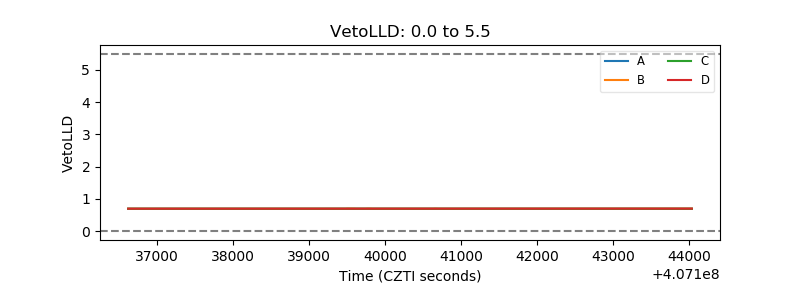 |
| Alpha Counter | 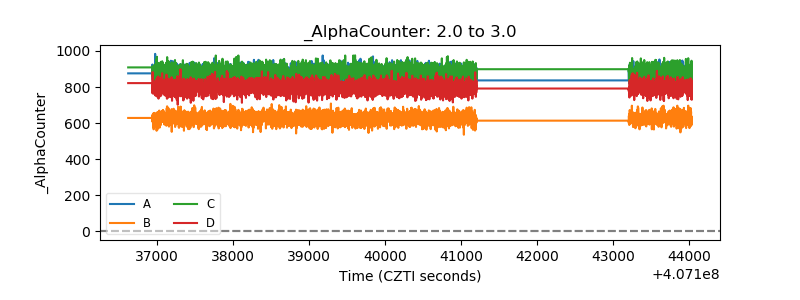 |
| _CPM_Rate |  |
| CZT Counter | 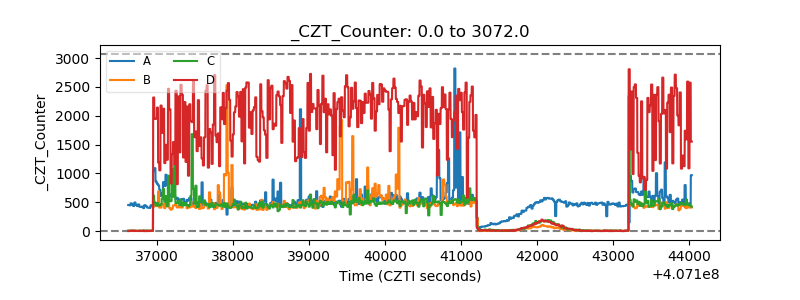 |
| +2.5 Volts monitor | 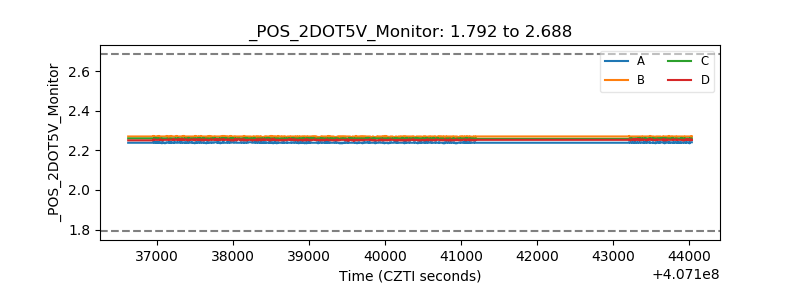 |
| +5 Volts monitor | 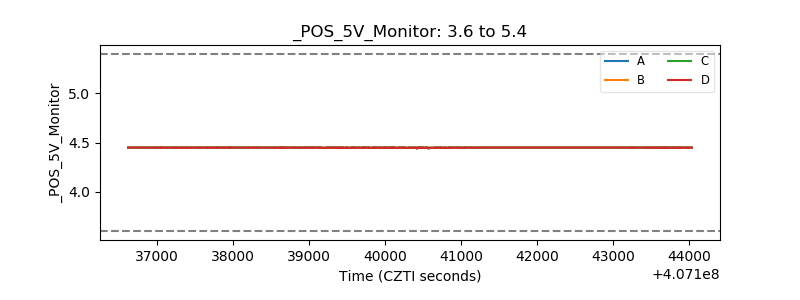 |
| _ROLL_ROT | 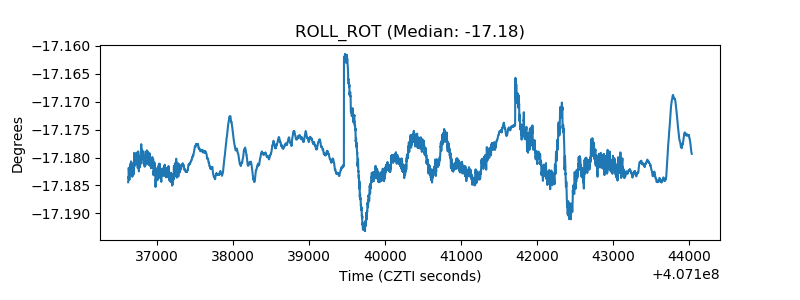 |
| _Roll_DEC | 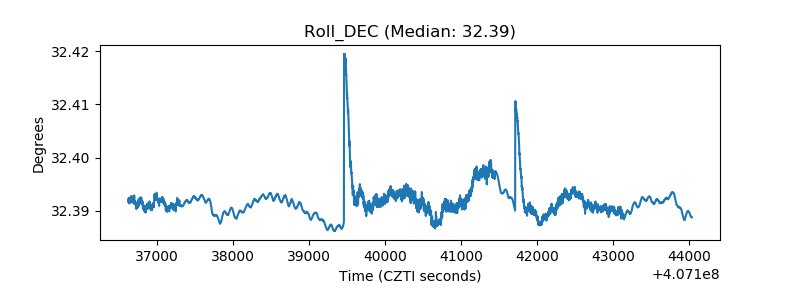 |
| _Roll_RA | 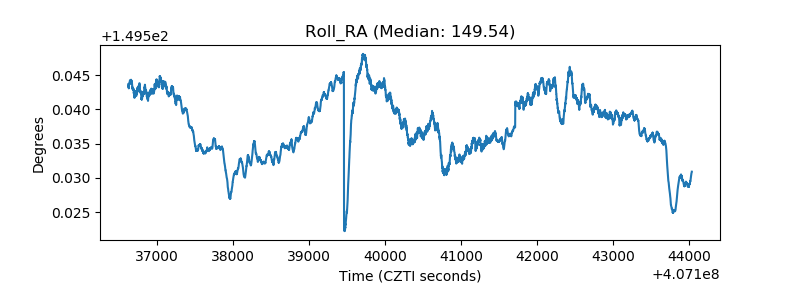 |
| Veto Counter | 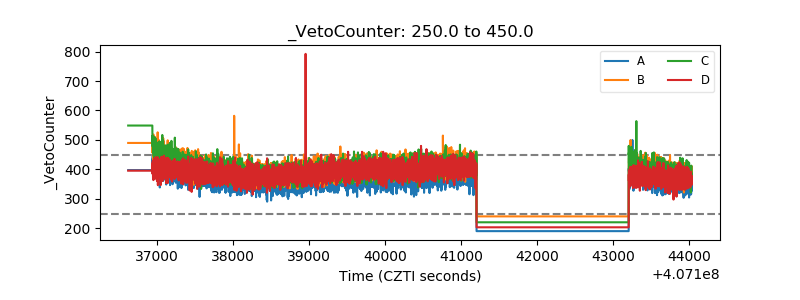 |