| Param | Original file | Final file |
|---|---|---|
| Filename | modeM0/AS1A12_054T01_9000005392_38726cztM0_level2.fits | modeM0/AS1A12_054T01_9000005392_38726cztM0_level2_quad_clean.evt |
| Size (bytes) | 540,599,040 | 82,635,840 |
| Size | 515.6 MB | 78.8 MB |
| Events in quadrant A | 3,690,761 | 596,179 |
| Events in quadrant B | 2,474,728 | 627,124 |
| Events in quadrant C | 2,617,894 | 592,713 |
| Events in quadrant D | 10,806,379 | 306,236 |
| Mode M9 | |||
|---|---|---|---|
| Quadrant | BADHDUFLAG | Total packets | Discarded packets |
| A | 0 | 30 | 0 |
| B | 0 | 30 | 0 |
| C | 0 | 30 | 0 |
| D | 0 | 31 | 0 |
| Mode SS | |||
|---|---|---|---|
| Quadrant | BADHDUFLAG | Total packets | Discarded packets |
| A | 0 | 110 | 0 |
| B | 0 | 110 | 0 |
| C | 0 | 110 | 0 |
| D | 0 | 110 | 0 |
| Mode M0 | |||
|---|---|---|---|
| Quadrant | BADHDUFLAG | Total packets | Discarded packets |
| A | 0 | 14297 | 3 |
| B | 0 | 10974 | 2 |
| C | 0 | 11065 | 2 |
| D | 0 | 35814 | 2 |
| Quadrant | Total seconds | Saturated seconds | Saturation percentage |
|---|---|---|---|
| A | 5423 | 181 | 3.337636% |
| B | 5423 | 8 | 0.147520% |
| C | 5423 | 9 | 0.165960% |
| D | 5423 | 2969 | 54.748294% |
Noise dominated data is calculated using 1-second bins in cleaned event files. If a bin has >2000 counts, and if more than 50% of those come from <1% of pixels, then it is considered to be noise-dominated and hence unusable.
| Quadrant | # 1 sec bins | Bins with >0 counts | Bins with >2000 counts | High rate bins dominated by noise | Noise dominated (total time) | Noise dominated (detector-on time) | Marked lightcurve |
|---|---|---|---|---|---|---|---|
| A | 7094 | 5424 | 137 | 137 | 1.93% | 2.53% | 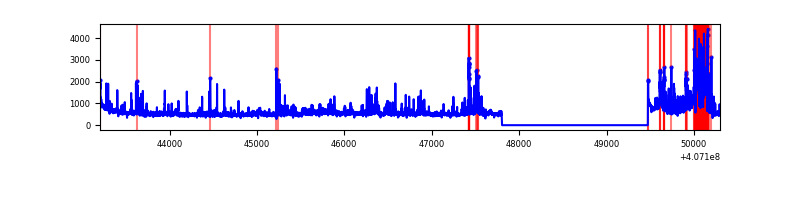 |
| B | 7094 | 5424 | 0 | 0 | 0.00% | 0.00% | 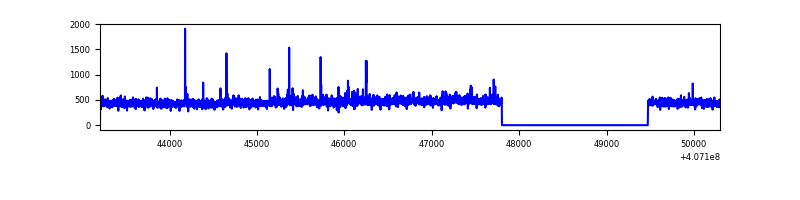 |
| C | 7094 | 5424 | 5 | 5 | 0.07% | 0.09% | 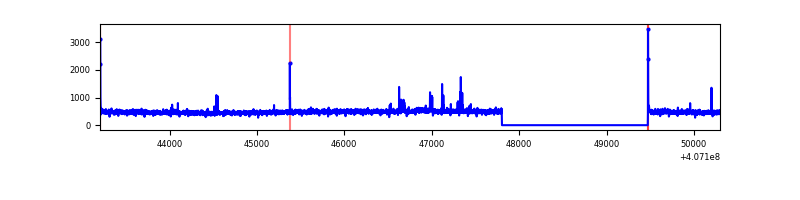 |
| D | 7094 | 5424 | 2545 | 2545 | 35.88% | 46.92% | 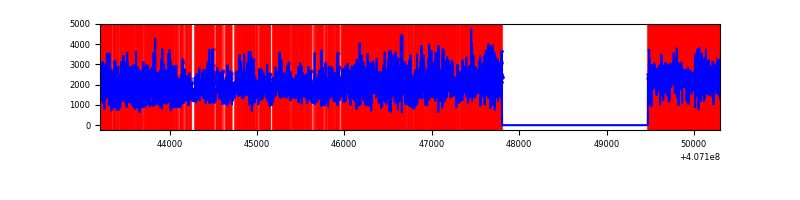 |
Top three noisy pixels from each quadrant. If the there are fewer than three noisy pixels in the level2.evt file, extra rows are filled as -1
| Pixel properties | Quadrant properties | ||||||
|---|---|---|---|---|---|---|---|
| Quadrant | DetID | PixID | Counts | Sigma | Mean | Median | Sigma |
| A | 13 | 248 | 496213 | 4019.49 | 607 | 595 | 123.3 |
| A | 10 | 83 | 410003 | 3320.32 | 607 | 595 | 123.3 |
| A | 9 | 143 | 269135 | 2177.87 | 607 | 595 | 123.3 |
| B | 4 | 171 | 38467 | 318.77 | 608 | 592 | 118.8 |
| B | 0 | 199 | 22671 | 185.82 | 608 | 592 | 118.8 |
| B | 12 | 111 | 14767 | 119.3 | 608 | 592 | 118.8 |
| C | 15 | 214 | 226230 | 1611.42 | 595 | 599 | 140.0 |
| C | 15 | 208 | 44532 | 313.76 | 595 | 599 | 140.0 |
| C | 0 | 10 | 18293 | 126.37 | 595 | 599 | 140.0 |
| D | 2 | 16 | 7006963 | 55693.13 | 506 | 492 | 125.8 |
| D | 12 | 235 | 528658 | 4198.29 | 506 | 492 | 125.8 |
| D | 12 | 6 | 459125 | 3645.59 | 506 | 492 | 125.8 |
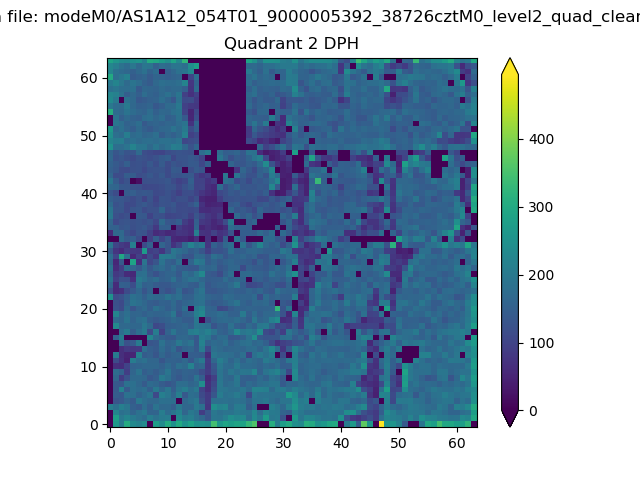
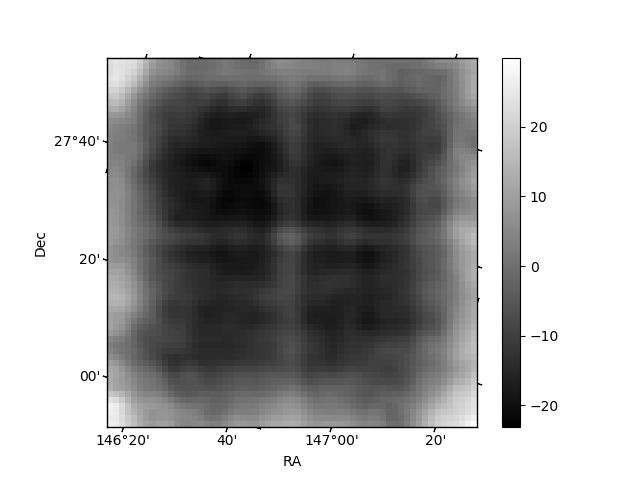
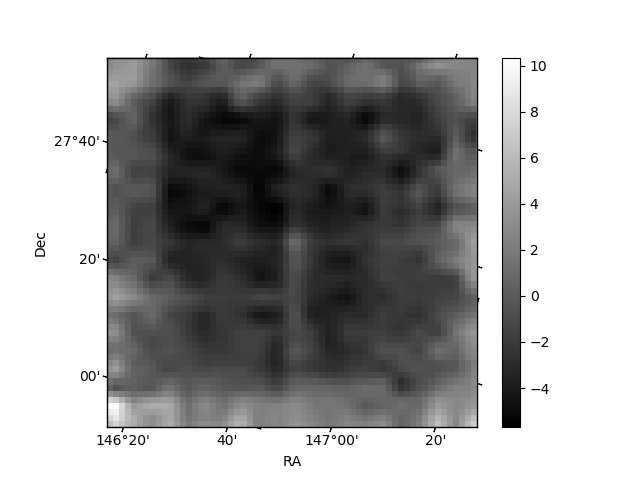
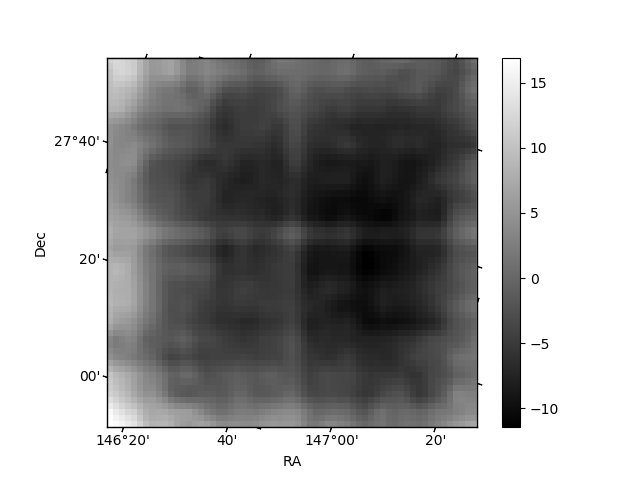
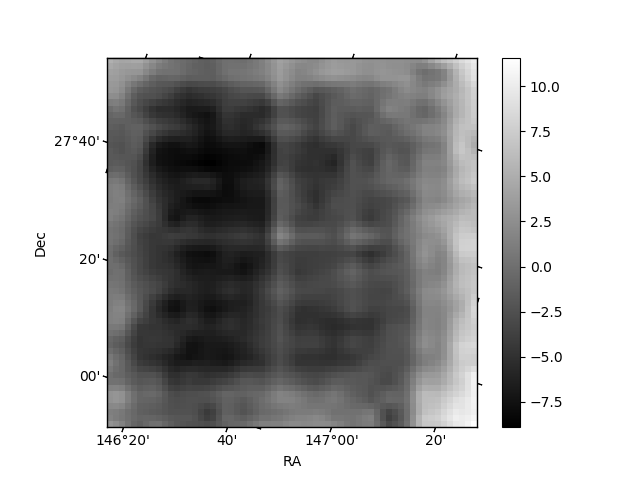
Histogram calculated using DETX and DETY for each event in the final _common_clean file
| Quadrant A | 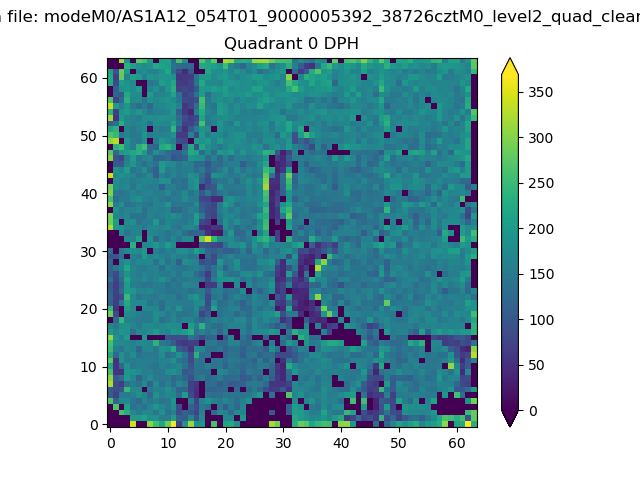 |
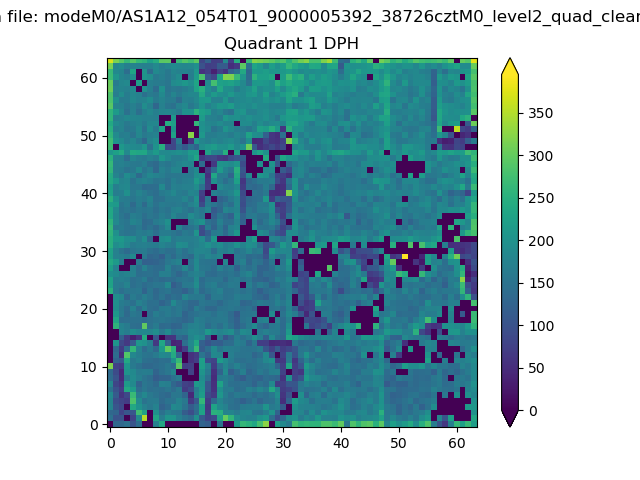 |
Quadrant B |
|---|---|---|---|
| Quadrant D | 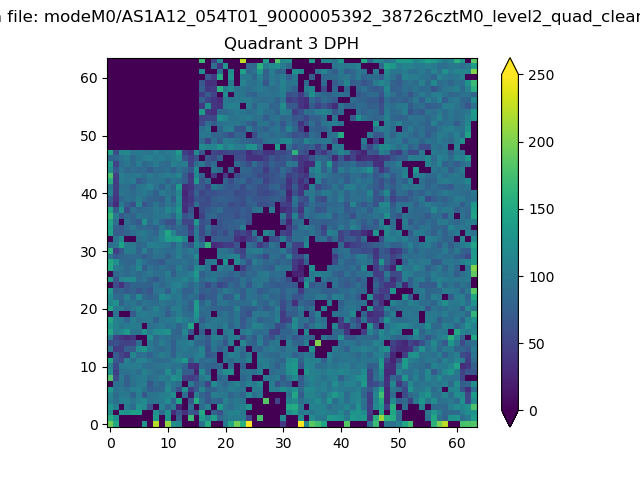 |
 |
Quadrant C |
| Plot type | Count rate plots | Images |
|---|---|---|
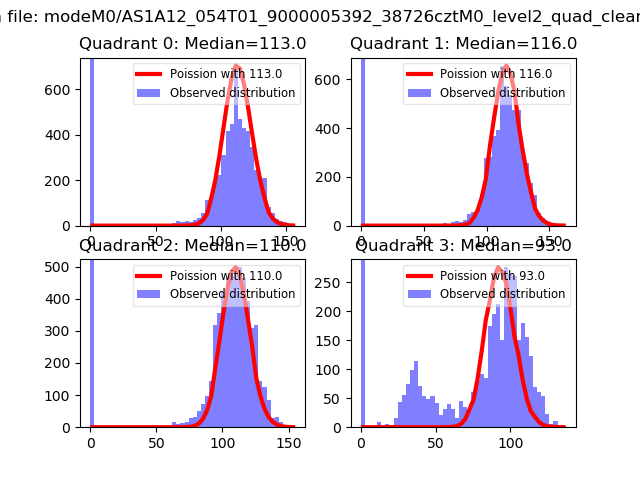
| Comparison with Poisson distribution Blue bars denote a histogram of data divided into 1 sec bins. Red curve is a Poisson curve with rate = median count rate of data. |
 |
 |
| Quadrant-wise count rates Data is divided into 100 sec bins |
 |
|
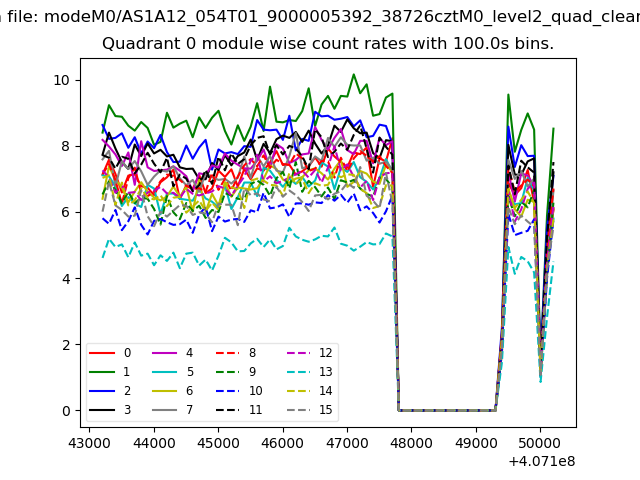
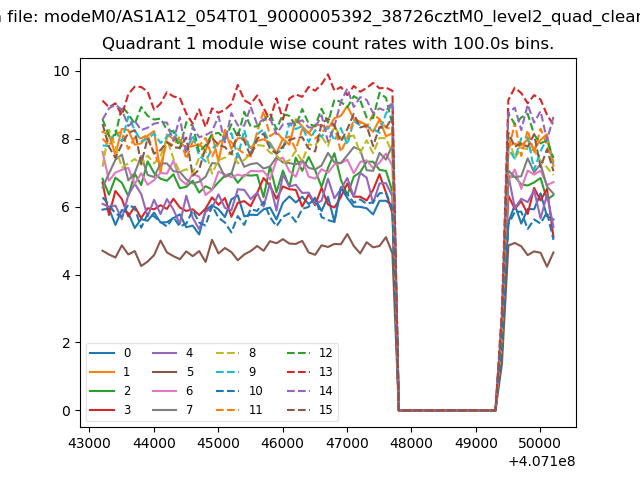
| Module-wise count rates for Quadrant A Data is divided into 100 sec bins |
 |
 |
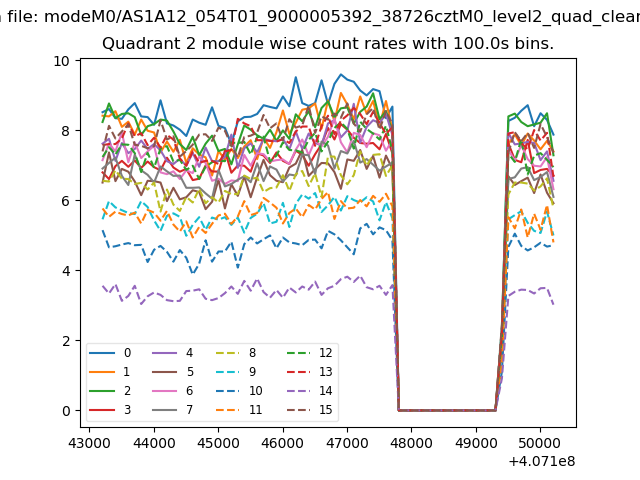
| Module-wise count rates for Quadrant B Data is divided into 100 sec bins |
 |
 |
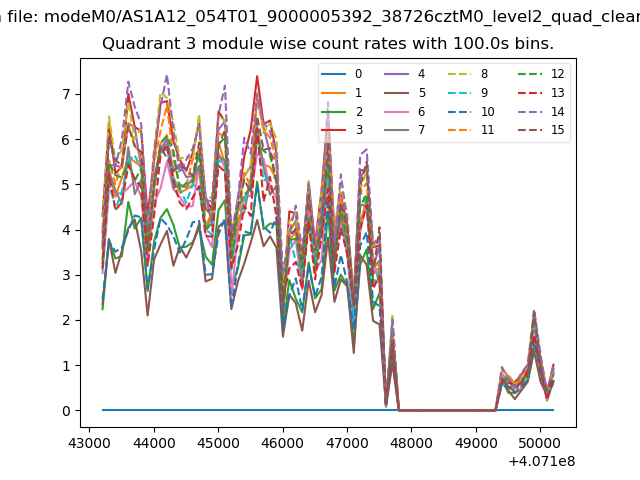
| Module-wise count rates for Quadrant C Data is divided into 100 sec bins |
 |
 |
| Module-wise count rates for Quadrant D Data is divided into 100 sec bins |
 |
 |
| Parameter | Plot |
|---|---|
| CZT HV Monitor | 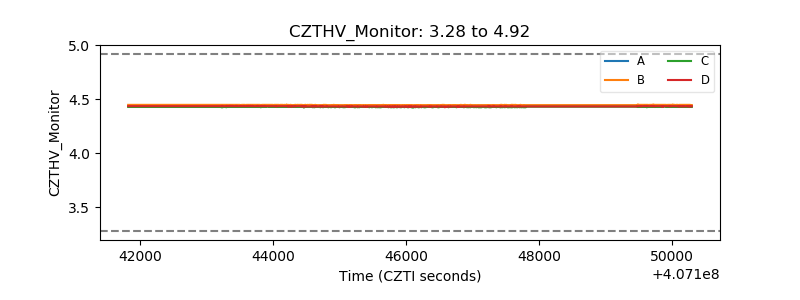 |
| D_VDD | 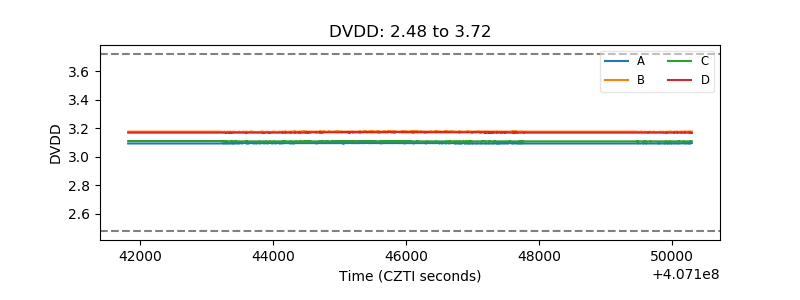 |
| Temperature 1 | 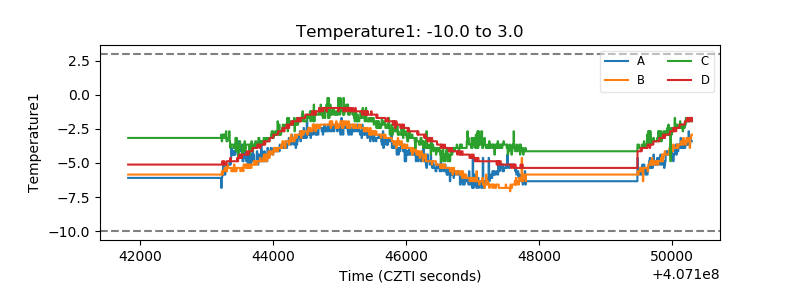 |
| Veto HV Monitor | 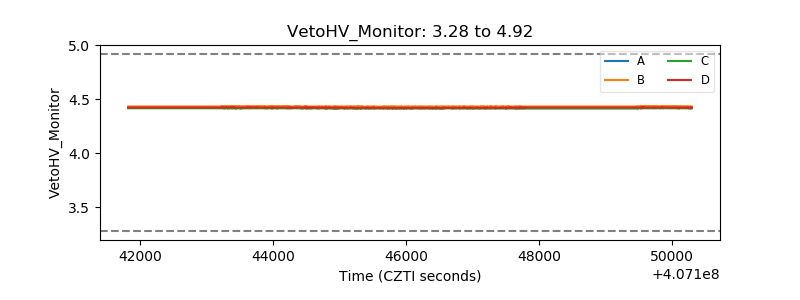 |
| Veto LLD | 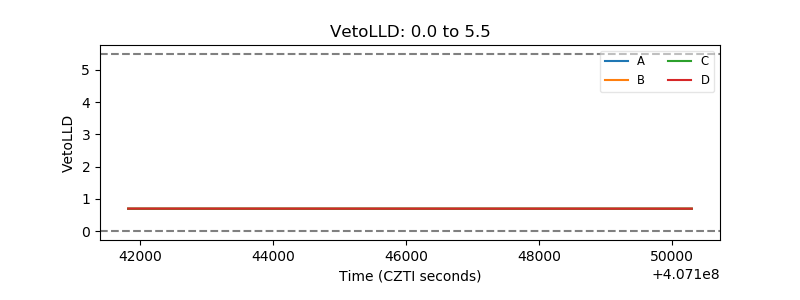 |
| Alpha Counter | 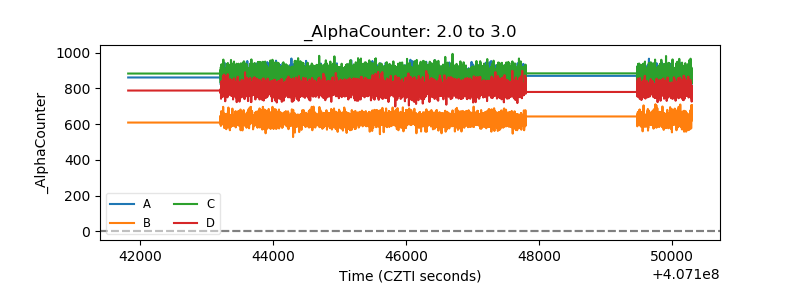 |
| _CPM_Rate | 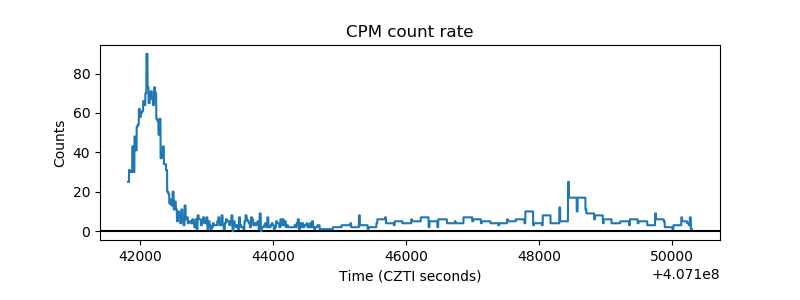 |
| CZT Counter | 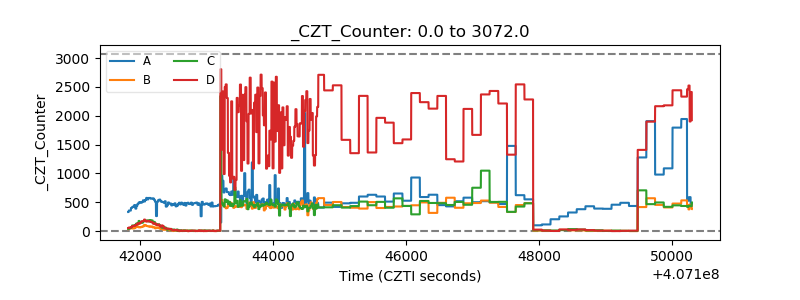 |
| +2.5 Volts monitor | 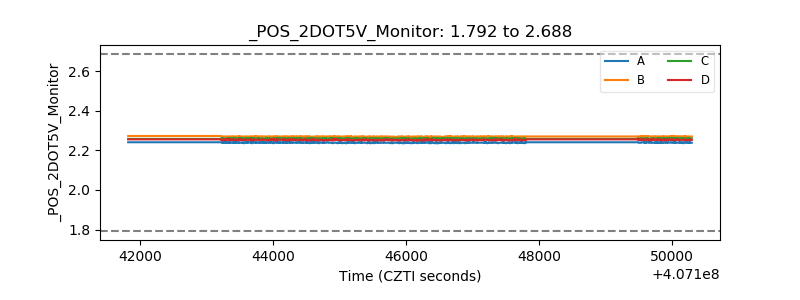 |
| +5 Volts monitor | 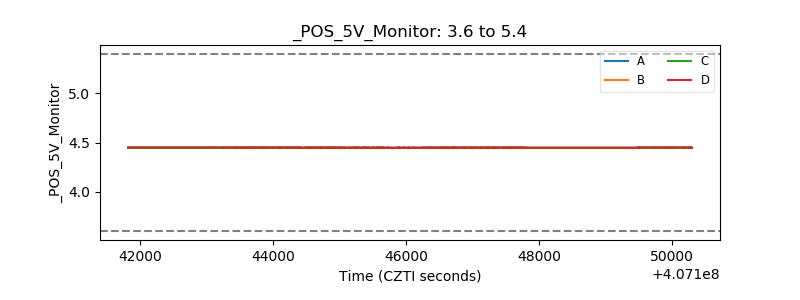 |
| _ROLL_ROT | 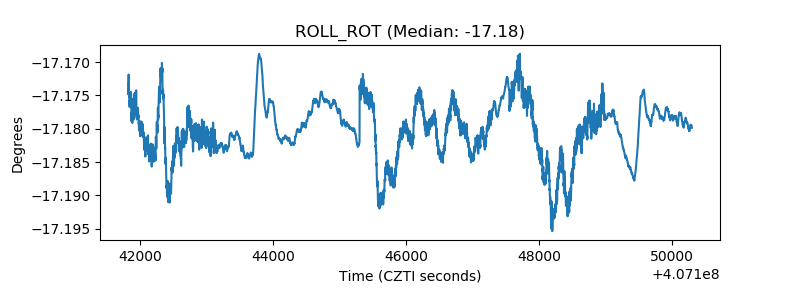 |
| _Roll_DEC | 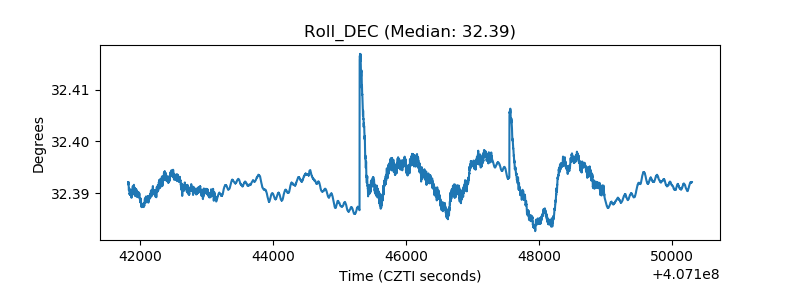 |
| _Roll_RA | 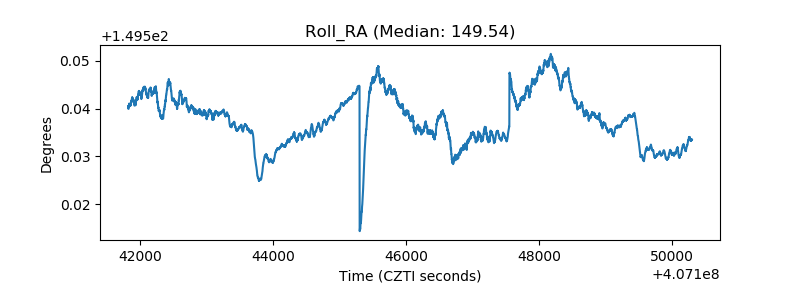 |
| Veto Counter | 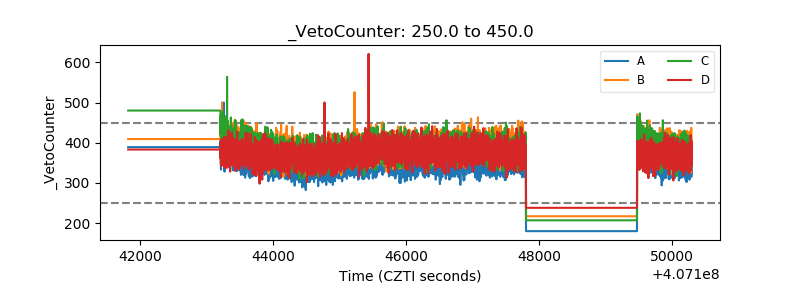 |