| Param | Original file | Final file |
|---|---|---|
| Filename | modeM0/AS1A12_054T01_9000005392_38727cztM0_level2.fits | modeM0/AS1A12_054T01_9000005392_38727cztM0_level2_quad_clean.evt |
| Size (bytes) | 607,809,600 | 82,592,640 |
| Size | 579.7 MB | 78.8 MB |
| Events in quadrant A | 3,800,262 | 628,074 |
| Events in quadrant B | 2,701,729 | 658,355 |
| Events in quadrant C | 2,769,079 | 621,866 |
| Events in quadrant D | 12,778,321 | 188,271 |
| Mode M9 | |||
|---|---|---|---|
| Quadrant | BADHDUFLAG | Total packets | Discarded packets |
| A | 0 | 17 | 0 |
| B | 0 | 17 | 0 |
| C | 0 | 17 | 0 |
| D | 0 | 18 | 0 |
| Mode SS | |||
|---|---|---|---|
| Quadrant | BADHDUFLAG | Total packets | Discarded packets |
| A | 0 | 118 | 0 |
| B | 0 | 118 | 0 |
| C | 0 | 118 | 0 |
| D | 0 | 118 | 0 |
| Mode M0 | |||
|---|---|---|---|
| Quadrant | BADHDUFLAG | Total packets | Discarded packets |
| A | 0 | 14826 | 3 |
| B | 0 | 11843 | 2 |
| C | 0 | 11767 | 2 |
| D | 0 | 41903 | 2 |
| Quadrant | Total seconds | Saturated seconds | Saturation percentage |
|---|---|---|---|
| A | 5779 | 199 | 3.443502% |
| B | 5779 | 24 | 0.415297% |
| C | 5779 | 11 | 0.190344% |
| D | 5779 | 4372 | 75.653227% |
Noise dominated data is calculated using 1-second bins in cleaned event files. If a bin has >2000 counts, and if more than 50% of those come from <1% of pixels, then it is considered to be noise-dominated and hence unusable.
| Quadrant | # 1 sec bins | Bins with >0 counts | Bins with >2000 counts | High rate bins dominated by noise | Noise dominated (total time) | Noise dominated (detector-on time) | Marked lightcurve |
|---|---|---|---|---|---|---|---|
| A | 7181 | 5780 | 152 | 152 | 2.12% | 2.63% | 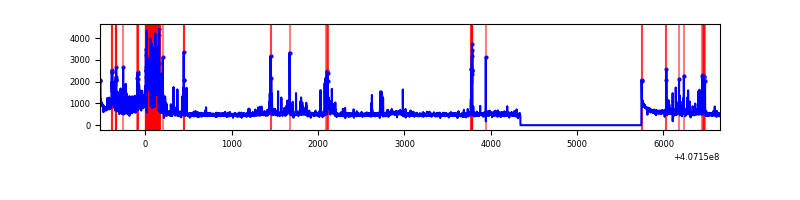 |
| B | 7181 | 5780 | 13 | 13 | 0.18% | 0.22% | 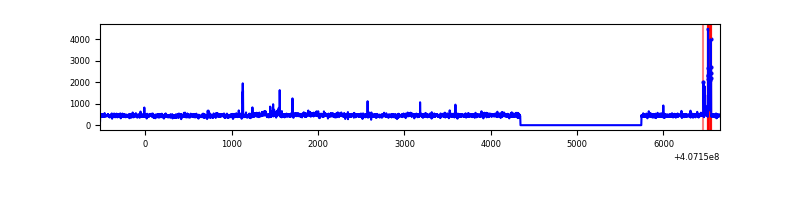 |
| C | 7181 | 5780 | 5 | 5 | 0.07% | 0.09% | 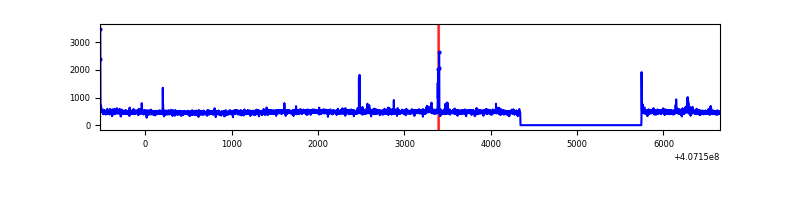 |
| D | 7181 | 5780 | 3723 | 3723 | 51.85% | 64.41% | 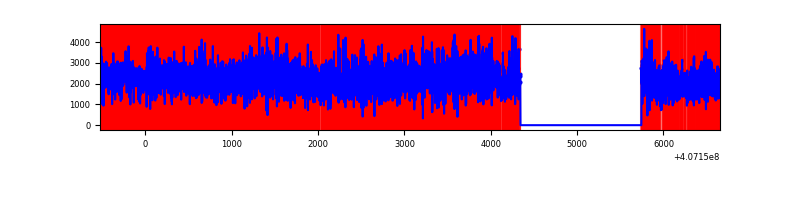 |
Top three noisy pixels from each quadrant. If the there are fewer than three noisy pixels in the level2.evt file, extra rows are filled as -1
| Pixel properties | Quadrant properties | ||||||
|---|---|---|---|---|---|---|---|
| Quadrant | DetID | PixID | Counts | Sigma | Mean | Median | Sigma |
| A | 13 | 248 | 487992 | 3711.64 | 643 | 630 | 131.3 |
| A | 10 | 83 | 415765 | 3161.58 | 643 | 630 | 131.3 |
| A | 9 | 143 | 231082 | 1755.07 | 643 | 630 | 131.3 |
| B | 5 | 172 | 59770 | 470.87 | 643 | 626 | 125.6 |
| B | 0 | 156 | 40142 | 314.6 | 643 | 626 | 125.6 |
| B | 0 | 230 | 26973 | 209.76 | 643 | 626 | 125.6 |
| C | 15 | 214 | 239311 | 1609.43 | 631 | 635 | 148.3 |
| C | 15 | 208 | 47233 | 314.22 | 631 | 635 | 148.3 |
| C | 0 | 10 | 13435 | 86.31 | 631 | 635 | 148.3 |
| D | 2 | 16 | 7937074 | 67502.55 | 480 | 466 | 117.6 |
| D | 12 | 235 | 1210409 | 10290.82 | 480 | 466 | 117.6 |
| D | 12 | 6 | 1081657 | 9195.76 | 480 | 466 | 117.6 |
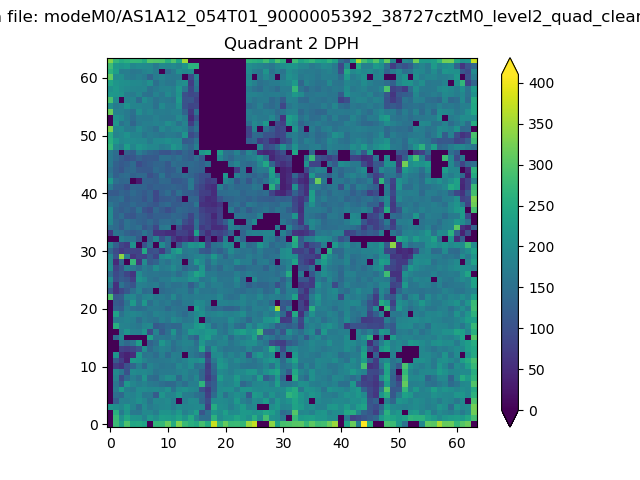
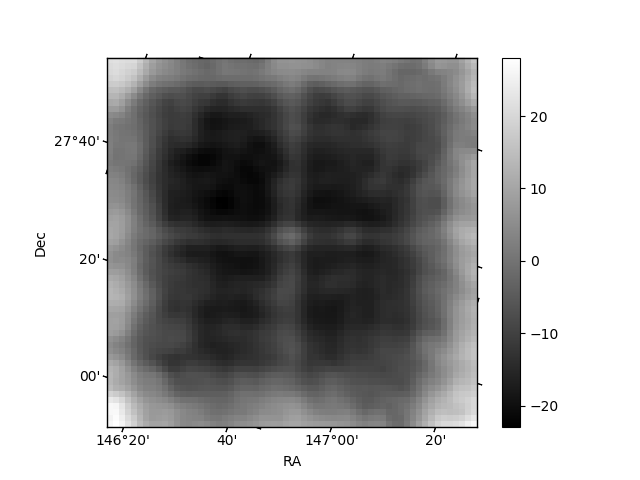
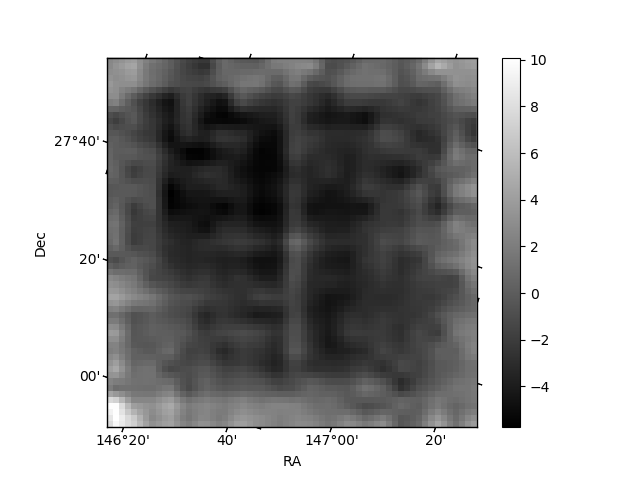
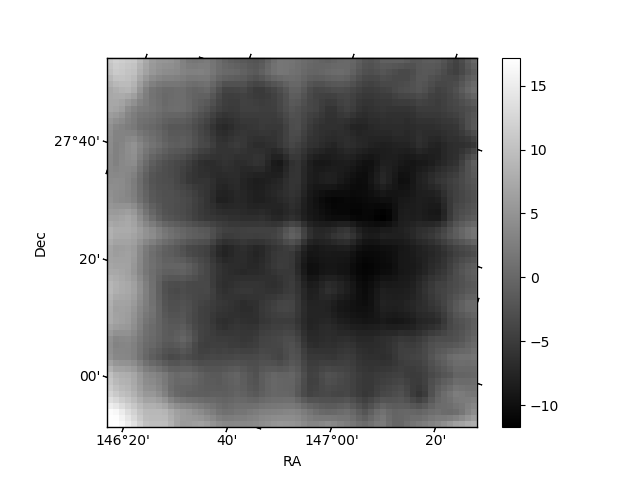
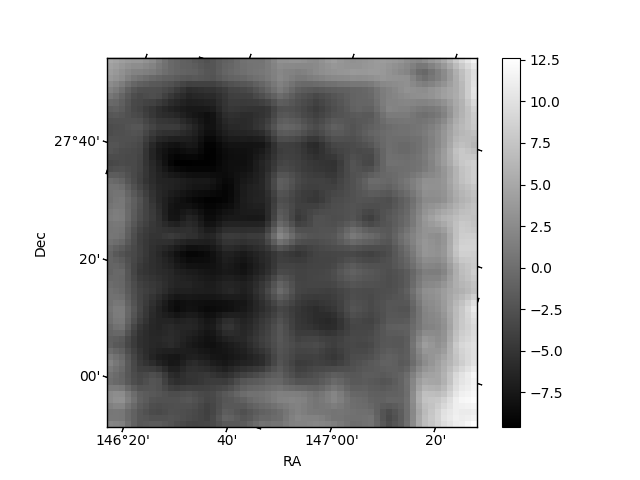
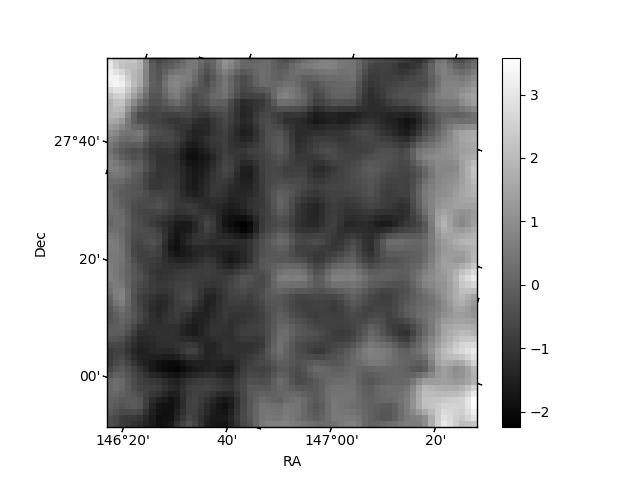
Histogram calculated using DETX and DETY for each event in the final _common_clean file
| Quadrant A | 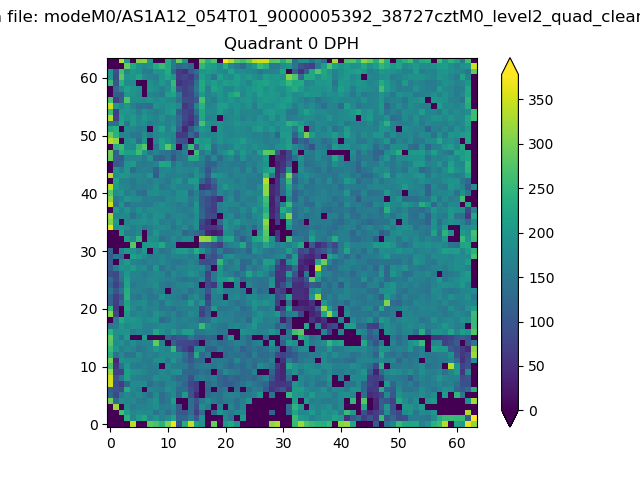 |
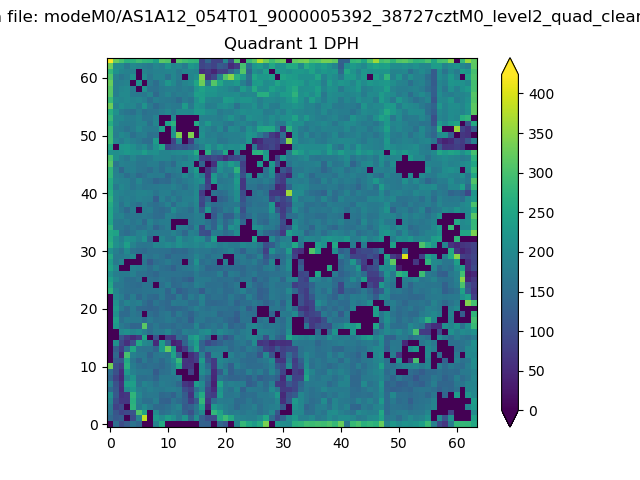 |
Quadrant B |
|---|---|---|---|
| Quadrant D | 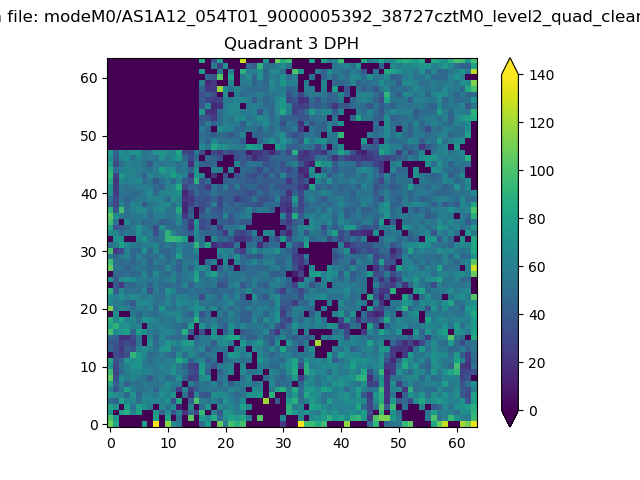 |
 |
Quadrant C |
| Plot type | Count rate plots | Images |
|---|---|---|
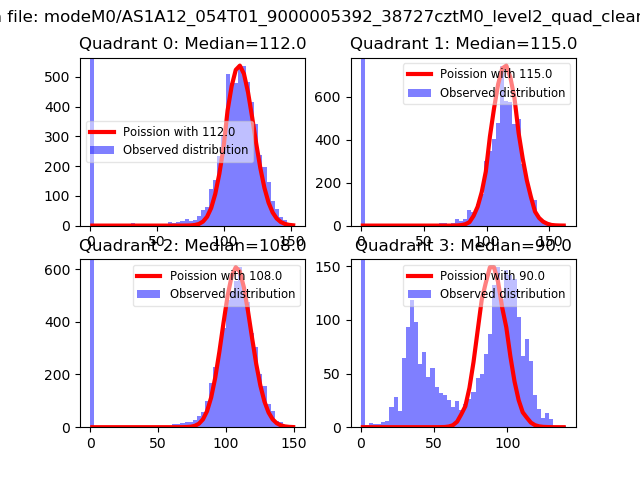
| Comparison with Poisson distribution Blue bars denote a histogram of data divided into 1 sec bins. Red curve is a Poisson curve with rate = median count rate of data. |
 |
 |
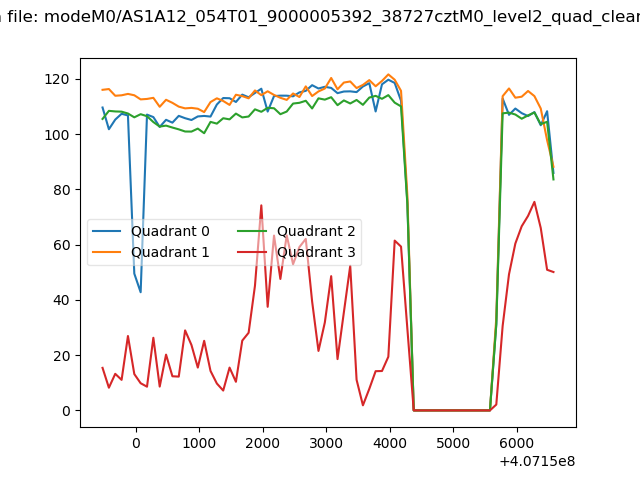
| Quadrant-wise count rates Data is divided into 100 sec bins |
 |
|
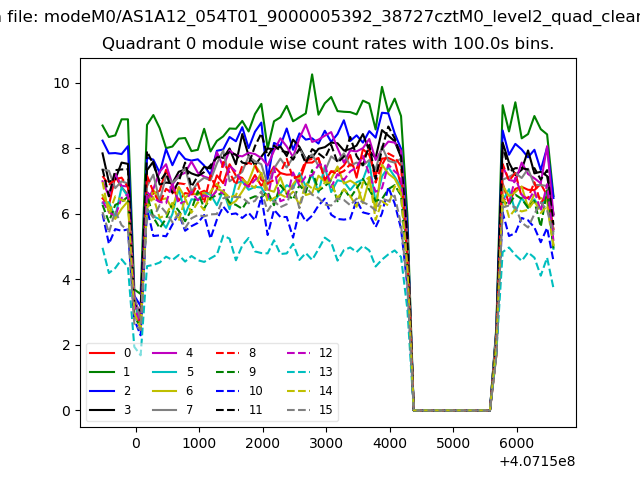
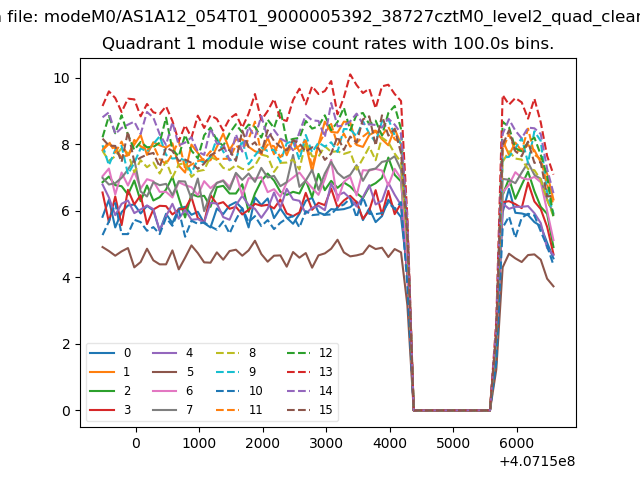
| Module-wise count rates for Quadrant A Data is divided into 100 sec bins |
 |
 |
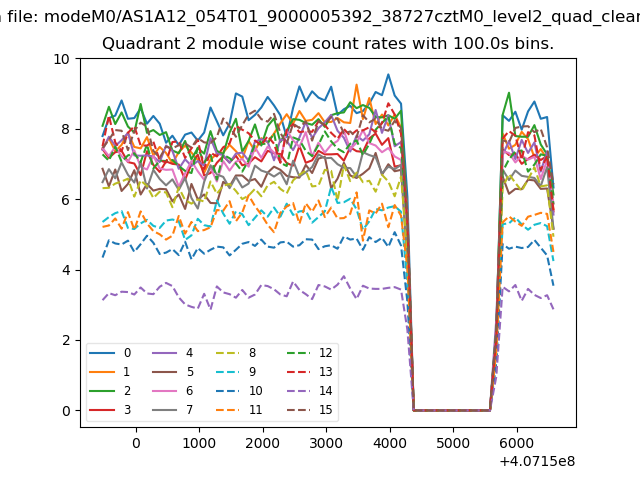
| Module-wise count rates for Quadrant B Data is divided into 100 sec bins |
 |
 |
| Module-wise count rates for Quadrant C Data is divided into 100 sec bins |
 |
 |
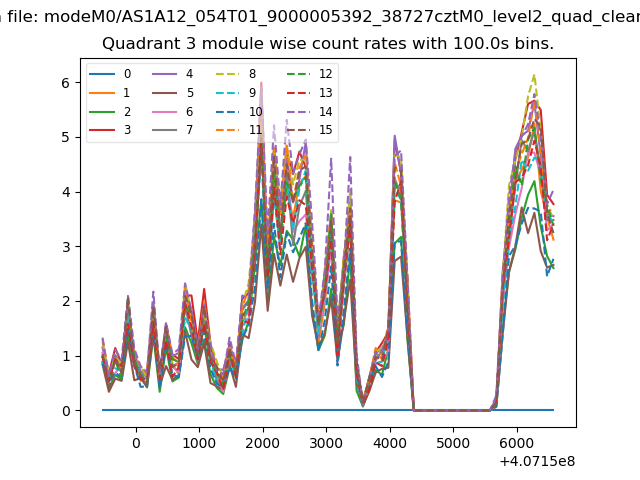
| Module-wise count rates for Quadrant D Data is divided into 100 sec bins |
 |
 |
| Parameter | Plot |
|---|---|
| CZT HV Monitor | 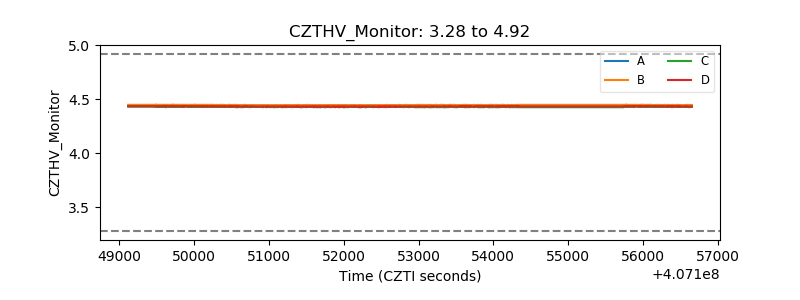 |
| D_VDD | 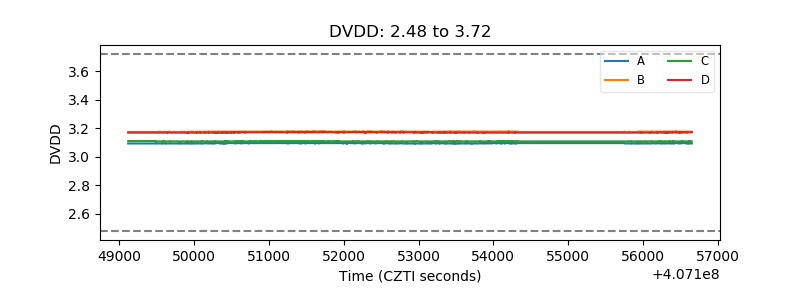 |
| Temperature 1 | 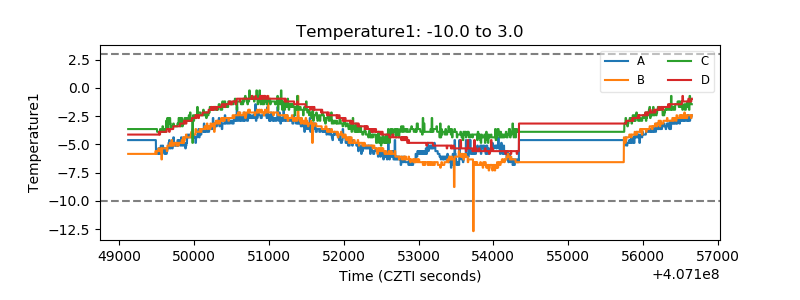 |
| Veto HV Monitor | 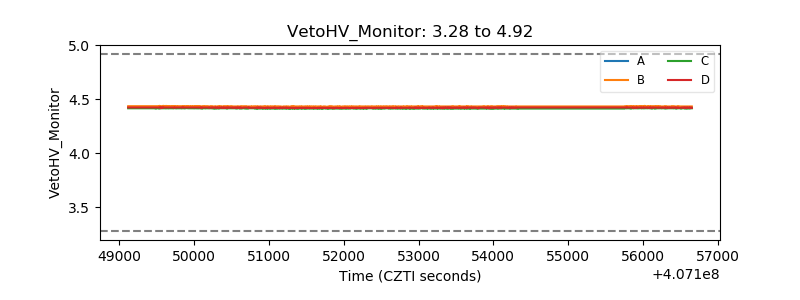 |
| Veto LLD | 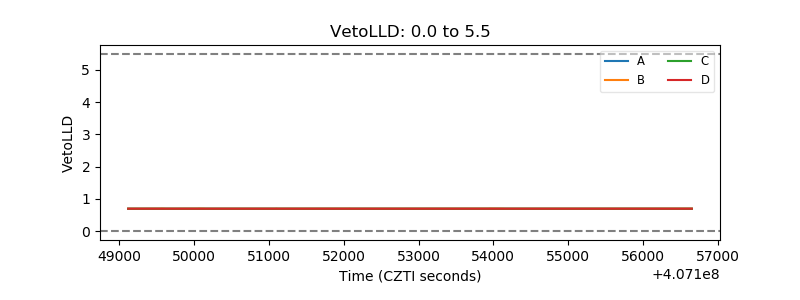 |
| Alpha Counter | 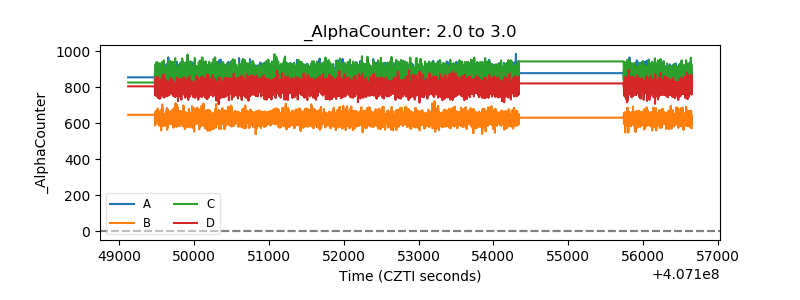 |
| _CPM_Rate | 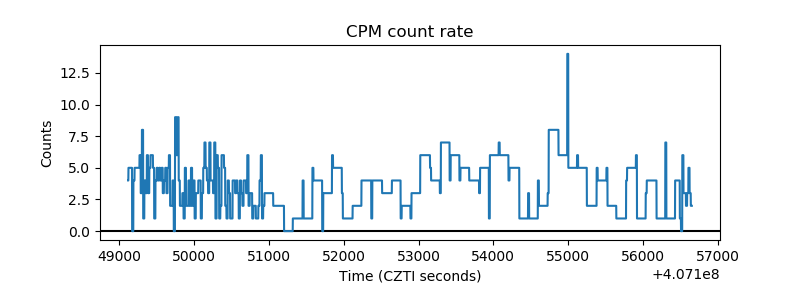 |
| CZT Counter | 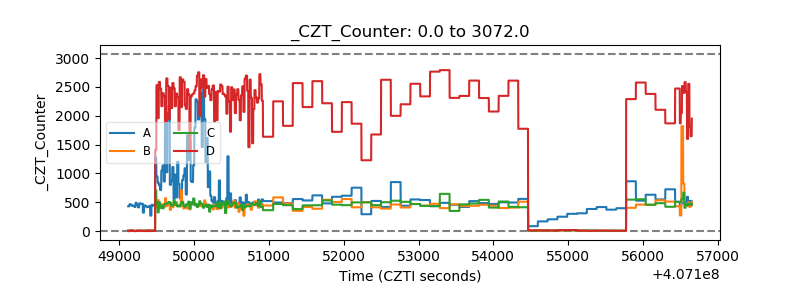 |
| +2.5 Volts monitor | 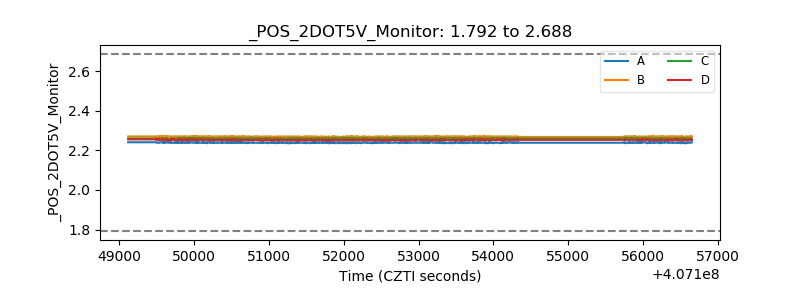 |
| +5 Volts monitor | 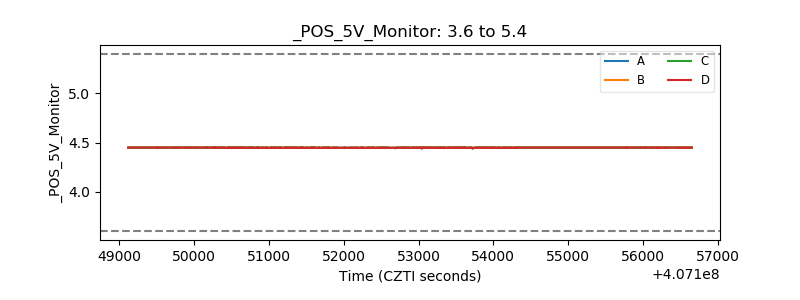 |
| _ROLL_ROT | 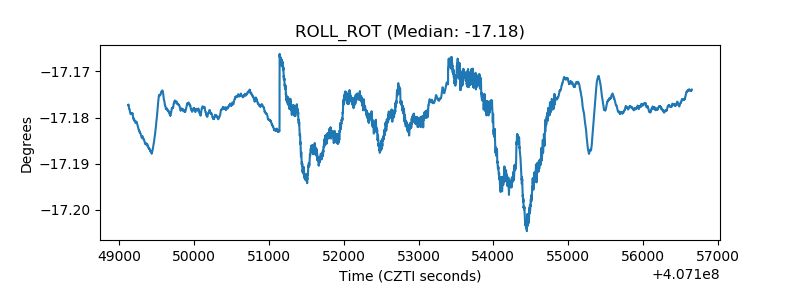 |
| _Roll_DEC |  |
| _Roll_RA | 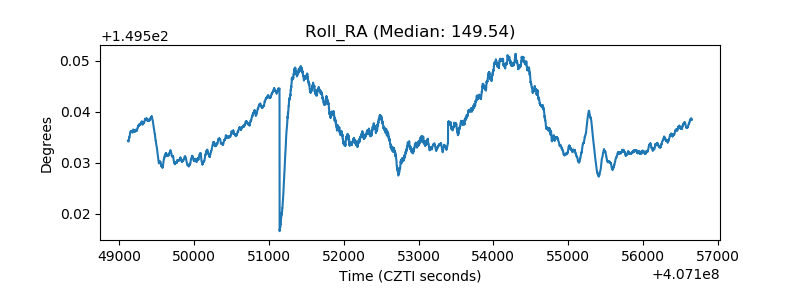 |
| Veto Counter | 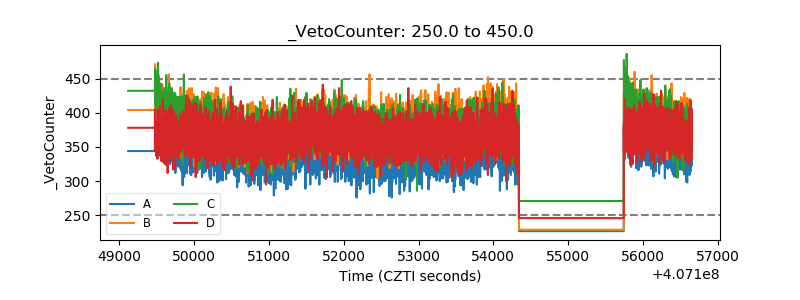 |