| Param | Original file | Final file |
|---|---|---|
| Filename | modeM0/AS1A12_054T01_9000005392_38728cztM0_level2.fits | modeM0/AS1A12_054T01_9000005392_38728cztM0_level2_quad_clean.evt |
| Size (bytes) | 575,804,160 | 89,657,280 |
| Size | 549.1 MB | 85.5 MB |
| Events in quadrant A | 3,447,903 | 662,078 |
| Events in quadrant B | 2,750,304 | 673,486 |
| Events in quadrant C | 2,833,772 | 638,898 |
| Events in quadrant D | 11,819,673 | 324,316 |
| Mode M9 | |||
|---|---|---|---|
| Quadrant | BADHDUFLAG | Total packets | Discarded packets |
| A | 0 | 15 | 0 |
| B | 0 | 15 | 0 |
| C | 0 | 15 | 0 |
| D | 0 | 16 | 0 |
| Mode SS | |||
|---|---|---|---|
| Quadrant | BADHDUFLAG | Total packets | Discarded packets |
| A | 0 | 120 | 0 |
| B | 0 | 120 | 0 |
| C | 0 | 120 | 0 |
| D | 0 | 120 | 0 |
| Mode M0 | |||
|---|---|---|---|
| Quadrant | BADHDUFLAG | Total packets | Discarded packets |
| A | 0 | 13815 | 3 |
| B | 0 | 12170 | 2 |
| C | 0 | 12040 | 2 |
| D | 0 | 39152 | 2 |
| Quadrant | Total seconds | Saturated seconds | Saturation percentage |
|---|---|---|---|
| A | 5951 | 87 | 1.461939% |
| B | 5951 | 24 | 0.403294% |
| C | 5951 | 7 | 0.117627% |
| D | 5951 | 3369 | 56.612334% |
Noise dominated data is calculated using 1-second bins in cleaned event files. If a bin has >2000 counts, and if more than 50% of those come from <1% of pixels, then it is considered to be noise-dominated and hence unusable.
| Quadrant | # 1 sec bins | Bins with >0 counts | Bins with >2000 counts | High rate bins dominated by noise | Noise dominated (total time) | Noise dominated (detector-on time) | Marked lightcurve |
|---|---|---|---|---|---|---|---|
| A | 7262 | 5952 | 54 | 54 | 0.74% | 0.91% | 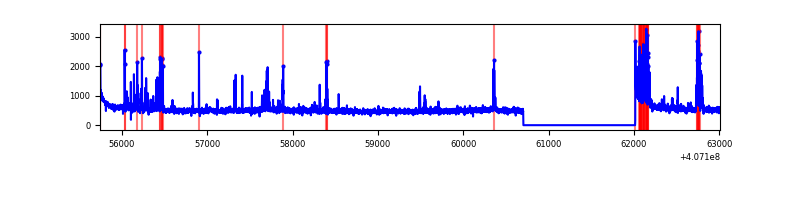 |
| B | 7262 | 5952 | 13 | 13 | 0.18% | 0.22% | 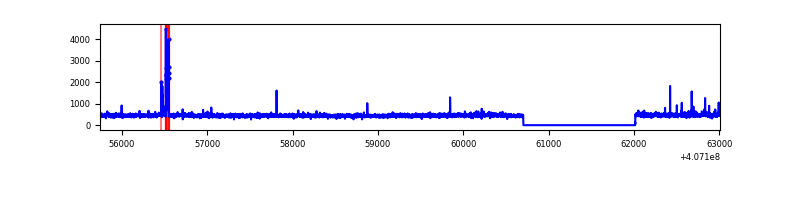 |
| C | 7262 | 5952 | 2 | 2 | 0.03% | 0.03% | 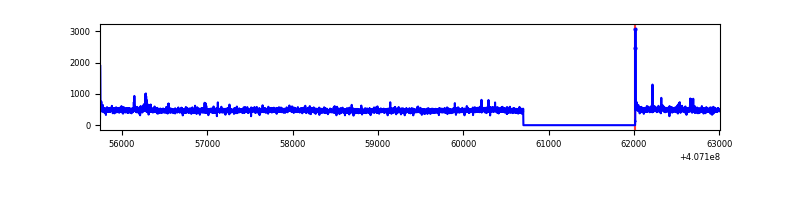 |
| D | 7262 | 5952 | 2816 | 2816 | 38.78% | 47.31% | 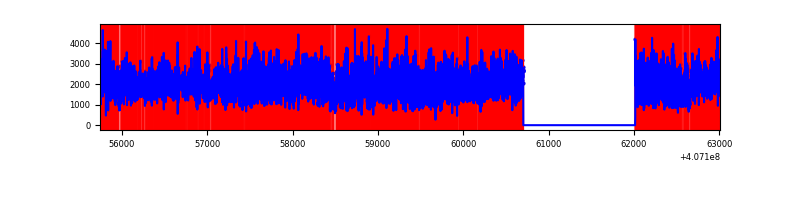 |
Top three noisy pixels from each quadrant. If the there are fewer than three noisy pixels in the level2.evt file, extra rows are filled as -1
| Pixel properties | Quadrant properties | ||||||
|---|---|---|---|---|---|---|---|
| Quadrant | DetID | PixID | Counts | Sigma | Mean | Median | Sigma |
| A | 10 | 83 | 423287 | 3095.39 | 671 | 656 | 136.5 |
| A | 13 | 248 | 323362 | 2363.53 | 671 | 656 | 136.5 |
| A | 0 | 8 | 67263 | 487.84 | 671 | 656 | 136.5 |
| B | 5 | 172 | 69905 | 530.83 | 666 | 647 | 130.5 |
| B | 0 | 230 | 20636 | 153.2 | 666 | 647 | 130.5 |
| B | 12 | 111 | 16585 | 122.15 | 666 | 647 | 130.5 |
| C | 15 | 214 | 245974 | 1597.29 | 653 | 657 | 153.6 |
| C | 15 | 208 | 22194 | 140.23 | 653 | 657 | 153.6 |
| C | 0 | 10 | 13200 | 81.67 | 653 | 657 | 153.6 |
| D | 2 | 16 | 7845262 | 58768.19 | 546 | 530 | 133.5 |
| D | 12 | 235 | 896909 | 6715.15 | 546 | 530 | 133.5 |
| D | 12 | 6 | 381225 | 2851.95 | 546 | 530 | 133.5 |
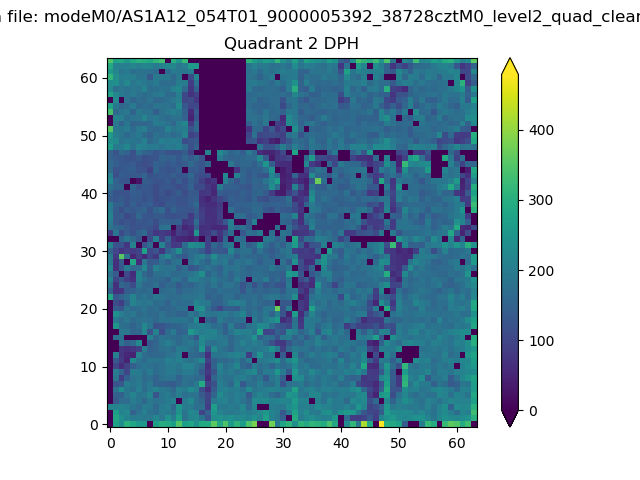
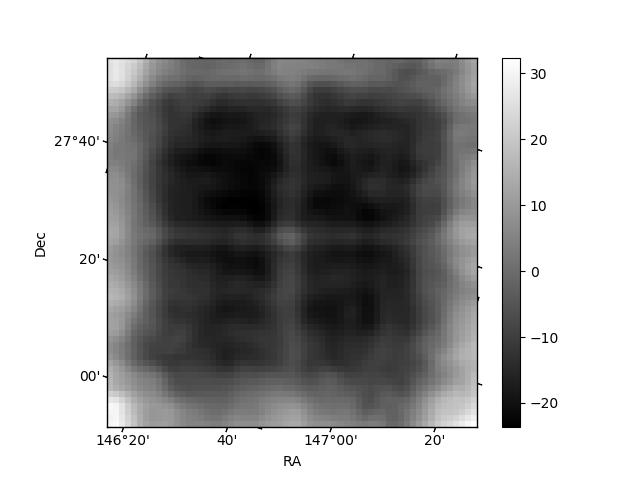
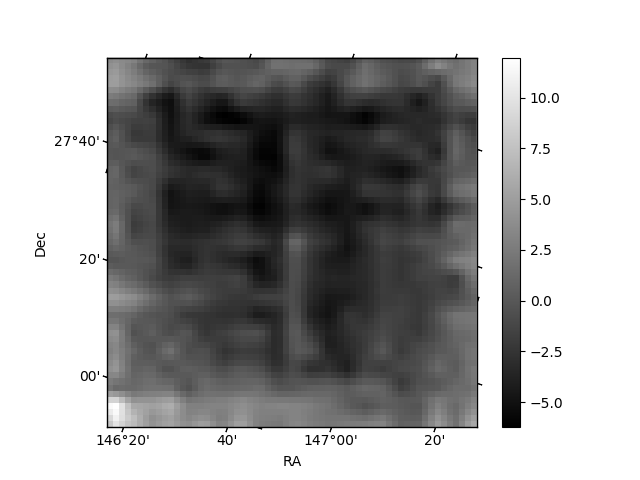
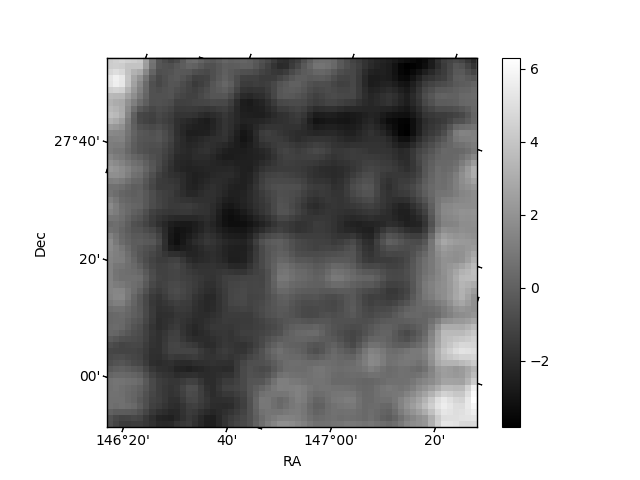
Histogram calculated using DETX and DETY for each event in the final _common_clean file
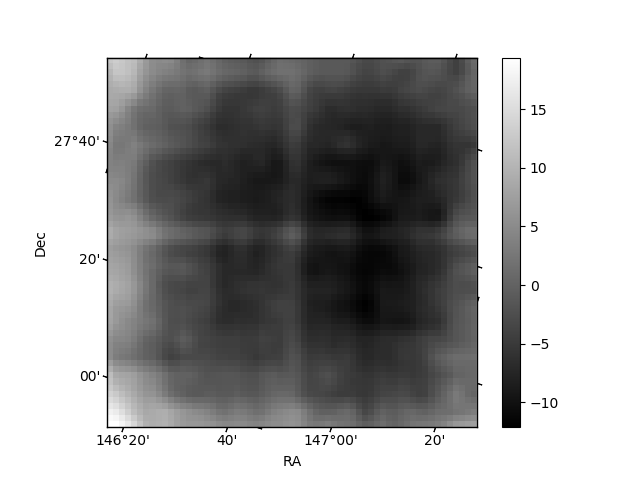
| Quadrant A | 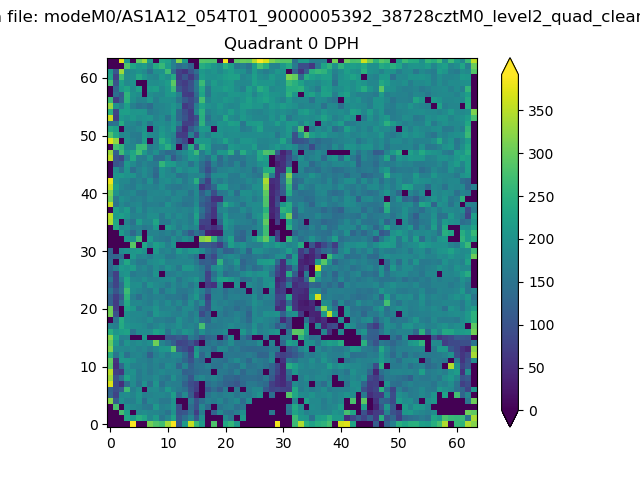 |
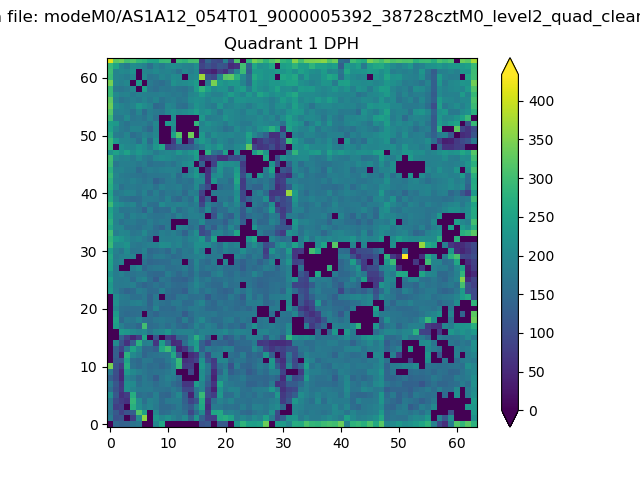 |
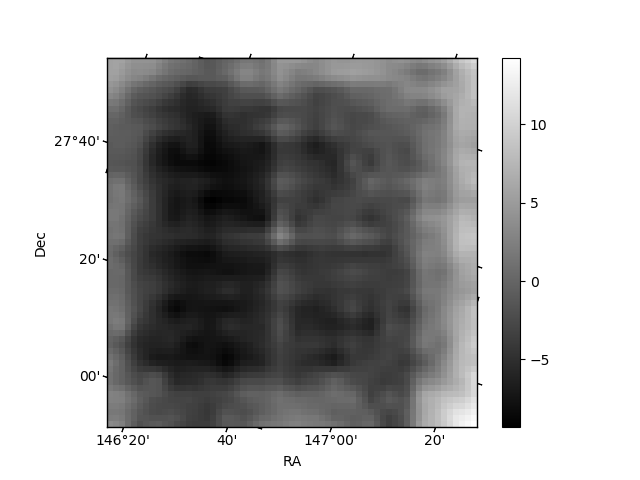
Quadrant B |
|---|---|---|---|
| Quadrant D | 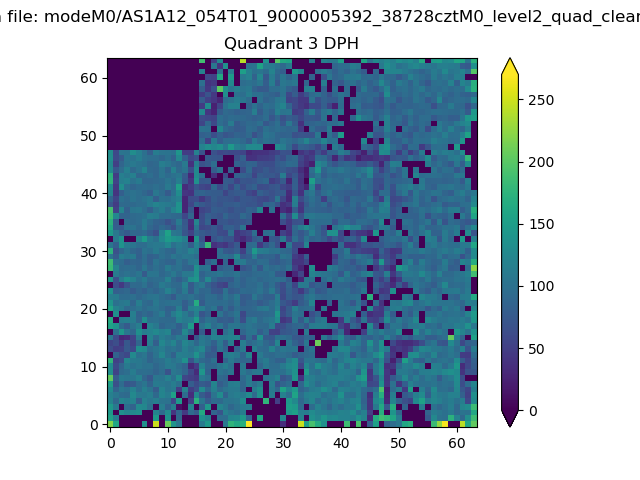 |
 |
Quadrant C |
| Plot type | Count rate plots | Images |
|---|---|---|
| Comparison with Poisson distribution Blue bars denote a histogram of data divided into 1 sec bins. Red curve is a Poisson curve with rate = median count rate of data. |
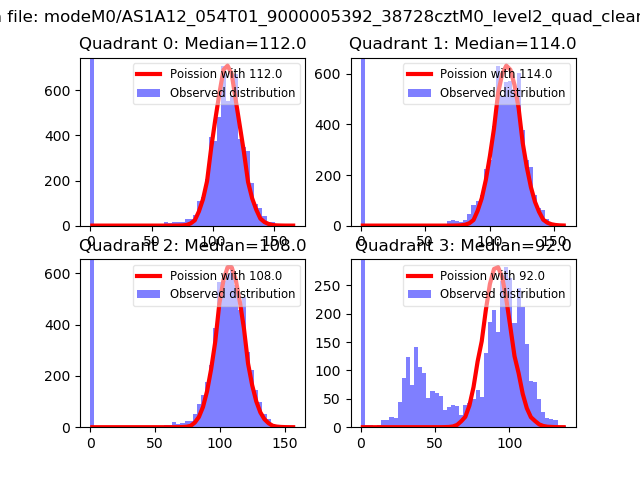 |
 |
| Quadrant-wise count rates Data is divided into 100 sec bins |
 |
|
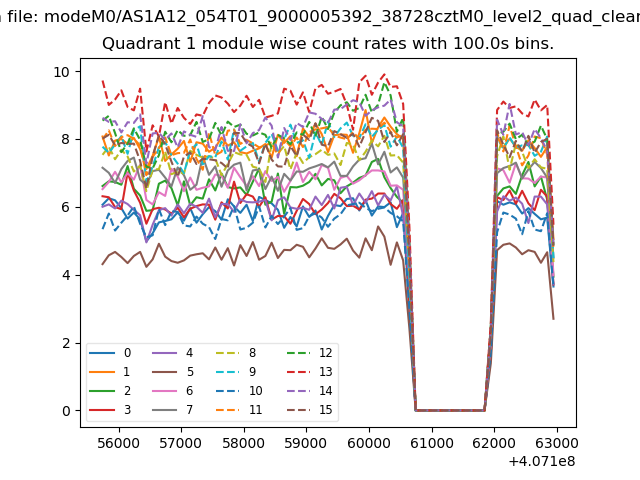
| Module-wise count rates for Quadrant A Data is divided into 100 sec bins |
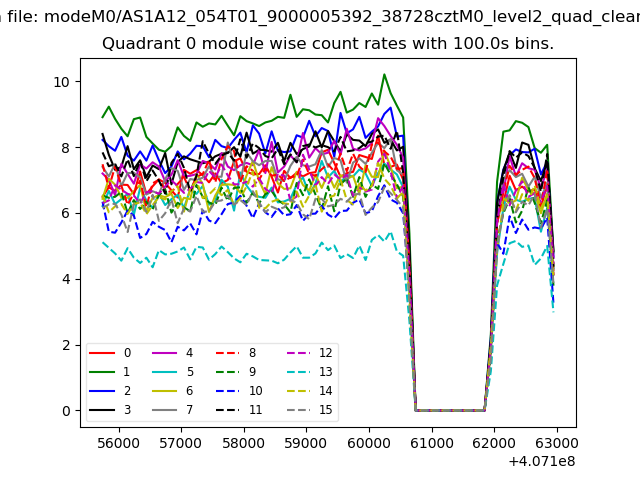 |
 |
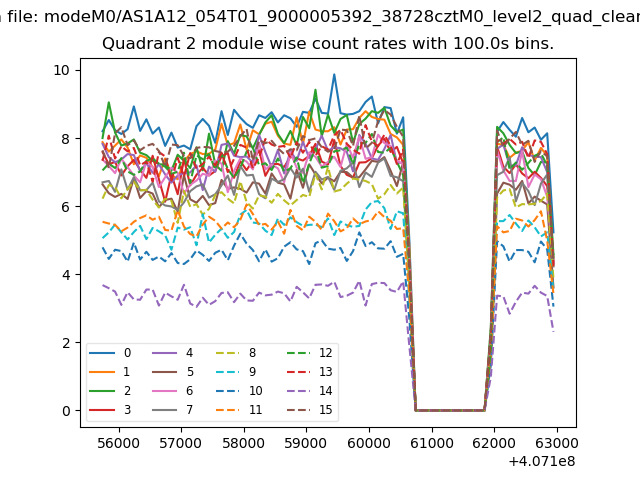
| Module-wise count rates for Quadrant B Data is divided into 100 sec bins |
 |
 |
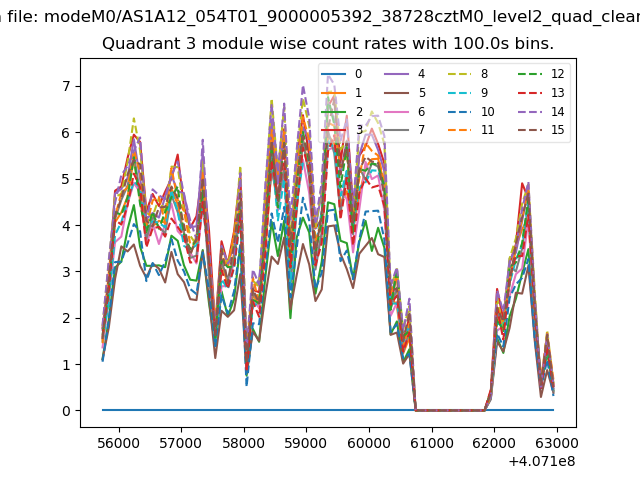
| Module-wise count rates for Quadrant C Data is divided into 100 sec bins |
 |
 |
| Module-wise count rates for Quadrant D Data is divided into 100 sec bins |
 |
 |
| Parameter | Plot |
|---|---|
| CZT HV Monitor | 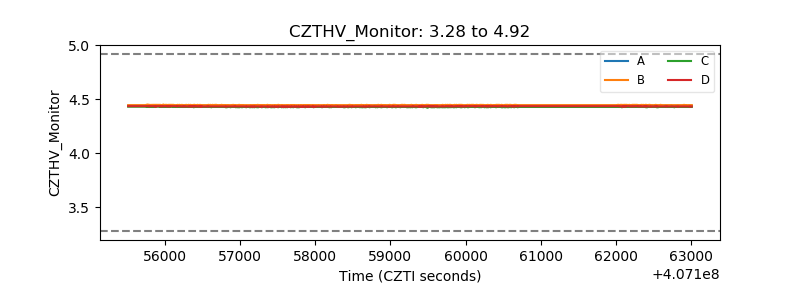 |
| D_VDD | 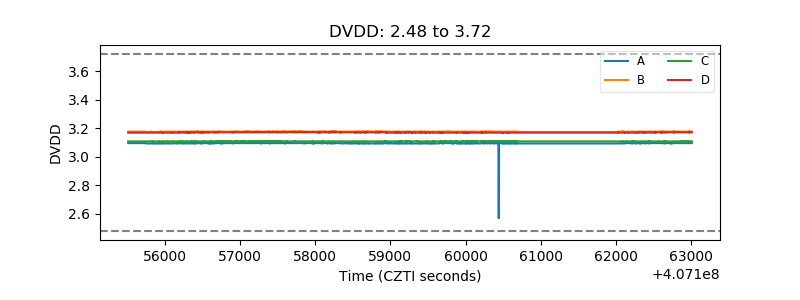 |
| Temperature 1 | 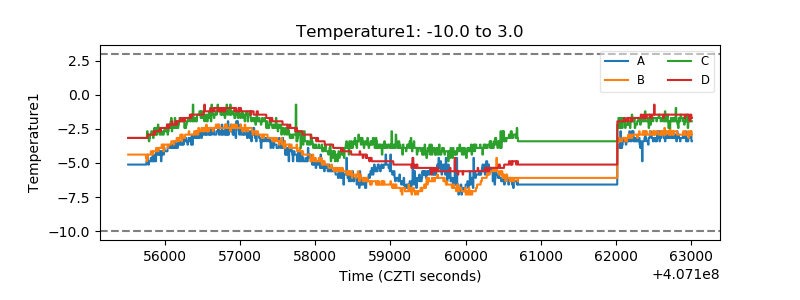 |
| Veto HV Monitor | 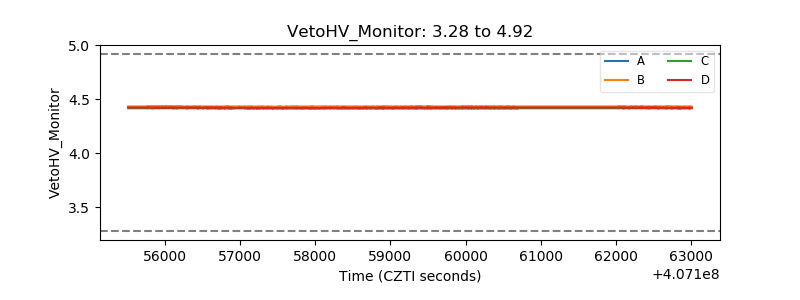 |
| Veto LLD | 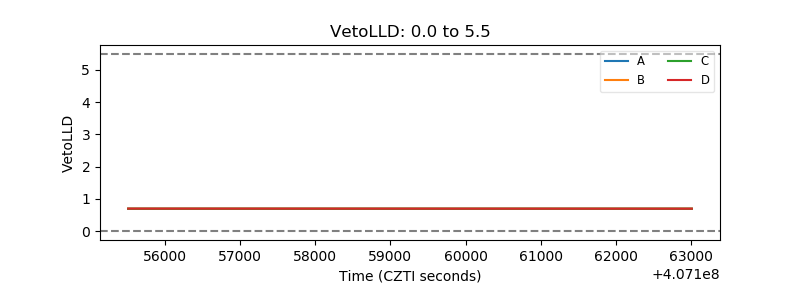 |
| Alpha Counter | 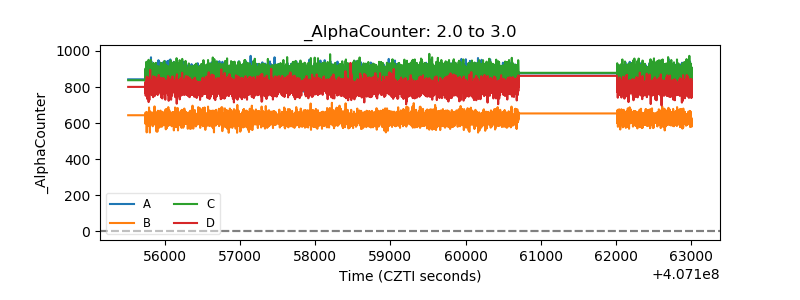 |
| _CPM_Rate | 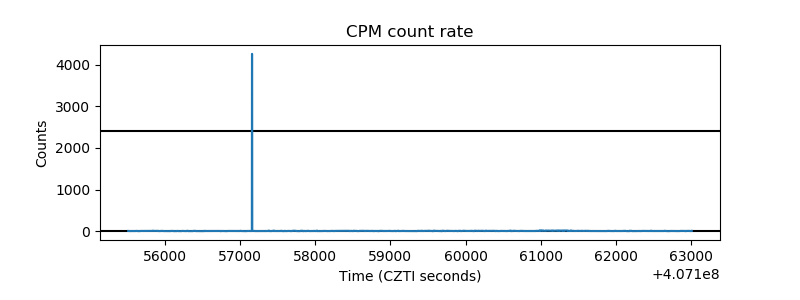 |
| CZT Counter | 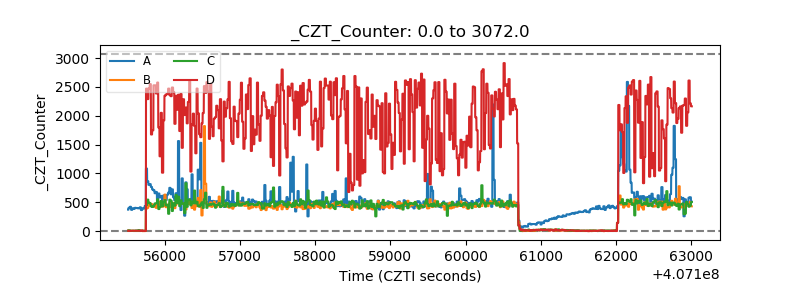 |
| +2.5 Volts monitor | 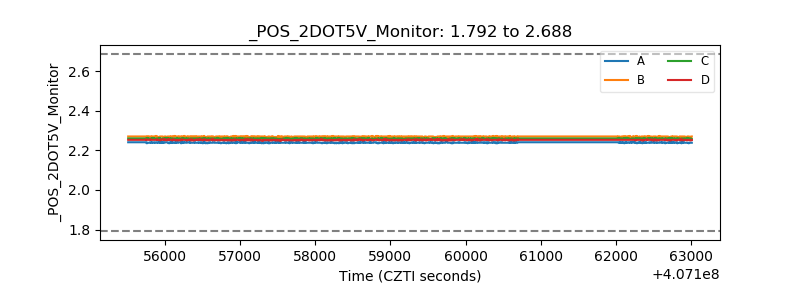 |
| +5 Volts monitor | 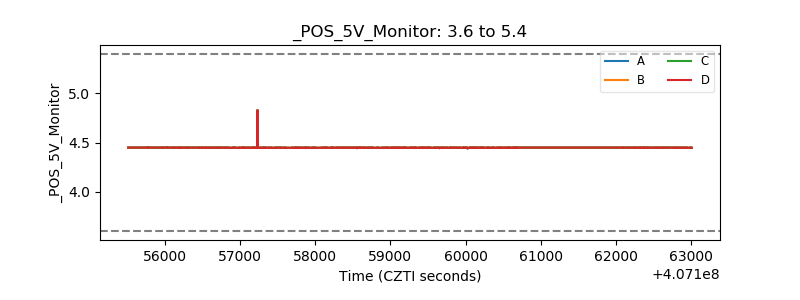 |
| _ROLL_ROT | 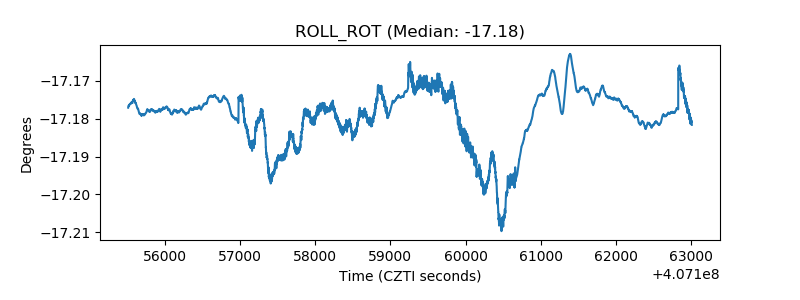 |
| _Roll_DEC | 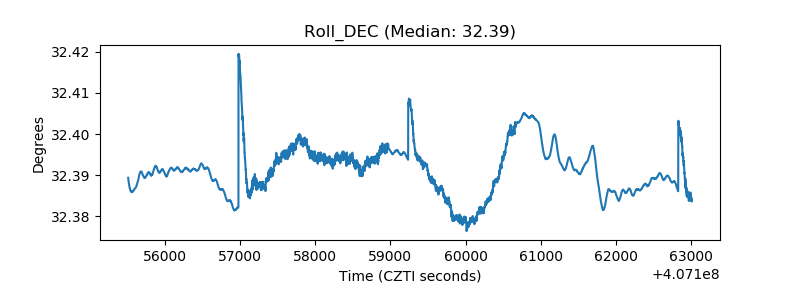 |
| _Roll_RA | 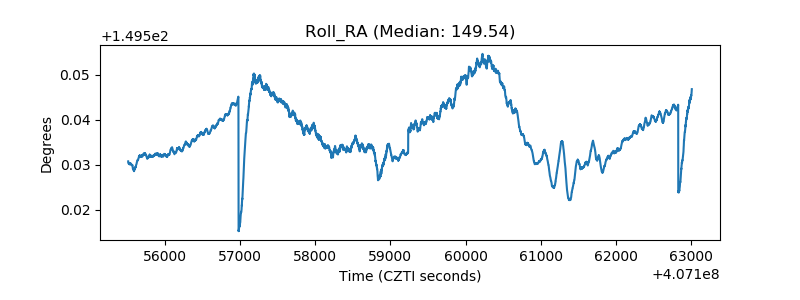 |
| Veto Counter | 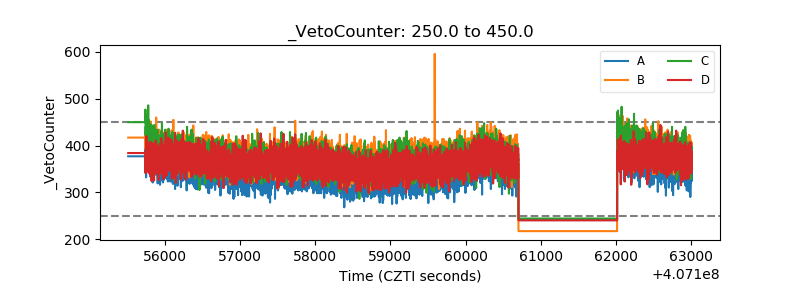 |