| Param | Original file | Final file |
|---|---|---|
| Filename | modeM0/AS1A12_054T01_9000005392_38731cztM0_level2.fits | modeM0/AS1A12_054T01_9000005392_38731cztM0_level2_quad_clean.evt |
| Size (bytes) | 1,565,668,800 | 219,574,080 |
| Size | 1.5 GB | 209.4 MB |
| Events in quadrant A | 8,924,553 | 1,694,531 |
| Events in quadrant B | 7,821,135 | 1,708,477 |
| Events in quadrant C | 7,508,077 | 1,647,331 |
| Events in quadrant D | 32,505,103 | 530,435 |
| Mode M9 | |||
|---|---|---|---|
| Quadrant | BADHDUFLAG | Total packets | Discarded packets |
| A | 0 | 53 | 0 |
| B | 0 | 53 | 0 |
| C | 0 | 53 | 0 |
| D | 0 | 54 | 0 |
| Mode SS | |||
|---|---|---|---|
| Quadrant | BADHDUFLAG | Total packets | Discarded packets |
| A | 0 | 316 | 0 |
| B | 0 | 316 | 0 |
| C | 0 | 316 | 0 |
| D | 0 | 316 | 0 |
| Mode M0 | |||
|---|---|---|---|
| Quadrant | BADHDUFLAG | Total packets | Discarded packets |
| A | 0 | 36228 | 5 |
| B | 0 | 33663 | 4 |
| C | 0 | 31881 | 4 |
| D | 0 | 107137 | 4 |
| Quadrant | Total seconds | Saturated seconds | Saturation percentage |
|---|---|---|---|
| A | 15456 | 191 | 1.235766% |
| B | 15456 | 197 | 1.274586% |
| C | 15456 | 24 | 0.155280% |
| D | 15456 | 11217 | 72.573758% |
Noise dominated data is calculated using 1-second bins in cleaned event files. If a bin has >2000 counts, and if more than 50% of those come from <1% of pixels, then it is considered to be noise-dominated and hence unusable.
| Quadrant | # 1 sec bins | Bins with >0 counts | Bins with >2000 counts | High rate bins dominated by noise | Noise dominated (total time) | Noise dominated (detector-on time) | Marked lightcurve |
|---|---|---|---|---|---|---|---|
| A | 19724 | 15459 | 111 | 111 | 0.56% | 0.72% | 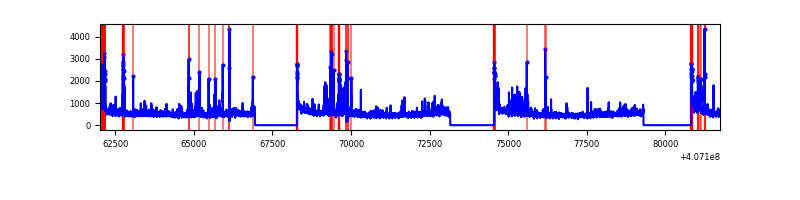 |
| B | 19724 | 15459 | 132 | 132 | 0.67% | 0.85% | 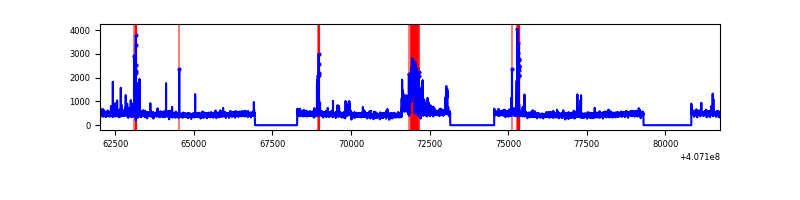 |
| C | 19724 | 15459 | 7 | 7 | 0.04% | 0.05% | 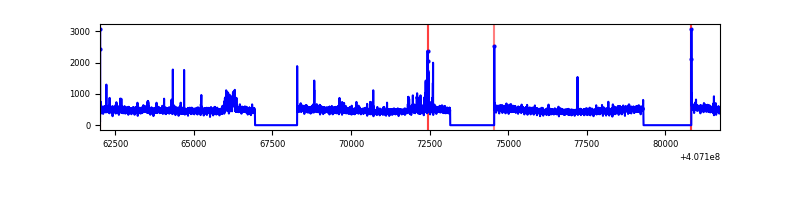 |
| D | 19724 | 15458 | 9016 | 9016 | 45.71% | 58.33% | 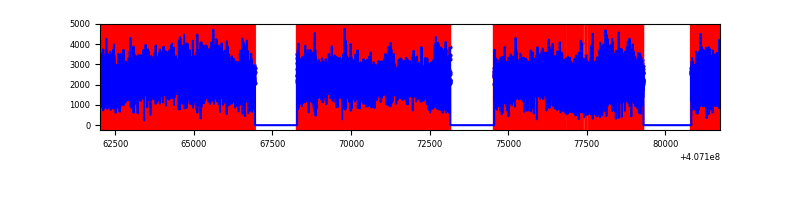 |
Top three noisy pixels from each quadrant. If the there are fewer than three noisy pixels in the level2.evt file, extra rows are filled as -1
| Pixel properties | Quadrant properties | ||||||
|---|---|---|---|---|---|---|---|
| Quadrant | DetID | PixID | Counts | Sigma | Mean | Median | Sigma |
| A | 10 | 83 | 1005094 | 2849.8 | 1735 | 1698 | 352.1 |
| A | 0 | 8 | 684077 | 1938.06 | 1735 | 1698 | 352.1 |
| A | 13 | 248 | 327666 | 925.8 | 1735 | 1698 | 352.1 |
| B | 5 | 184 | 784178 | 2361.1 | 1723 | 1676 | 331.4 |
| B | 4 | 171 | 137556 | 410.0 | 1723 | 1676 | 331.4 |
| B | 12 | 111 | 43376 | 125.82 | 1723 | 1676 | 331.4 |
| C | 15 | 214 | 625064 | 1579.1 | 1696 | 1706 | 394.8 |
| C | 14 | 53 | 143949 | 360.33 | 1696 | 1706 | 394.8 |
| C | 15 | 208 | 72979 | 180.55 | 1696 | 1706 | 394.8 |
| D | 2 | 16 | 20226081 | 66942.19 | 1241 | 1207 | 302.1 |
| D | 12 | 235 | 3672107 | 12150.29 | 1241 | 1207 | 302.1 |
| D | 12 | 6 | 1709400 | 5653.94 | 1241 | 1207 | 302.1 |
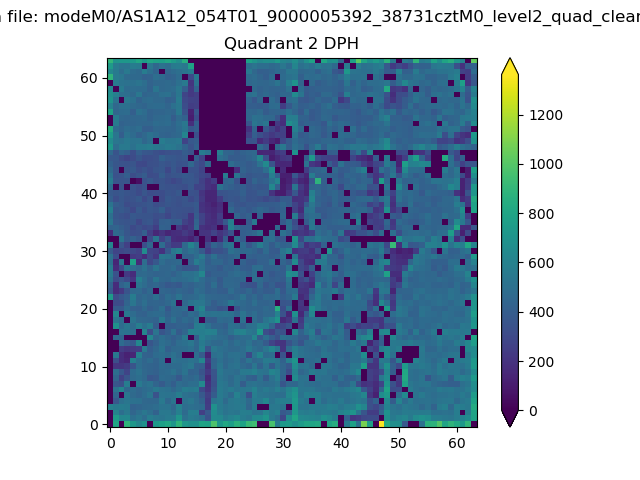
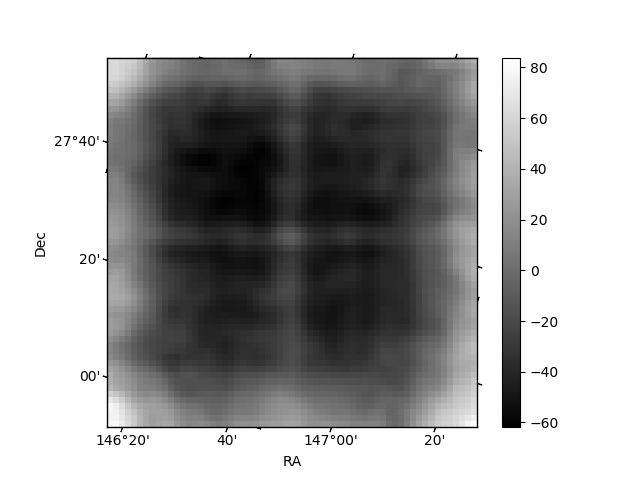
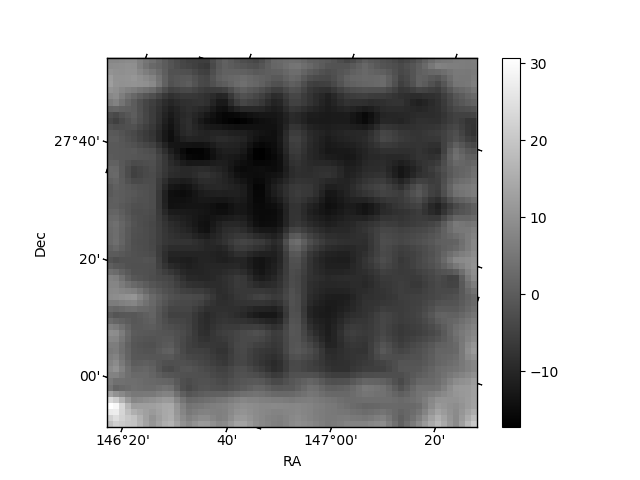
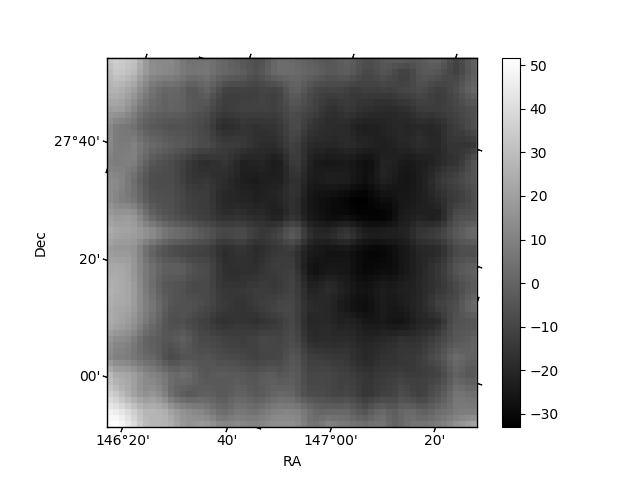
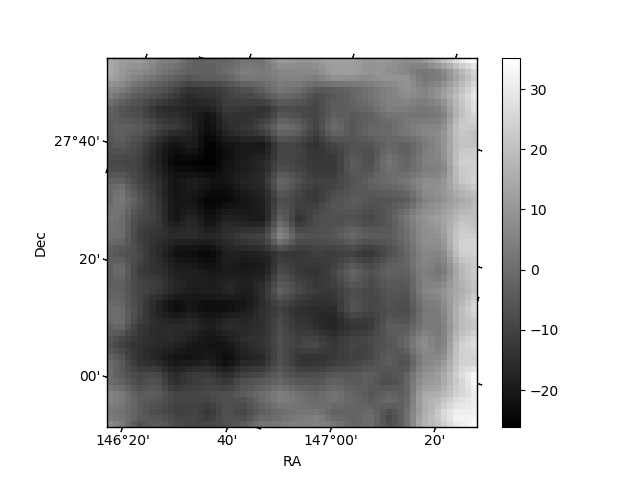
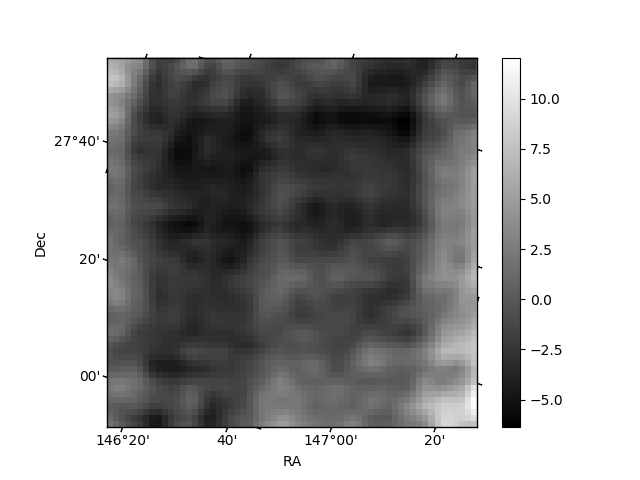
Histogram calculated using DETX and DETY for each event in the final _common_clean file
| Quadrant A | 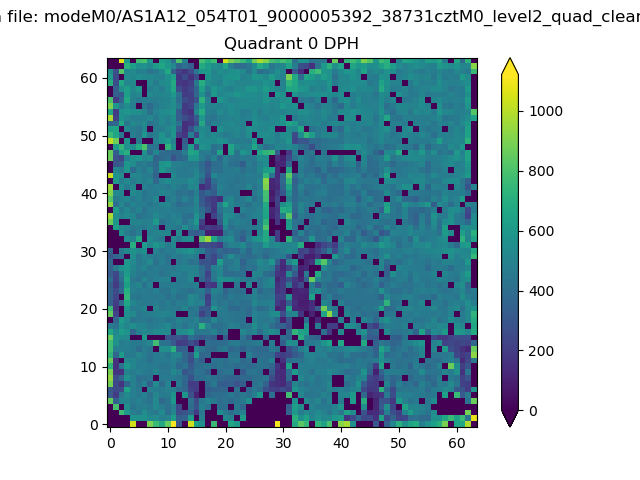 |
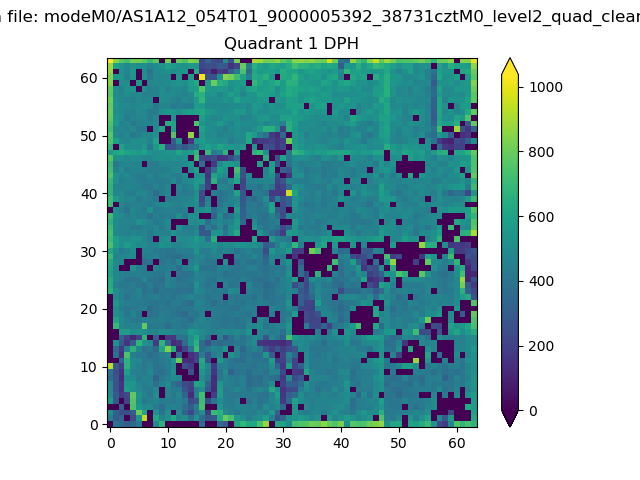 |
Quadrant B |
|---|---|---|---|
| Quadrant D | 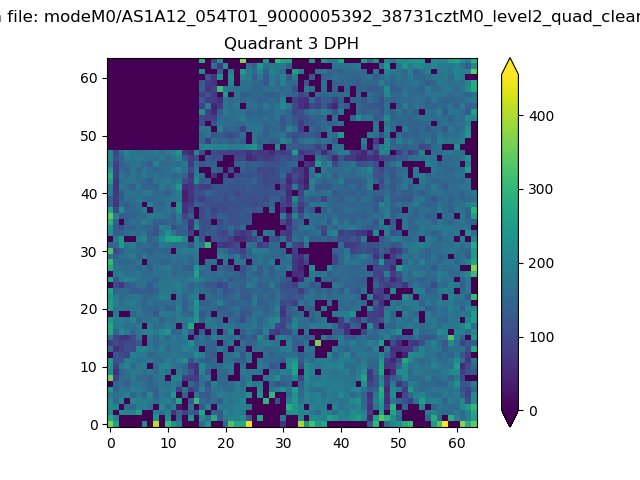 |
 |
Quadrant C |
| Plot type | Count rate plots | Images |
|---|---|---|
| Comparison with Poisson distribution Blue bars denote a histogram of data divided into 1 sec bins. Red curve is a Poisson curve with rate = median count rate of data. |
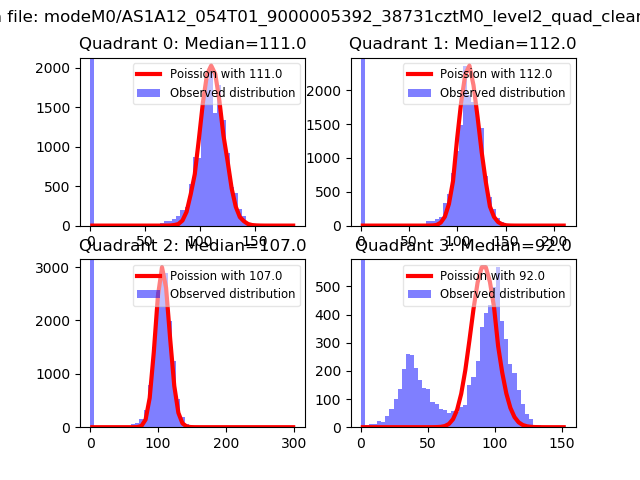 |
 |
| Quadrant-wise count rates Data is divided into 100 sec bins |
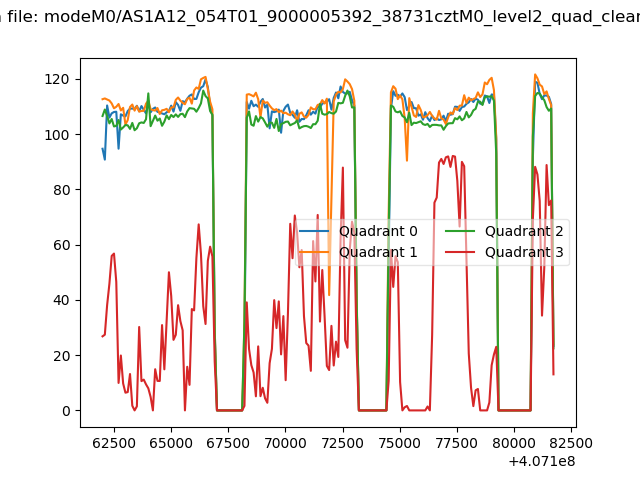 |
|
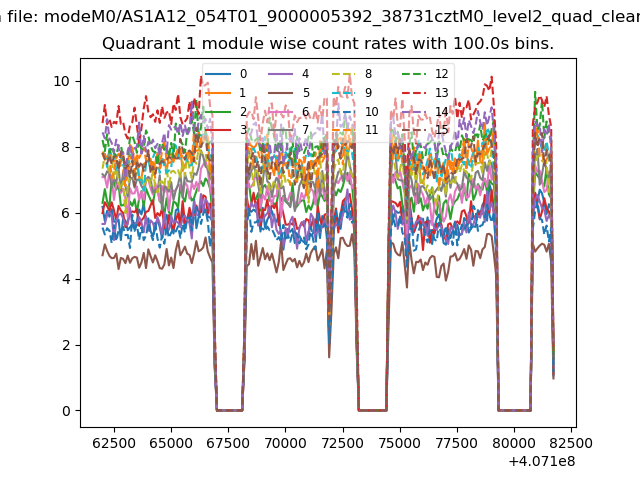
| Module-wise count rates for Quadrant A Data is divided into 100 sec bins |
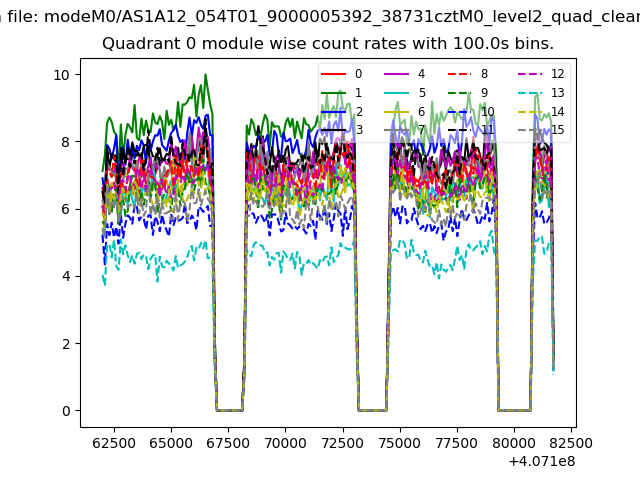 |
 |
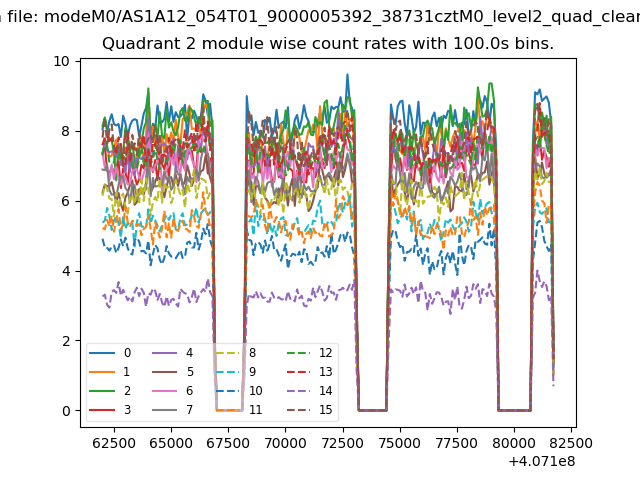
| Module-wise count rates for Quadrant B Data is divided into 100 sec bins |
 |
 |
| Module-wise count rates for Quadrant C Data is divided into 100 sec bins |
 |
 |
| Module-wise count rates for Quadrant D Data is divided into 100 sec bins |
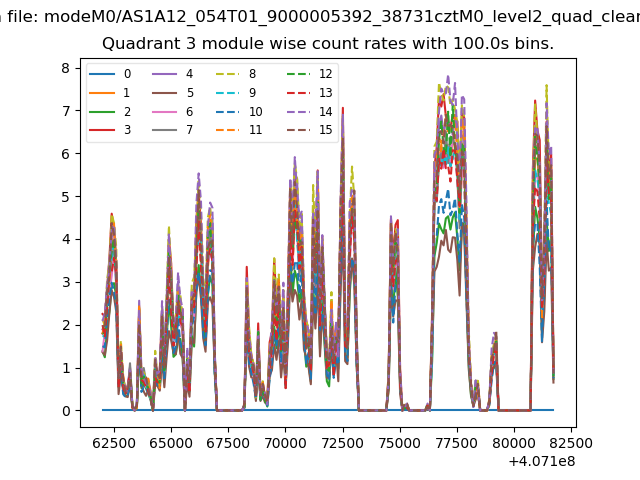 |
 |
| Parameter | Plot |
|---|---|
| CZT HV Monitor | 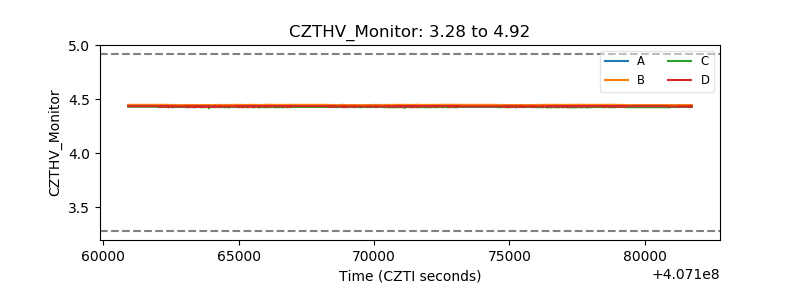 |
| D_VDD | 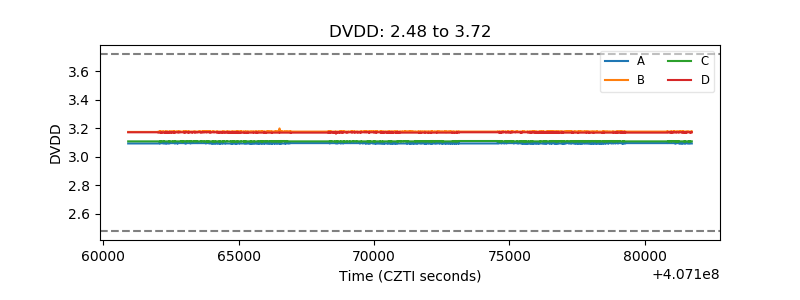 |
| Temperature 1 | 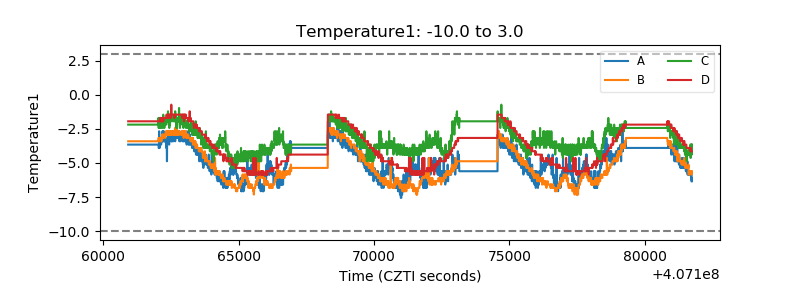 |
| Veto HV Monitor | 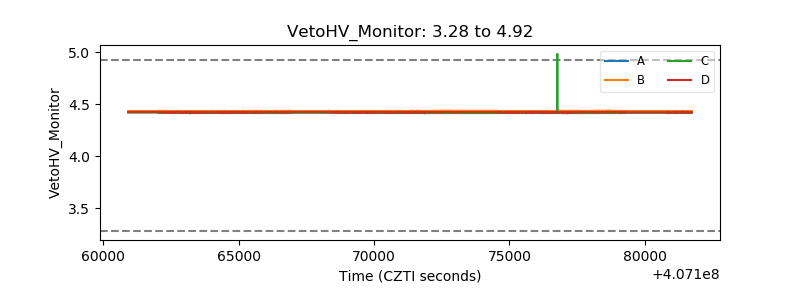 |
| Veto LLD | 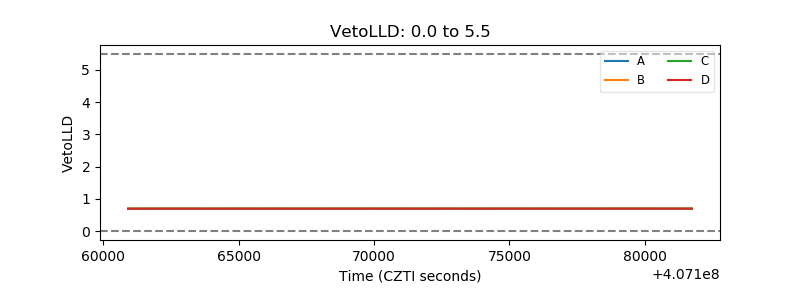 |
| Alpha Counter | 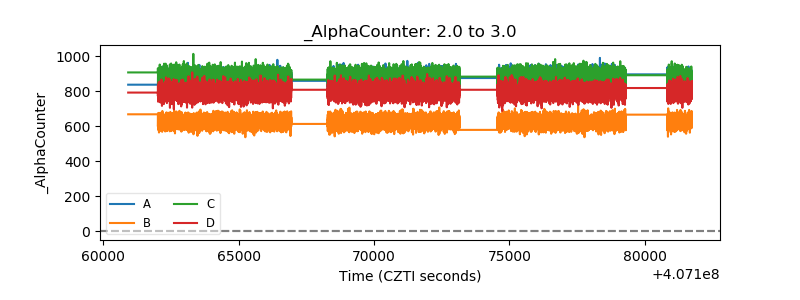 |
| _CPM_Rate | 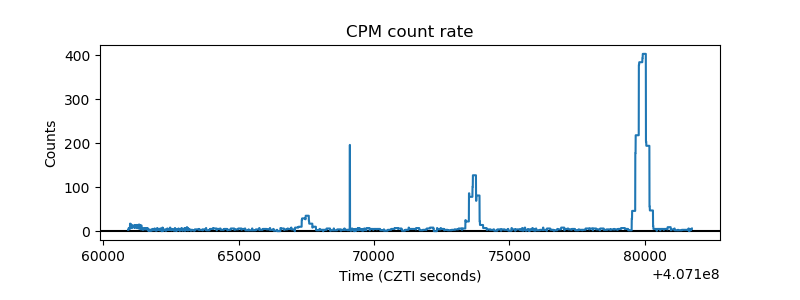 |
| CZT Counter | 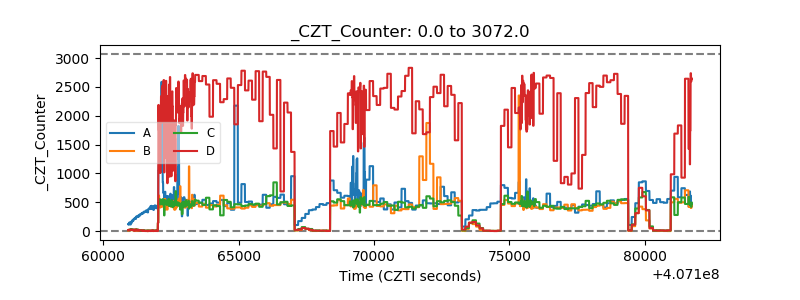 |
| +2.5 Volts monitor | 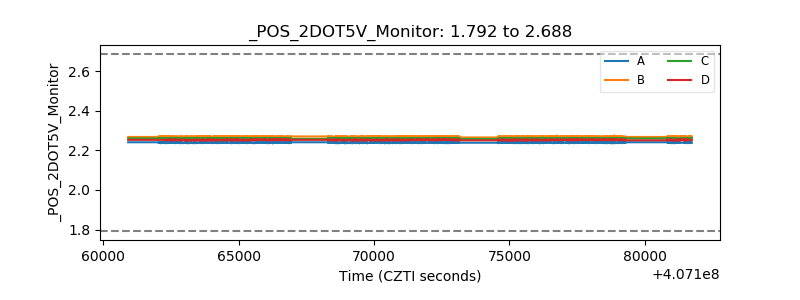 |
| +5 Volts monitor | 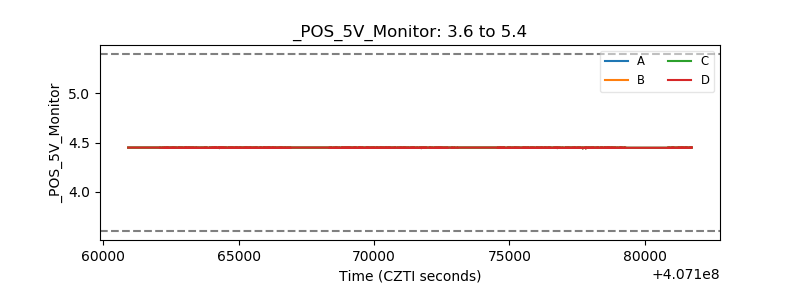 |
| _ROLL_ROT | 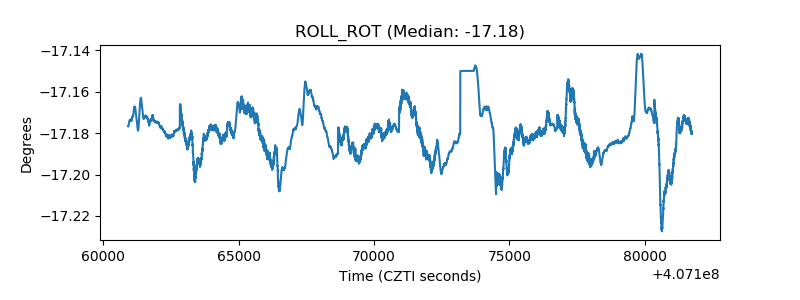 |
| _Roll_DEC | 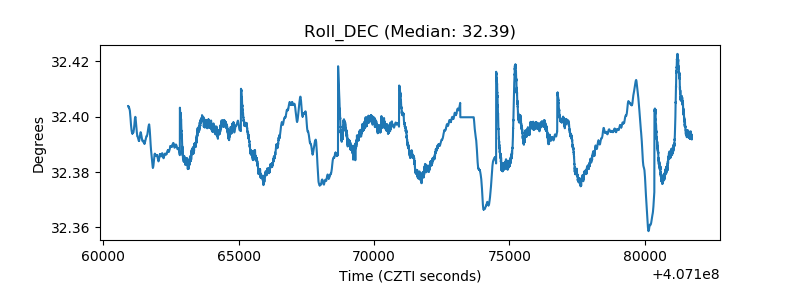 |
| _Roll_RA | 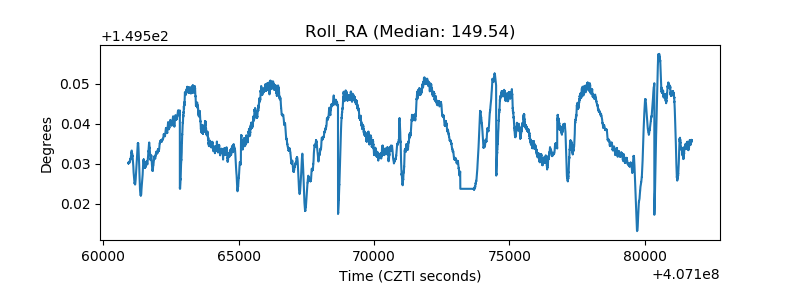 |
| Veto Counter | 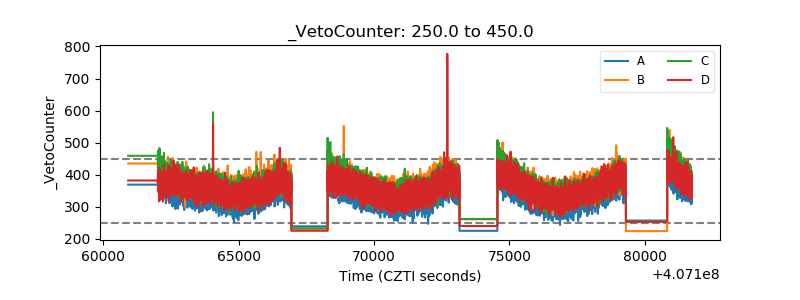 |