| Param | Original file | Final file |
|---|---|---|
| Filename | modeM0/AS1A12_054T01_9000005392_38732cztM0_level2.fits | modeM0/AS1A12_054T01_9000005392_38732cztM0_level2_quad_clean.evt |
| Size (bytes) | 507,939,840 | 88,125,120 |
| Size | 484.4 MB | 84.0 MB |
| Events in quadrant A | 3,092,914 | 645,427 |
| Events in quadrant B | 2,563,333 | 653,903 |
| Events in quadrant C | 2,729,626 | 626,299 |
| Events in quadrant D | 9,977,807 | 348,522 |
| Mode M9 | |||
|---|---|---|---|
| Quadrant | BADHDUFLAG | Total packets | Discarded packets |
| A | 0 | 32 | 0 |
| B | 0 | 32 | 0 |
| C | 0 | 32 | 0 |
| D | 0 | 32 | 0 |
| Mode SS | |||
|---|---|---|---|
| Quadrant | BADHDUFLAG | Total packets | Discarded packets |
| A | 0 | 116 | 0 |
| B | 0 | 116 | 0 |
| C | 0 | 116 | 0 |
| D | 0 | 116 | 0 |
| Mode M0 | |||
|---|---|---|---|
| Quadrant | BADHDUFLAG | Total packets | Discarded packets |
| A | 0 | 12814 | 3 |
| B | 0 | 11439 | 2 |
| C | 0 | 11617 | 2 |
| D | 0 | 33586 | 2 |
| Quadrant | Total seconds | Saturated seconds | Saturation percentage |
|---|---|---|---|
| A | 5636 | 59 | 1.046842% |
| B | 5636 | 11 | 0.195174% |
| C | 5636 | 15 | 0.266146% |
| D | 5636 | 2684 | 47.622427% |
Noise dominated data is calculated using 1-second bins in cleaned event files. If a bin has >2000 counts, and if more than 50% of those come from <1% of pixels, then it is considered to be noise-dominated and hence unusable.
| Quadrant | # 1 sec bins | Bins with >0 counts | Bins with >2000 counts | High rate bins dominated by noise | Noise dominated (total time) | Noise dominated (detector-on time) | Marked lightcurve |
|---|---|---|---|---|---|---|---|
| A | 8773 | 5638 | 35 | 35 | 0.40% | 0.62% | 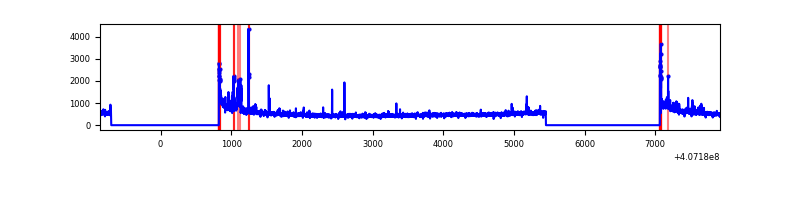 |
| B | 8773 | 5638 | 4 | 4 | 0.05% | 0.07% | 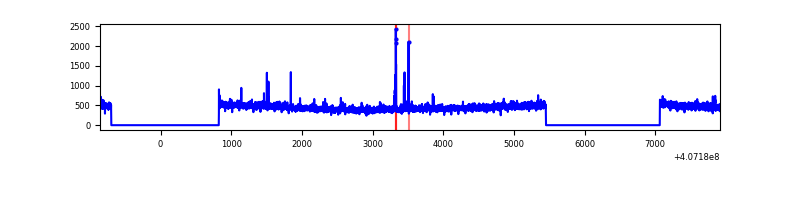 |
| C | 8773 | 5638 | 4 | 4 | 0.05% | 0.07% | 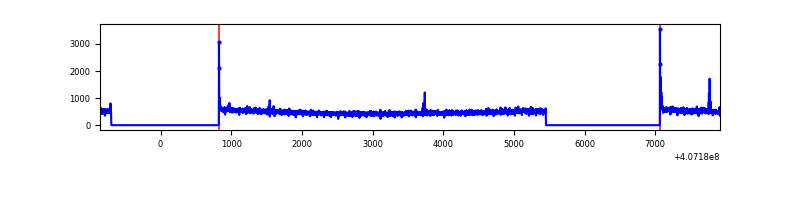 |
| D | 8773 | 5638 | 2231 | 2231 | 25.43% | 39.57% | 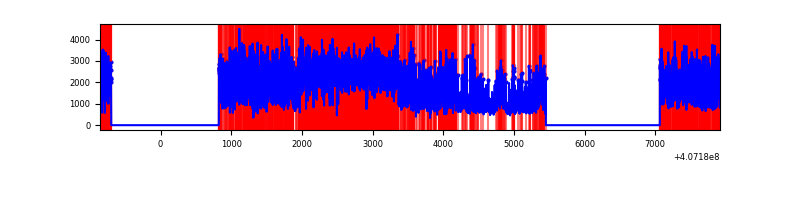 |
Top three noisy pixels from each quadrant. If the there are fewer than three noisy pixels in the level2.evt file, extra rows are filled as -1
| Pixel properties | Quadrant properties | ||||||
|---|---|---|---|---|---|---|---|
| Quadrant | DetID | PixID | Counts | Sigma | Mean | Median | Sigma |
| A | 10 | 83 | 397300 | 3037.35 | 638 | 625 | 130.6 |
| A | 0 | 8 | 128318 | 977.75 | 638 | 625 | 130.6 |
| A | 12 | 189 | 45503 | 343.63 | 638 | 625 | 130.6 |
| B | 4 | 171 | 33777 | 264.16 | 637 | 620 | 125.5 |
| B | 12 | 111 | 15766 | 120.67 | 637 | 620 | 125.5 |
| B | 11 | 111 | 14790 | 112.89 | 637 | 620 | 125.5 |
| C | 15 | 214 | 233562 | 1573.09 | 628 | 631 | 148.1 |
| C | 0 | 10 | 35365 | 234.57 | 628 | 631 | 148.1 |
| C | 15 | 208 | 9345 | 58.85 | 628 | 631 | 148.1 |
| D | 2 | 16 | 6660372 | 50258.56 | 535 | 518 | 132.5 |
| D | 12 | 235 | 410611 | 3094.76 | 535 | 518 | 132.5 |
| D | 2 | 250 | 277466 | 2089.99 | 535 | 518 | 132.5 |
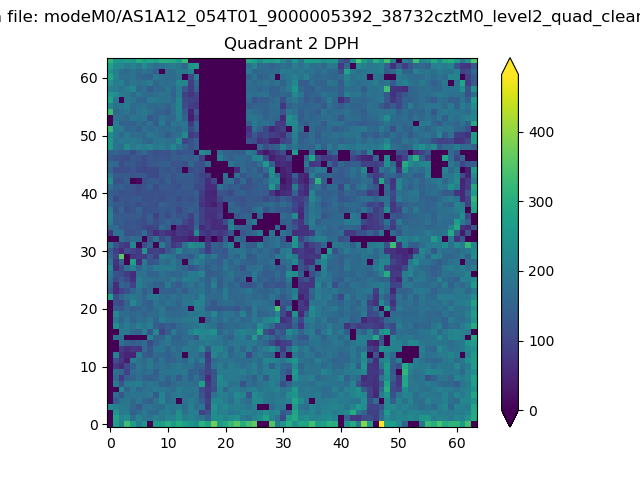
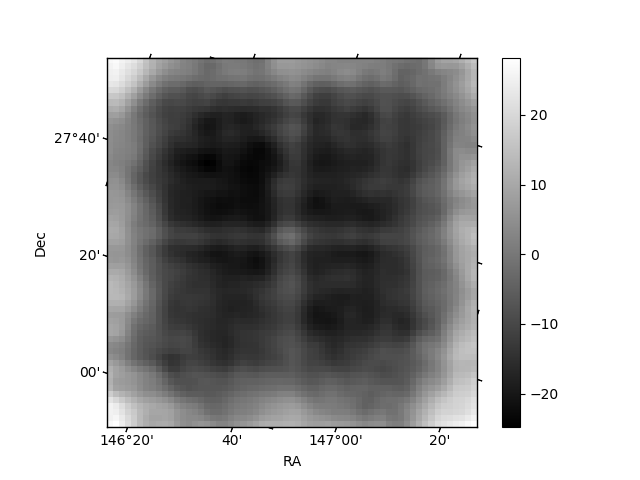
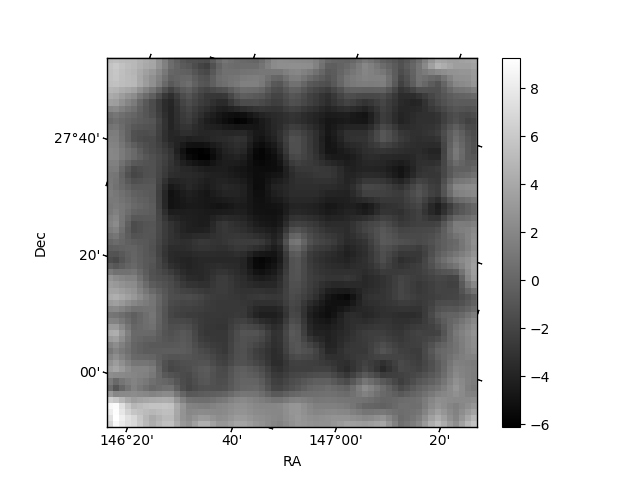
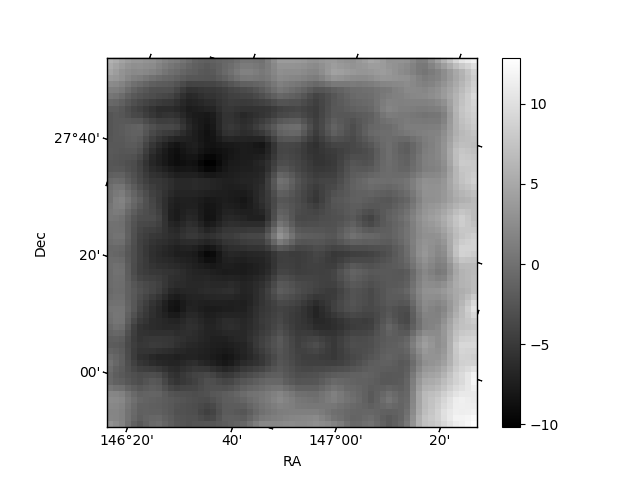
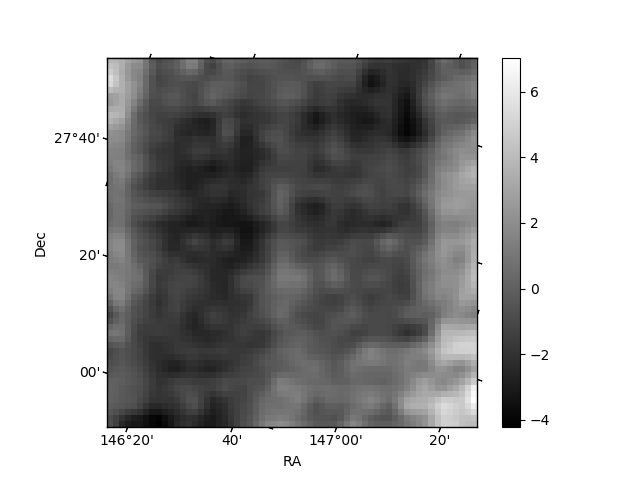
Histogram calculated using DETX and DETY for each event in the final _common_clean file
| Quadrant A | 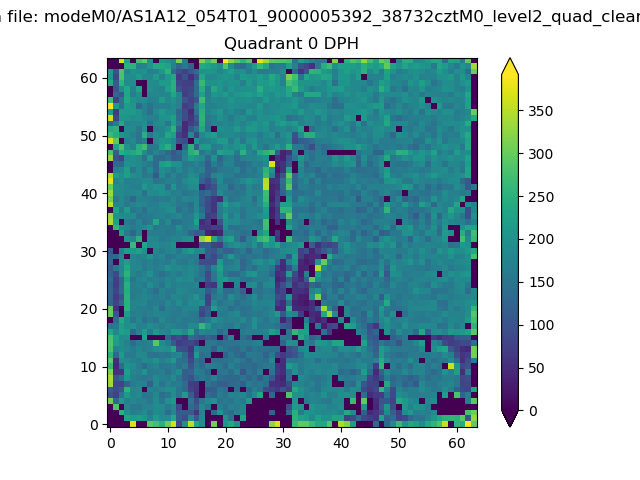 |
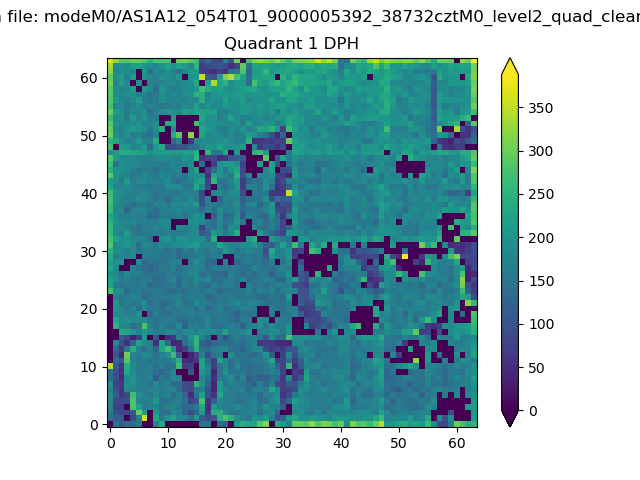 |
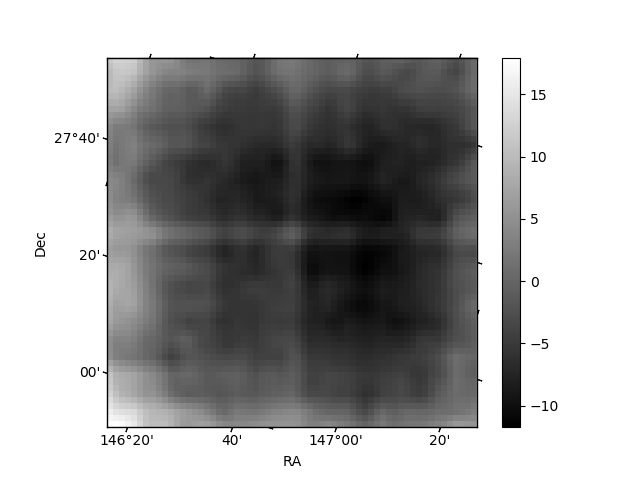
Quadrant B |
|---|---|---|---|
| Quadrant D | 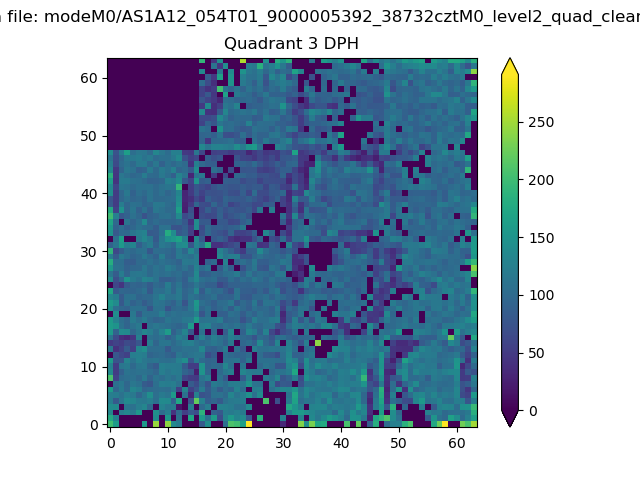 |
 |
Quadrant C |
| Plot type | Count rate plots | Images |
|---|---|---|
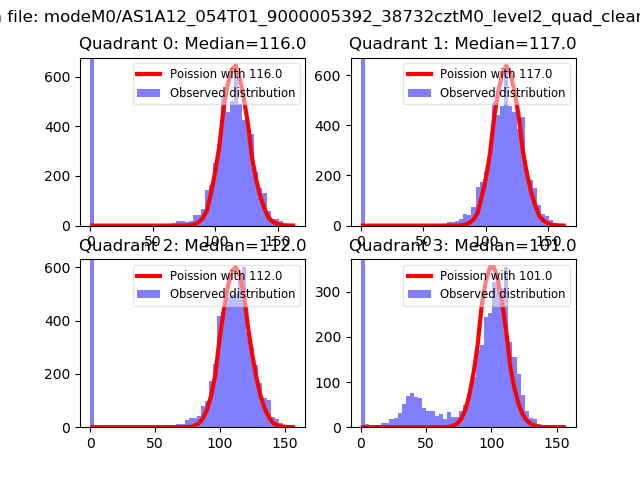
| Comparison with Poisson distribution Blue bars denote a histogram of data divided into 1 sec bins. Red curve is a Poisson curve with rate = median count rate of data. |
 |
 |
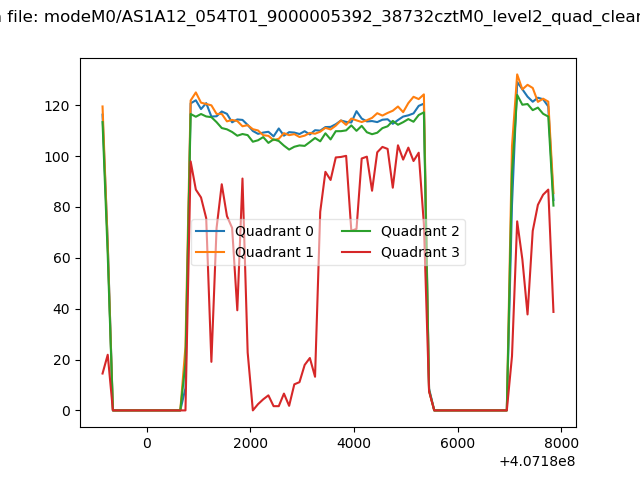
| Quadrant-wise count rates Data is divided into 100 sec bins |
 |
|
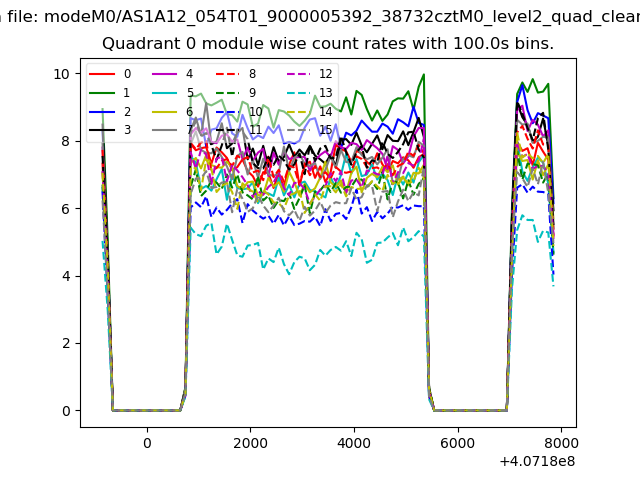
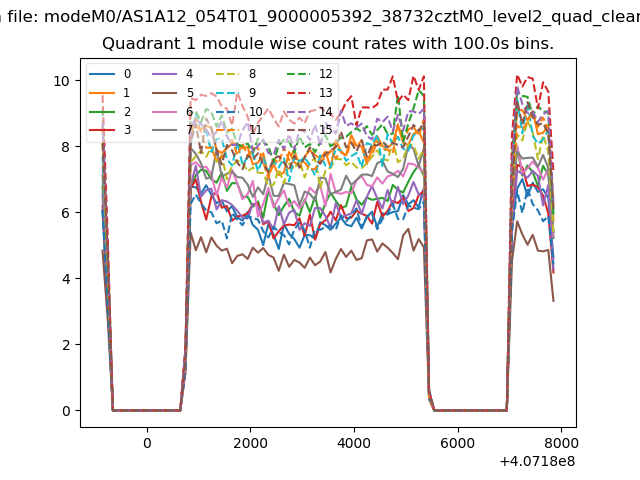
| Module-wise count rates for Quadrant A Data is divided into 100 sec bins |
 |
 |
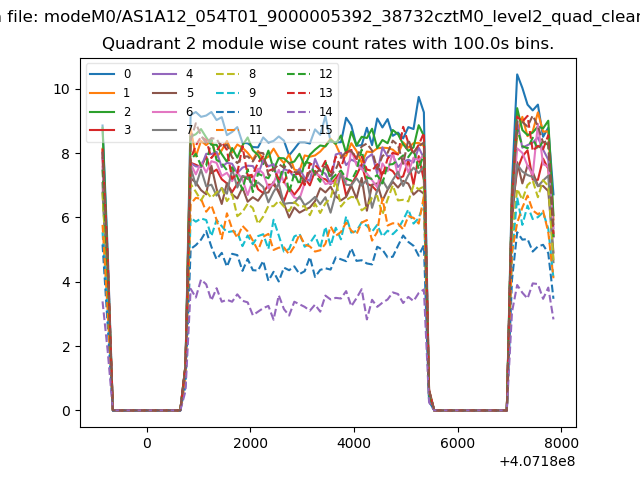
| Module-wise count rates for Quadrant B Data is divided into 100 sec bins |
 |
 |
| Module-wise count rates for Quadrant C Data is divided into 100 sec bins |
 |
 |
| Module-wise count rates for Quadrant D Data is divided into 100 sec bins |
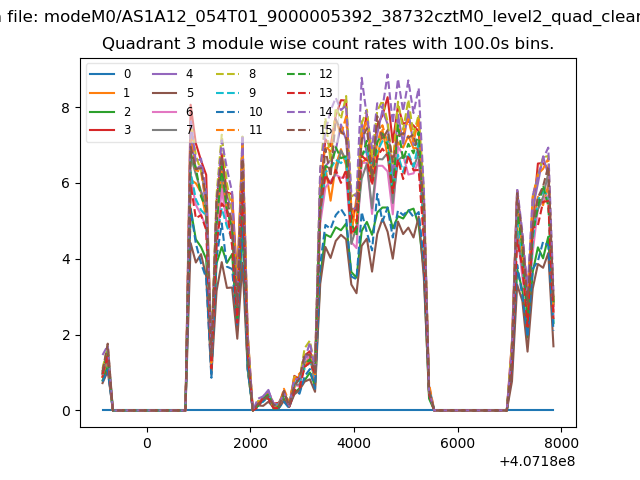 |
 |
| Parameter | Plot |
|---|---|
| CZT HV Monitor | 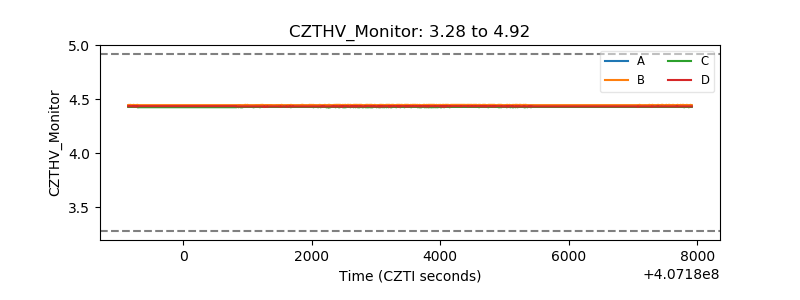 |
| D_VDD | 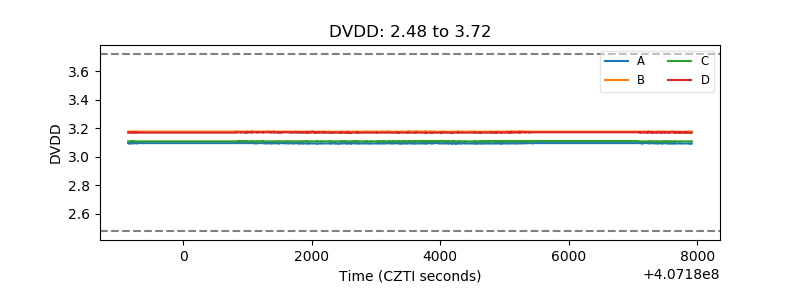 |
| Temperature 1 | 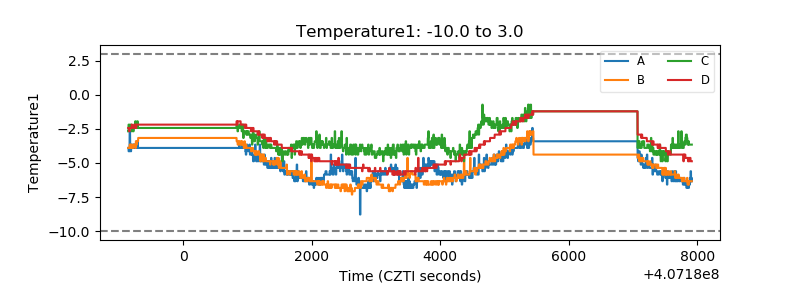 |
| Veto HV Monitor | 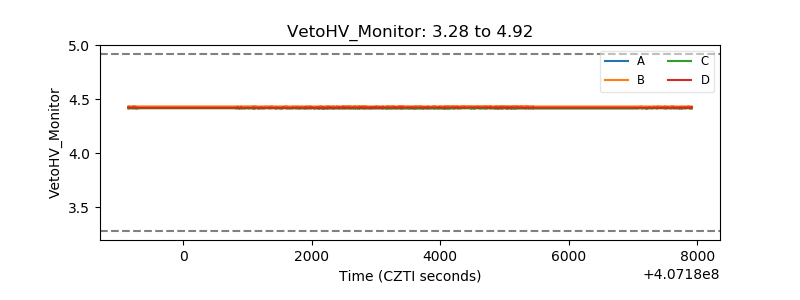 |
| Veto LLD | 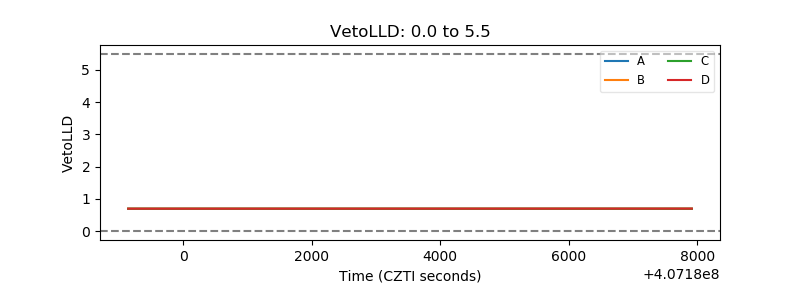 |
| Alpha Counter | 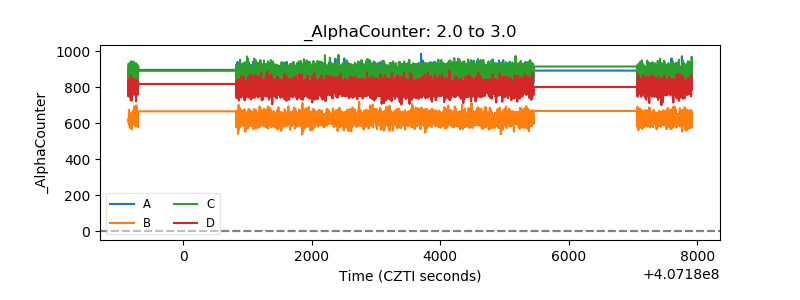 |
| _CPM_Rate | 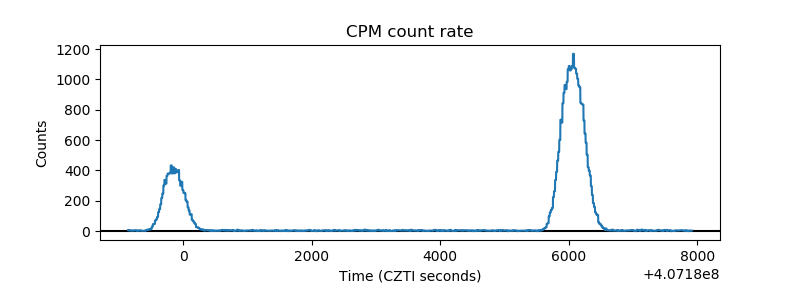 |
| CZT Counter | 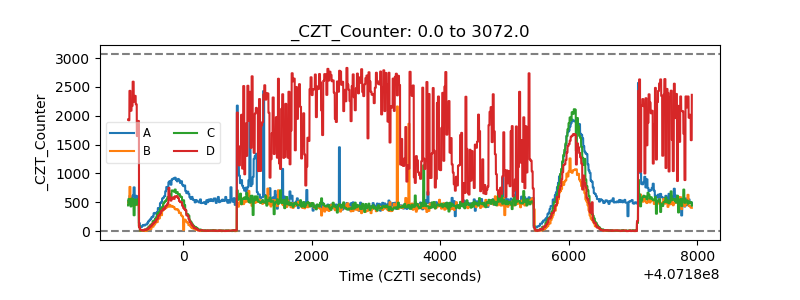 |
| +2.5 Volts monitor | 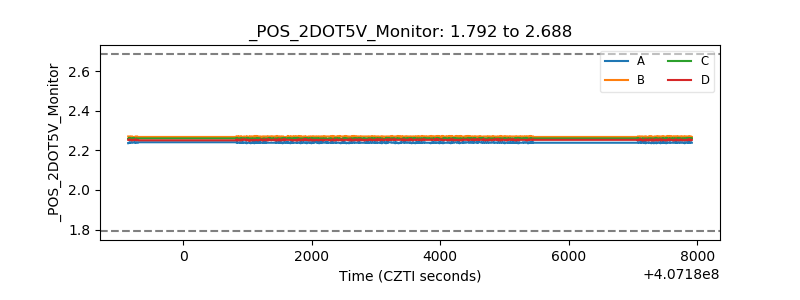 |
| +5 Volts monitor | 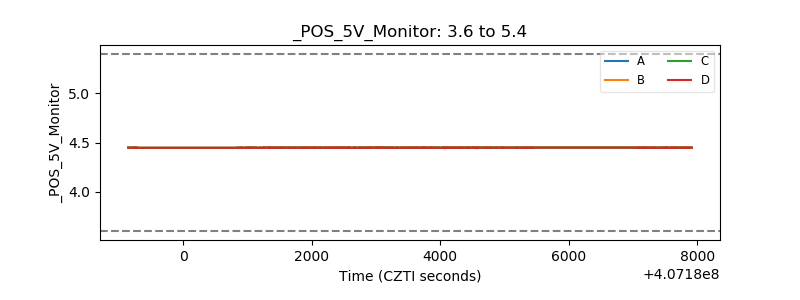 |
| _ROLL_ROT | 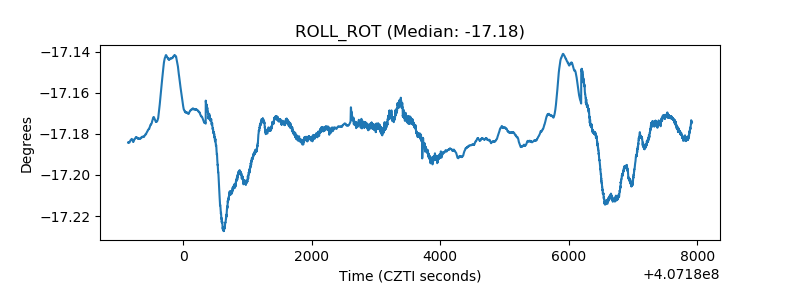 |
| _Roll_DEC | 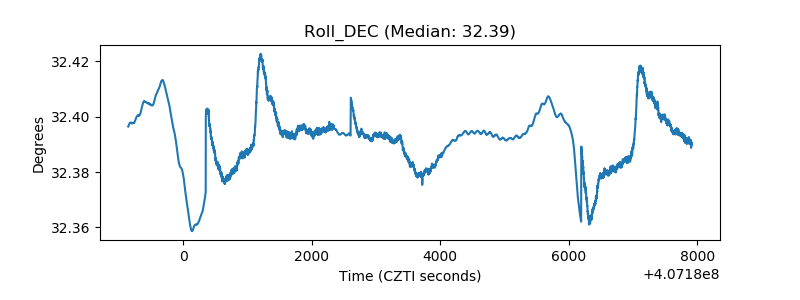 |
| _Roll_RA | 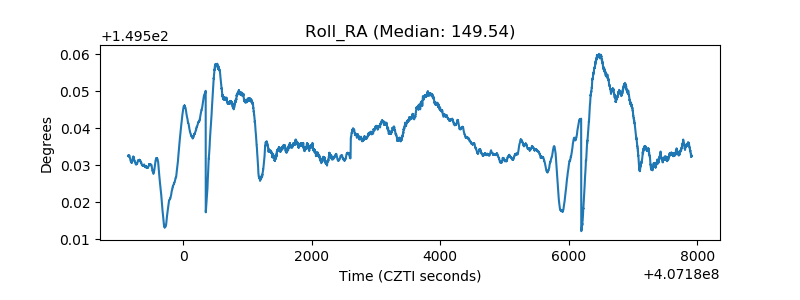 |
| Veto Counter | 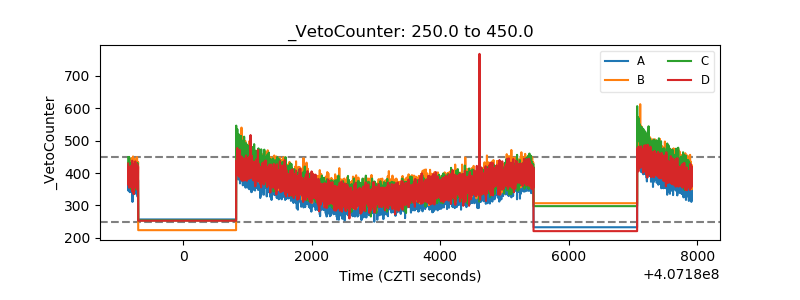 |