| Param | Original file | Final file |
|---|---|---|
| Filename | modeM0/AS1A12_054T01_9000005392_38734cztM0_level2.fits | modeM0/AS1A12_054T01_9000005392_38734cztM0_level2_quad_clean.evt |
| Size (bytes) | 514,944,000 | 88,413,120 |
| Size | 491.1 MB | 84.3 MB |
| Events in quadrant A | 2,906,999 | 637,847 |
| Events in quadrant B | 2,653,700 | 653,122 |
| Events in quadrant C | 2,671,664 | 620,771 |
| Events in quadrant D | 10,406,316 | 384,283 |
| Mode M9 | |||
|---|---|---|---|
| Quadrant | BADHDUFLAG | Total packets | Discarded packets |
| A | 0 | 23 | 0 |
| B | 0 | 23 | 0 |
| C | 0 | 23 | 0 |
| D | 0 | 24 | 0 |
| Mode SS | |||
|---|---|---|---|
| Quadrant | BADHDUFLAG | Total packets | Discarded packets |
| A | 0 | 110 | 0 |
| B | 0 | 110 | 0 |
| C | 0 | 110 | 0 |
| D | 0 | 110 | 0 |
| Mode M0 | |||
|---|---|---|---|
| Quadrant | BADHDUFLAG | Total packets | Discarded packets |
| A | 0 | 12118 | 3 |
| B | 0 | 11534 | 2 |
| C | 0 | 11349 | 2 |
| D | 0 | 34653 | 2 |
| Quadrant | Total seconds | Saturated seconds | Saturation percentage |
|---|---|---|---|
| A | 5442 | 35 | 0.643146% |
| B | 5442 | 15 | 0.275634% |
| C | 5442 | 15 | 0.275634% |
| D | 5442 | 2388 | 43.880926% |
Noise dominated data is calculated using 1-second bins in cleaned event files. If a bin has >2000 counts, and if more than 50% of those come from <1% of pixels, then it is considered to be noise-dominated and hence unusable.
| Quadrant | # 1 sec bins | Bins with >0 counts | Bins with >2000 counts | High rate bins dominated by noise | Noise dominated (total time) | Noise dominated (detector-on time) | Marked lightcurve |
|---|---|---|---|---|---|---|---|
| A | 7205 | 5443 | 25 | 25 | 0.35% | 0.46% | 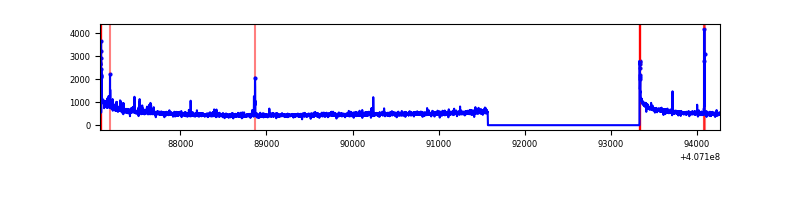 |
| B | 7205 | 5443 | 3 | 3 | 0.04% | 0.06% | 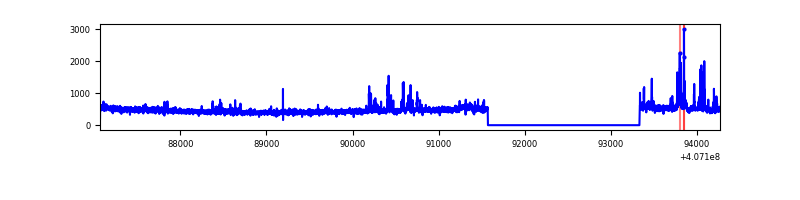 |
| C | 7205 | 5443 | 8 | 8 | 0.11% | 0.15% | 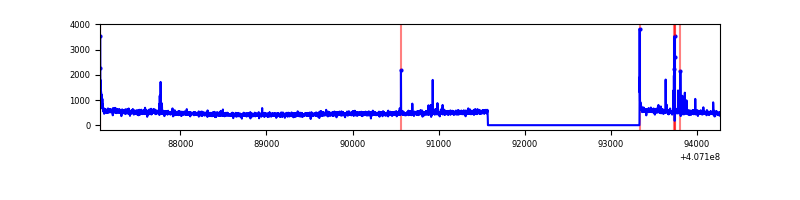 |
| D | 7205 | 5443 | 2309 | 2309 | 32.05% | 42.42% | 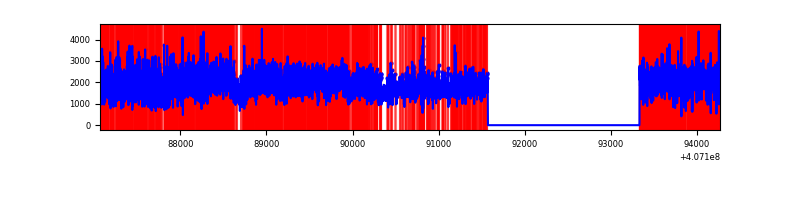 |
Top three noisy pixels from each quadrant. If the there are fewer than three noisy pixels in the level2.evt file, extra rows are filled as -1
| Pixel properties | Quadrant properties | ||||||
|---|---|---|---|---|---|---|---|
| Quadrant | DetID | PixID | Counts | Sigma | Mean | Median | Sigma |
| A | 10 | 83 | 386745 | 3098.02 | 616 | 605 | 124.6 |
| A | 0 | 8 | 68679 | 546.16 | 616 | 605 | 124.6 |
| A | 9 | 143 | 32738 | 257.8 | 616 | 605 | 124.6 |
| B | 5 | 184 | 148285 | 1231.36 | 617 | 602 | 119.9 |
| B | 4 | 251 | 33705 | 276.01 | 617 | 602 | 119.9 |
| B | 4 | 171 | 25366 | 206.48 | 617 | 602 | 119.9 |
| C | 15 | 214 | 225521 | 1581.93 | 604 | 608 | 142.2 |
| C | 14 | 254 | 35815 | 247.63 | 604 | 608 | 142.2 |
| C | 0 | 10 | 33844 | 233.77 | 604 | 608 | 142.2 |
| D | 2 | 16 | 7527765 | 56108.48 | 543 | 527 | 134.2 |
| D | 12 | 235 | 261804 | 1947.57 | 543 | 527 | 134.2 |
| D | 10 | 118 | 142388 | 1057.44 | 543 | 527 | 134.2 |
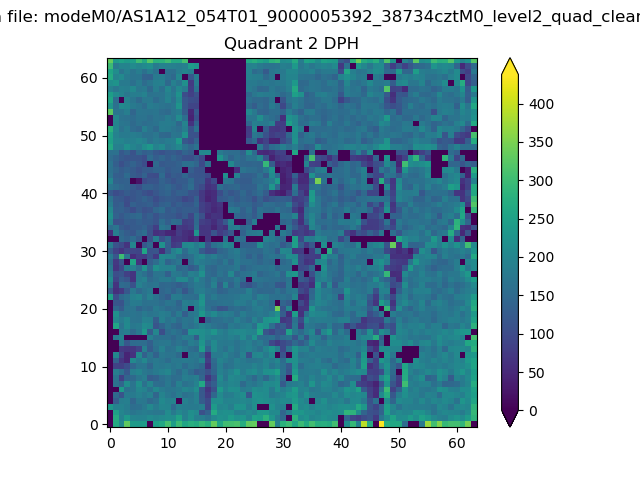
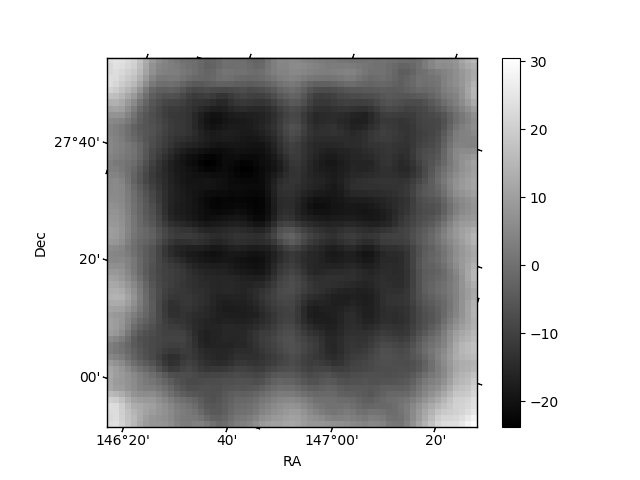
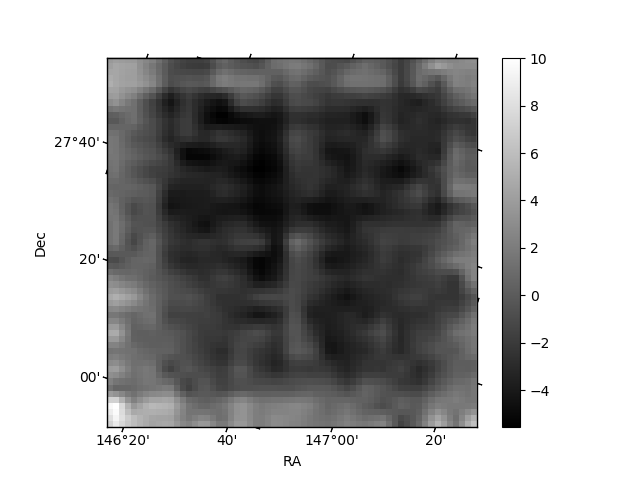
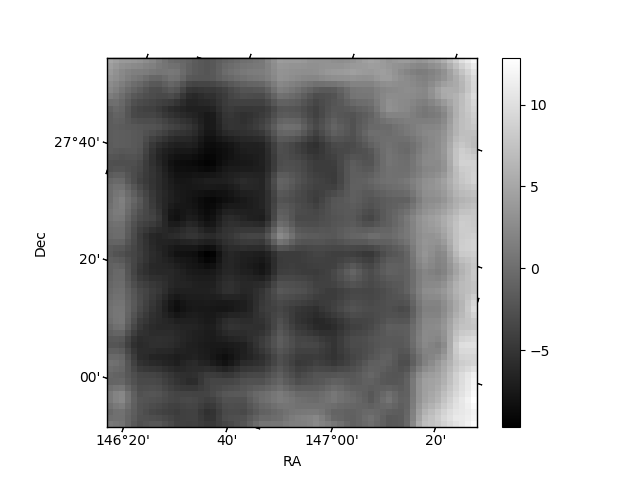
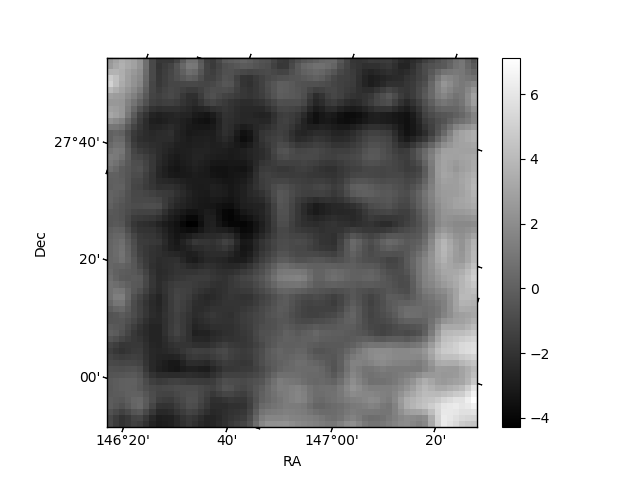
Histogram calculated using DETX and DETY for each event in the final _common_clean file
| Quadrant A | 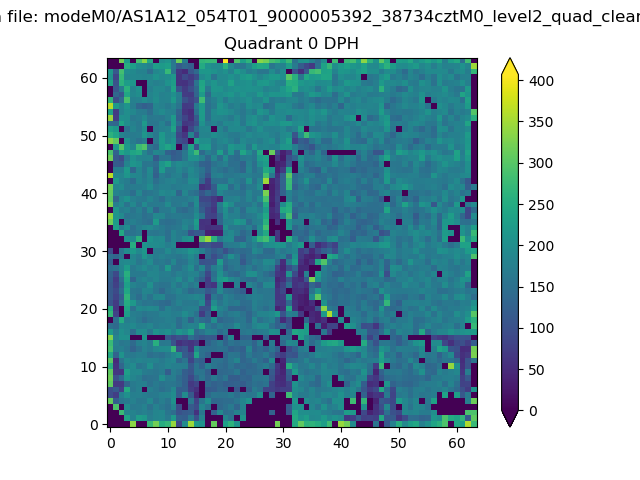 |
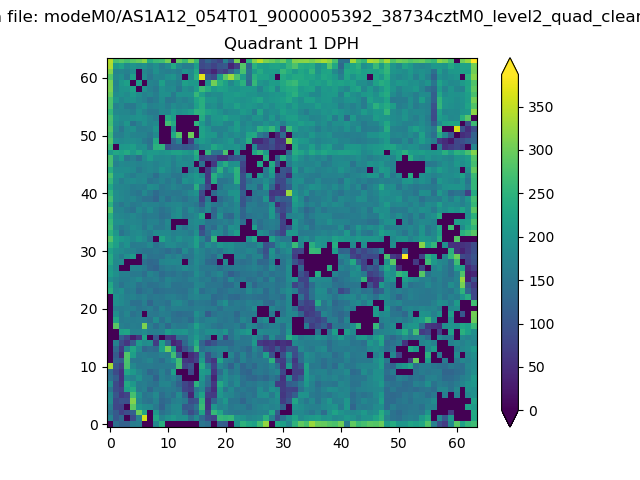 |
Quadrant B |
|---|---|---|---|
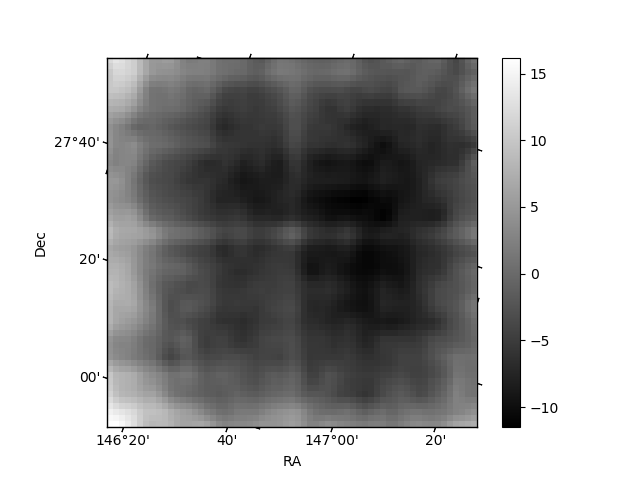
| Quadrant D | 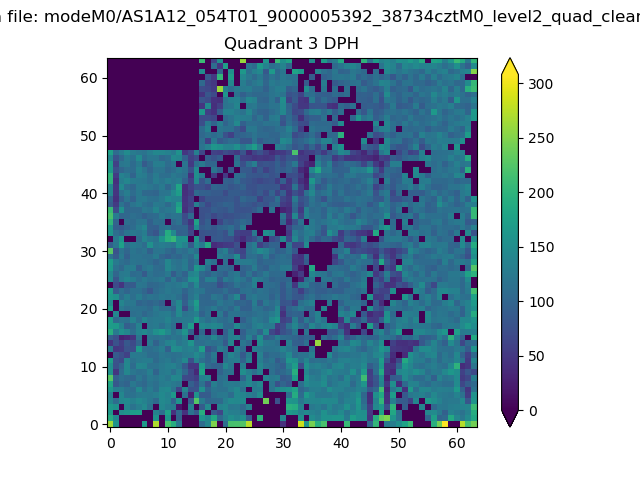 |
 |
Quadrant C |
| Plot type | Count rate plots | Images |
|---|---|---|
| Comparison with Poisson distribution Blue bars denote a histogram of data divided into 1 sec bins. Red curve is a Poisson curve with rate = median count rate of data. |
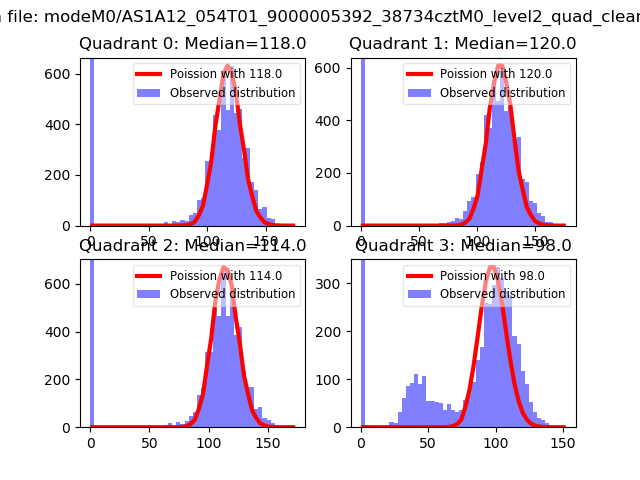 |
 |
| Quadrant-wise count rates Data is divided into 100 sec bins |
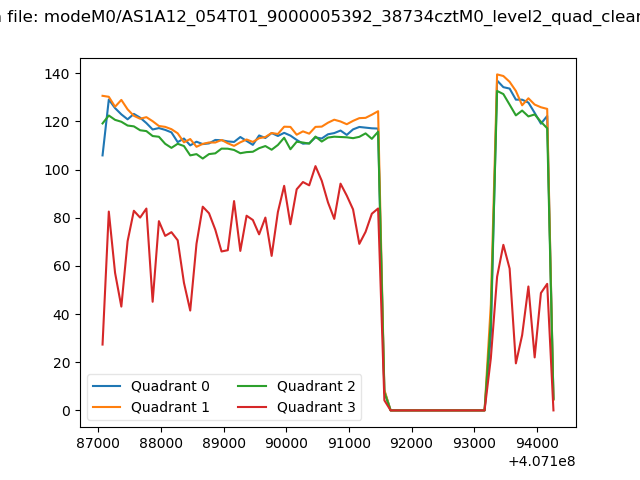 |
|
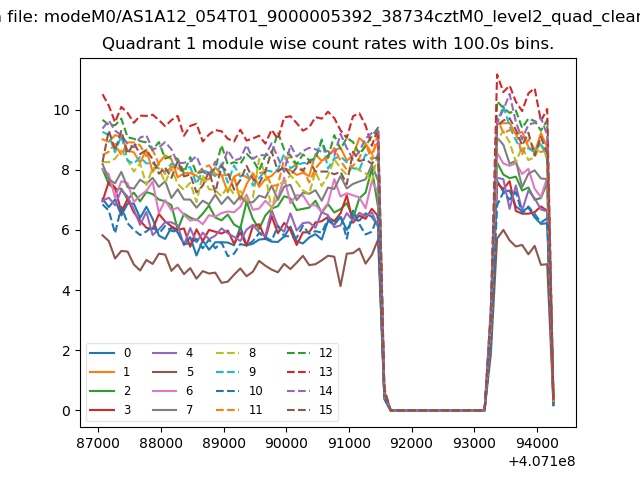
| Module-wise count rates for Quadrant A Data is divided into 100 sec bins |
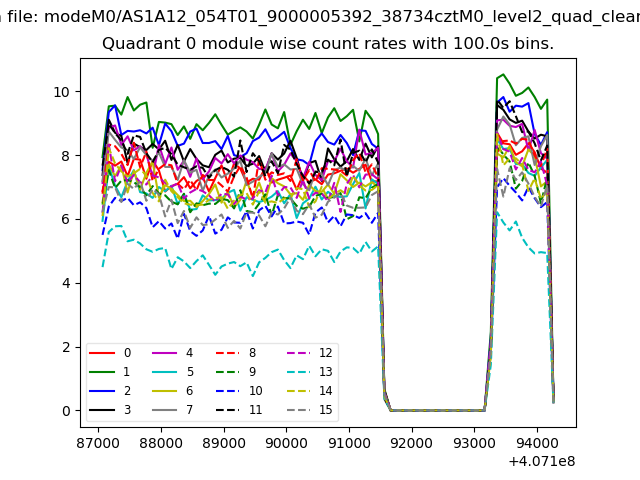 |
 |
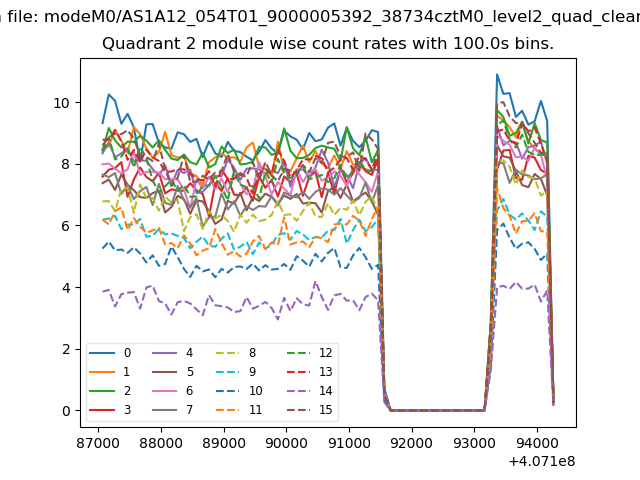
| Module-wise count rates for Quadrant B Data is divided into 100 sec bins |
 |
 |
| Module-wise count rates for Quadrant C Data is divided into 100 sec bins |
 |
 |
| Module-wise count rates for Quadrant D Data is divided into 100 sec bins |
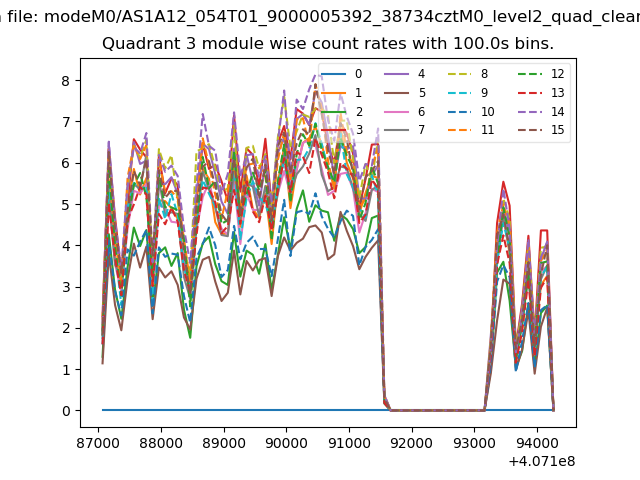 |
 |
| Parameter | Plot |
|---|---|
| CZT HV Monitor | 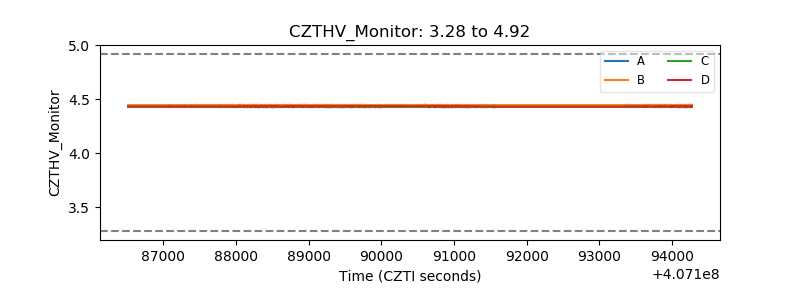 |
| D_VDD | 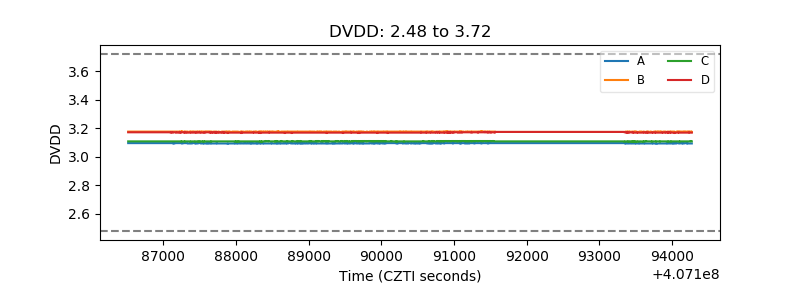 |
| Temperature 1 | 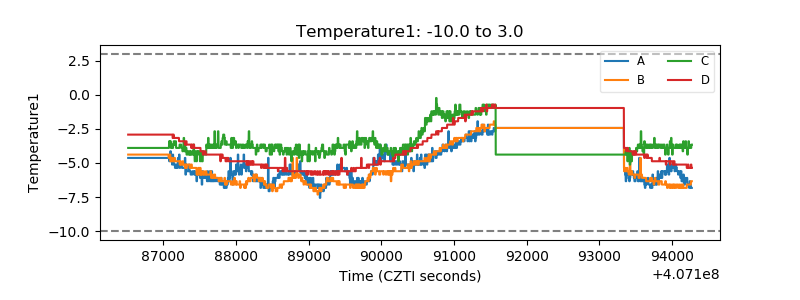 |
| Veto HV Monitor | 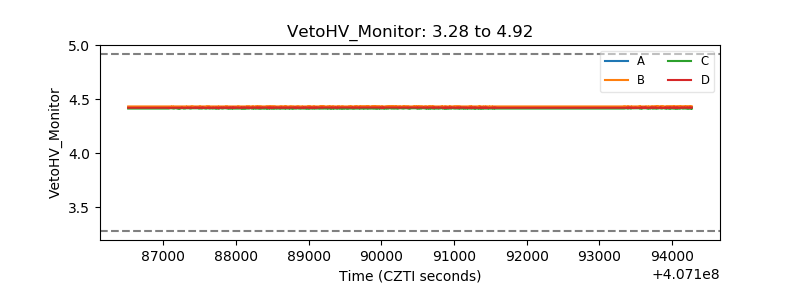 |
| Veto LLD | 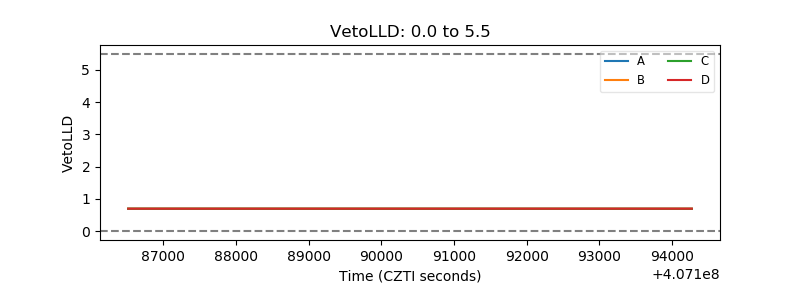 |
| Alpha Counter | 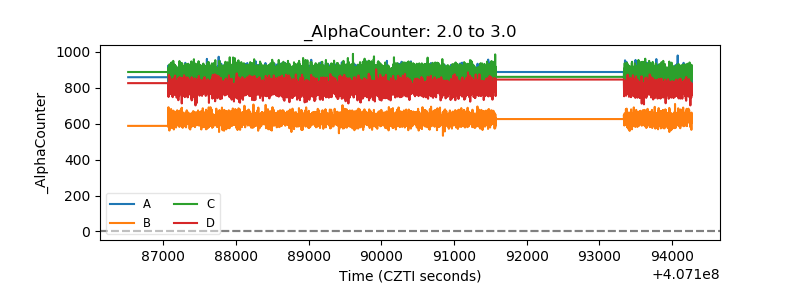 |
| _CPM_Rate | 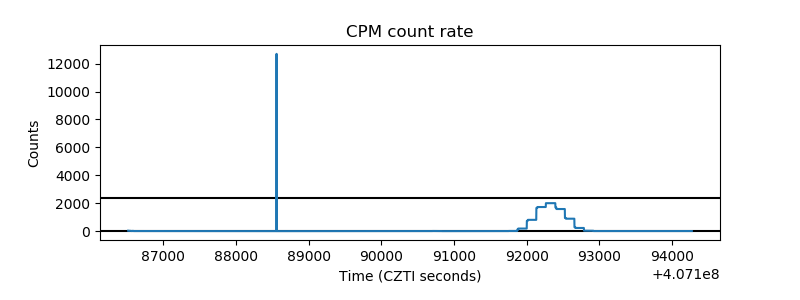 |
| CZT Counter | 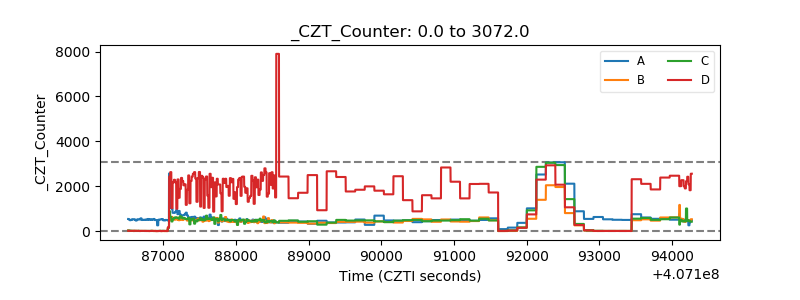 |
| +2.5 Volts monitor | 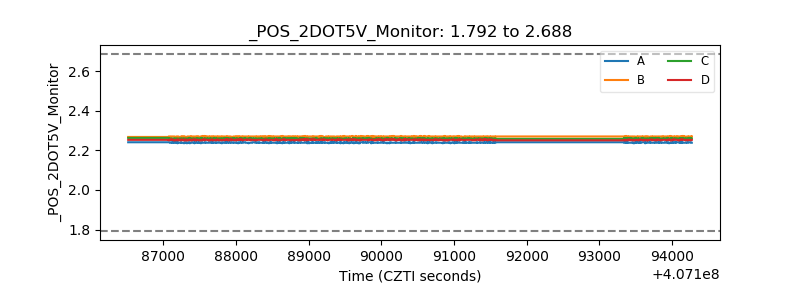 |
| +5 Volts monitor | 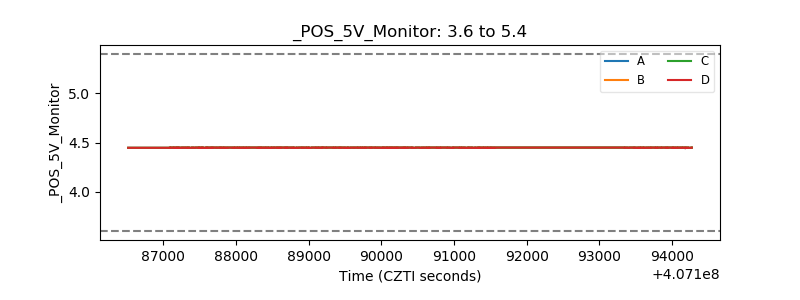 |
| _ROLL_ROT | 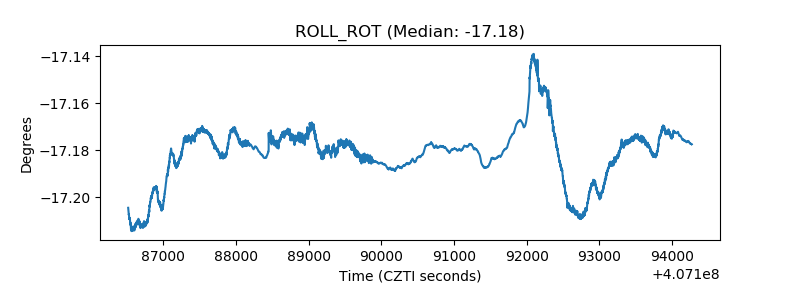 |
| _Roll_DEC | 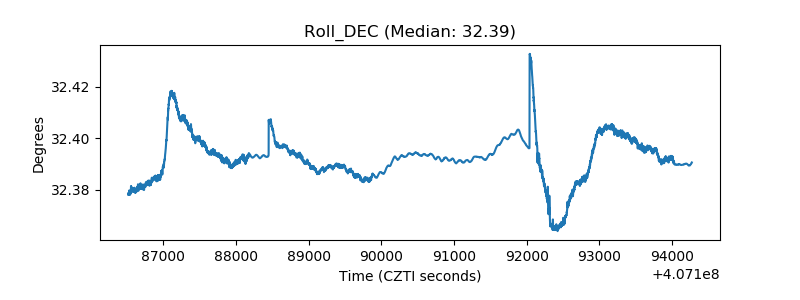 |
| _Roll_RA | 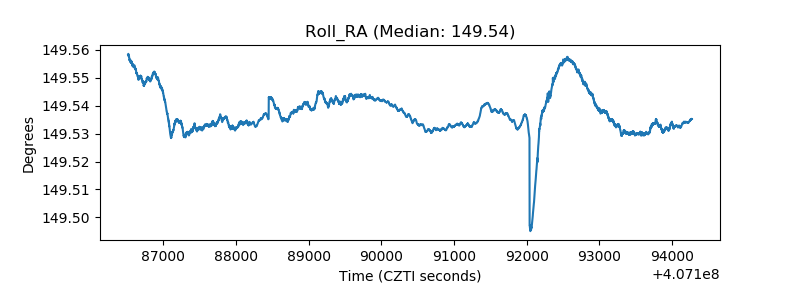 |
| Veto Counter | 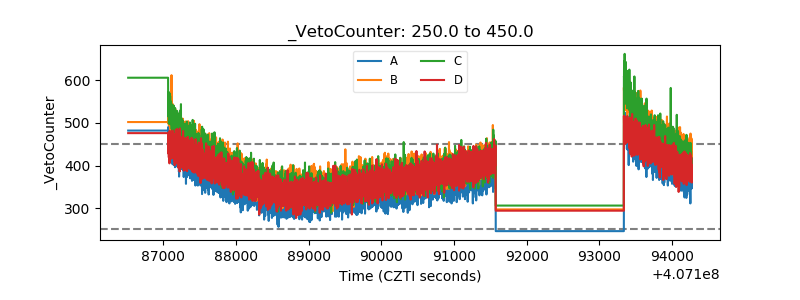 |