| Param | Original file | Final file |
|---|---|---|
| Filename | modeM0/AS1A12_054T01_9000005392_38735cztM0_level2.fits | modeM0/AS1A12_054T01_9000005392_38735cztM0_level2_quad_clean.evt |
| Size (bytes) | 529,470,720 | 86,019,840 |
| Size | 504.9 MB | 82.0 MB |
| Events in quadrant A | 3,088,737 | 622,908 |
| Events in quadrant B | 2,683,226 | 656,727 |
| Events in quadrant C | 3,019,950 | 609,750 |
| Events in quadrant D | 10,399,822 | 347,487 |
| Mode M9 | |||
|---|---|---|---|
| Quadrant | BADHDUFLAG | Total packets | Discarded packets |
| A | 0 | 30 | 0 |
| B | 0 | 30 | 0 |
| C | 0 | 30 | 0 |
| D | 0 | 31 | 0 |
| Mode SS | |||
|---|---|---|---|
| Quadrant | BADHDUFLAG | Total packets | Discarded packets |
| A | 0 | 108 | 0 |
| B | 0 | 108 | 0 |
| C | 0 | 108 | 0 |
| D | 0 | 108 | 0 |
| Mode M0 | |||
|---|---|---|---|
| Quadrant | BADHDUFLAG | Total packets | Discarded packets |
| A | 0 | 12406 | 3 |
| B | 0 | 11412 | 2 |
| C | 0 | 12136 | 2 |
| D | 0 | 34498 | 2 |
| Quadrant | Total seconds | Saturated seconds | Saturation percentage |
|---|---|---|---|
| A | 5247 | 142 | 2.706308% |
| B | 5247 | 47 | 0.895750% |
| C | 5247 | 112 | 2.134553% |
| D | 5247 | 2469 | 47.055460% |
Noise dominated data is calculated using 1-second bins in cleaned event files. If a bin has >2000 counts, and if more than 50% of those come from <1% of pixels, then it is considered to be noise-dominated and hence unusable.
| Quadrant | # 1 sec bins | Bins with >0 counts | Bins with >2000 counts | High rate bins dominated by noise | Noise dominated (total time) | Noise dominated (detector-on time) | Marked lightcurve |
|---|---|---|---|---|---|---|---|
| A | 7129 | 5248 | 102 | 102 | 1.43% | 1.94% | 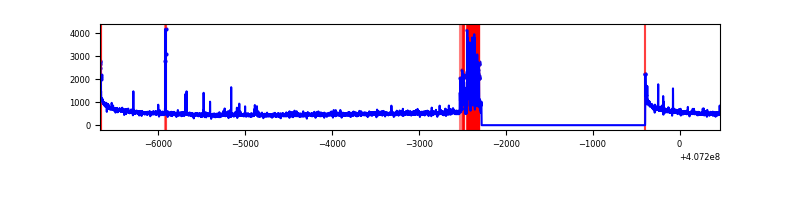 |
| B | 7129 | 5248 | 21 | 21 | 0.29% | 0.40% | 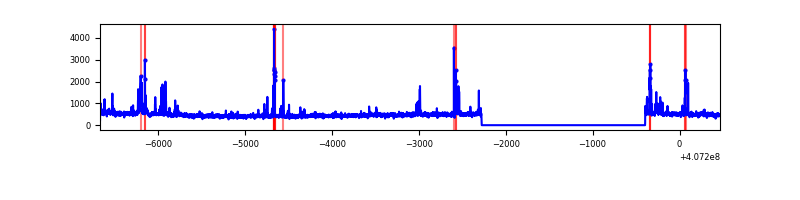 |
| C | 7129 | 5248 | 101 | 101 | 1.42% | 1.92% | 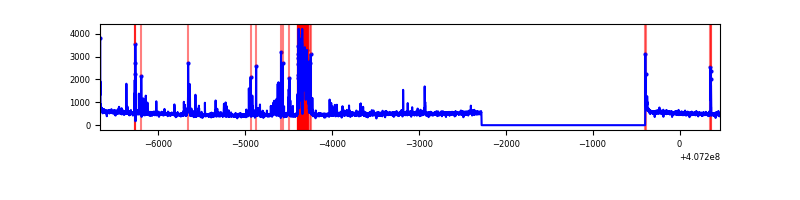 |
| D | 7129 | 5248 | 2504 | 2504 | 35.12% | 47.71% | 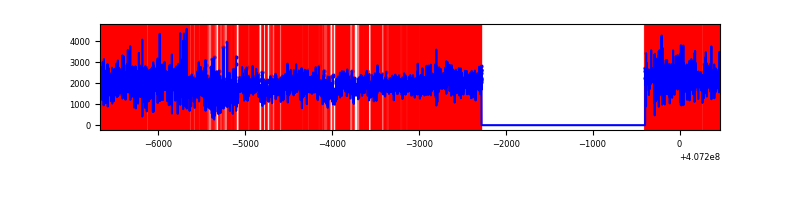 |
Top three noisy pixels from each quadrant. If the there are fewer than three noisy pixels in the level2.evt file, extra rows are filled as -1
| Pixel properties | Quadrant properties | ||||||
|---|---|---|---|---|---|---|---|
| Quadrant | DetID | PixID | Counts | Sigma | Mean | Median | Sigma |
| A | 10 | 83 | 384298 | 3139.97 | 598 | 586 | 122.2 |
| A | 0 | 8 | 328830 | 2686.07 | 598 | 586 | 122.2 |
| A | 9 | 143 | 40274 | 324.77 | 598 | 586 | 122.2 |
| B | 4 | 171 | 164286 | 1389.57 | 605 | 589 | 117.8 |
| B | 5 | 184 | 93654 | 790.0 | 605 | 589 | 117.8 |
| B | 4 | 251 | 27718 | 230.29 | 605 | 589 | 117.8 |
| C | 14 | 254 | 476660 | 3452.91 | 587 | 592 | 137.9 |
| C | 15 | 214 | 214547 | 1551.81 | 587 | 592 | 137.9 |
| C | 0 | 10 | 28882 | 205.18 | 587 | 592 | 137.9 |
| D | 2 | 16 | 7054968 | 55020.86 | 516 | 500 | 128.2 |
| D | 12 | 235 | 516528 | 4024.73 | 516 | 500 | 128.2 |
| D | 2 | 249 | 334747 | 2606.94 | 516 | 500 | 128.2 |
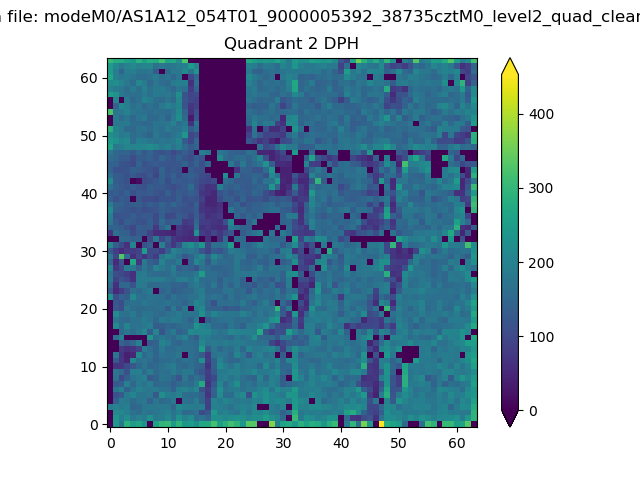
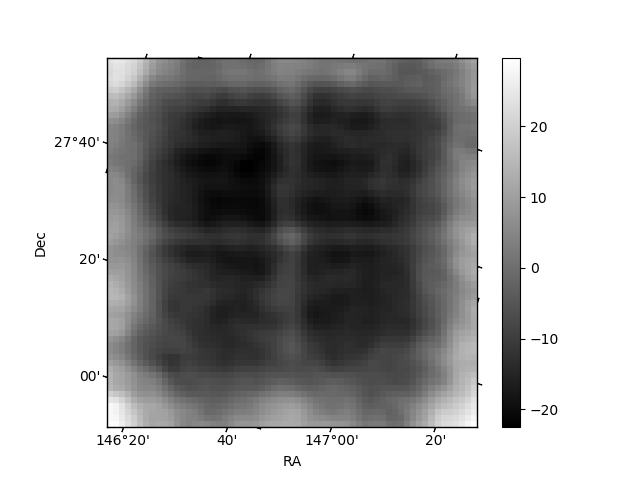
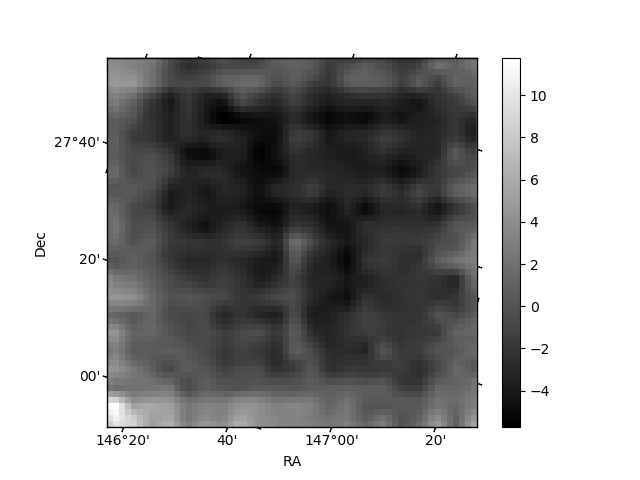
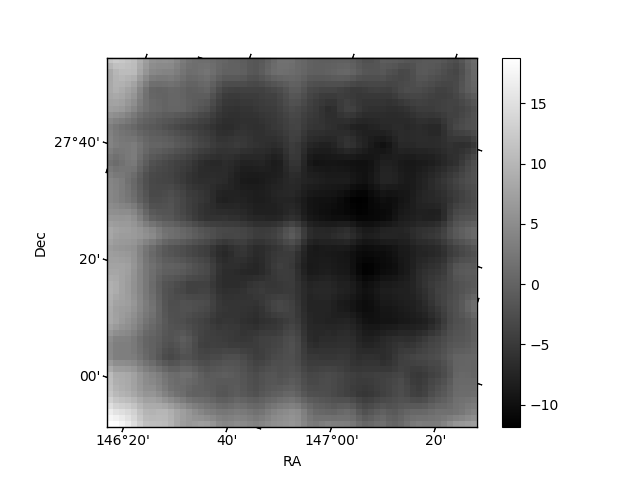
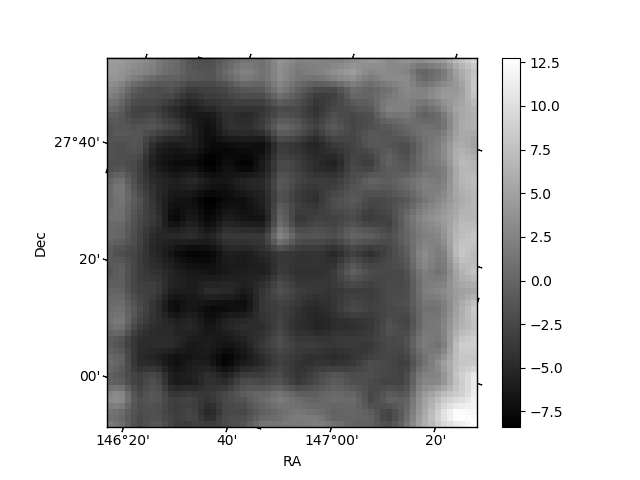
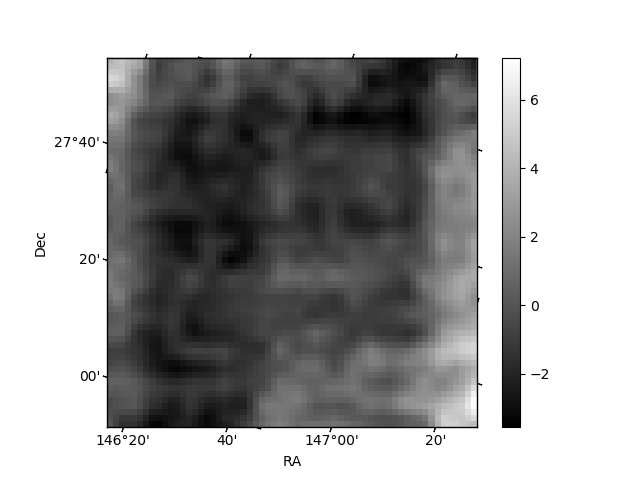
Histogram calculated using DETX and DETY for each event in the final _common_clean file
| Quadrant A | 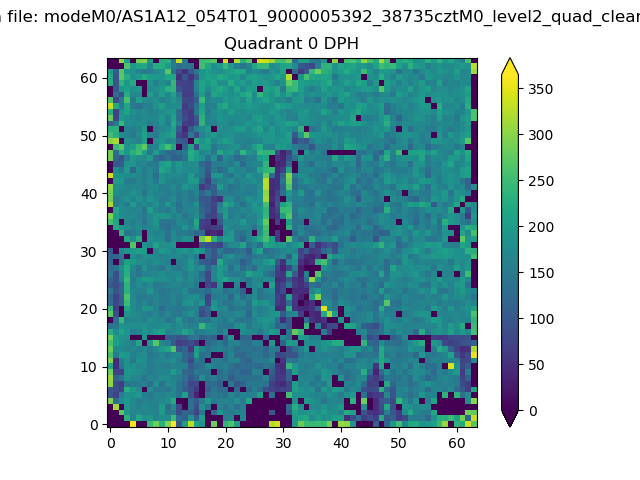 |
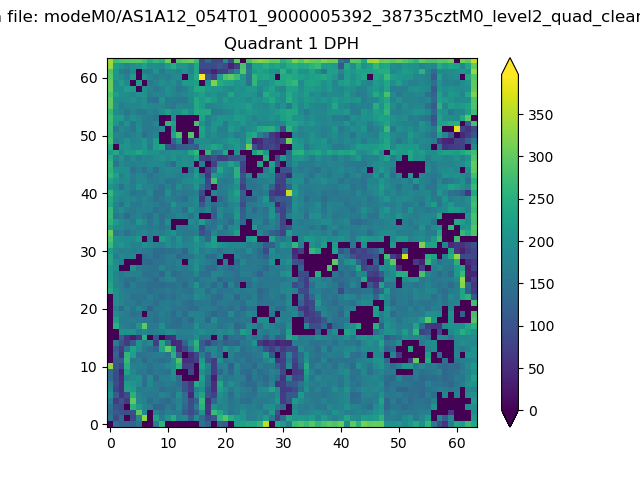 |
Quadrant B |
|---|---|---|---|
| Quadrant D | 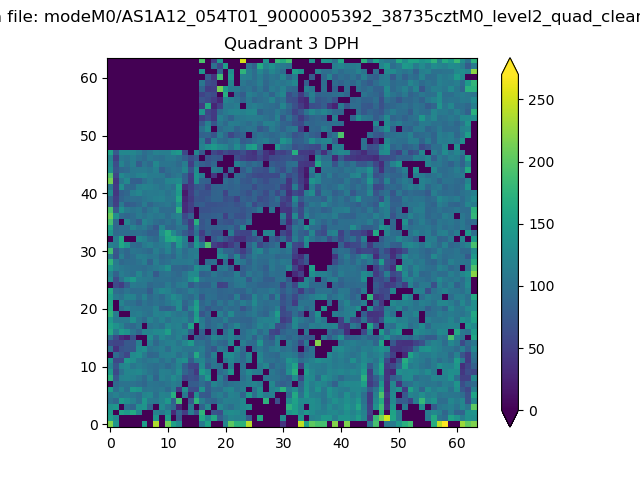 |
 |
Quadrant C |
| Plot type | Count rate plots | Images |
|---|---|---|
| Comparison with Poisson distribution Blue bars denote a histogram of data divided into 1 sec bins. Red curve is a Poisson curve with rate = median count rate of data. |
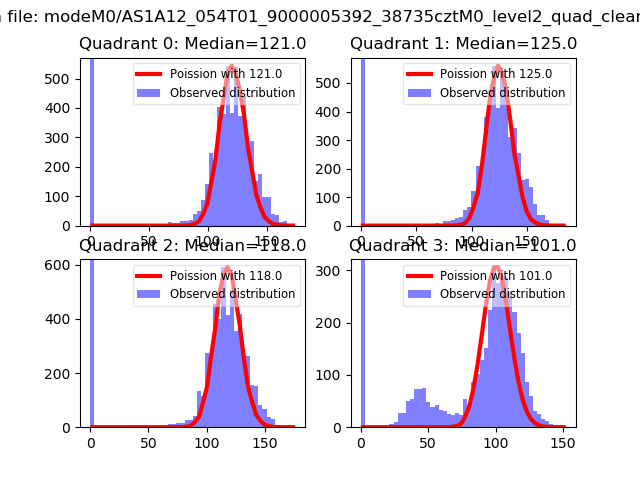 |
 |
| Quadrant-wise count rates Data is divided into 100 sec bins |
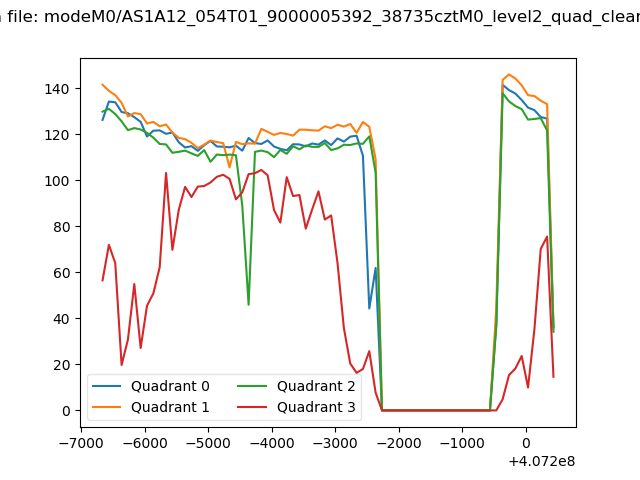 |
|
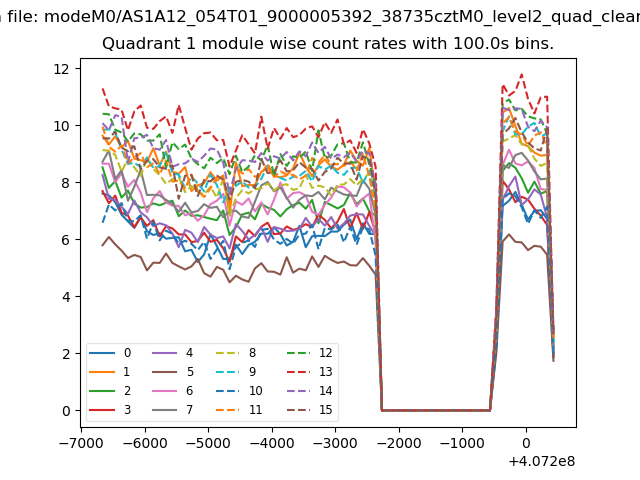
| Module-wise count rates for Quadrant A Data is divided into 100 sec bins |
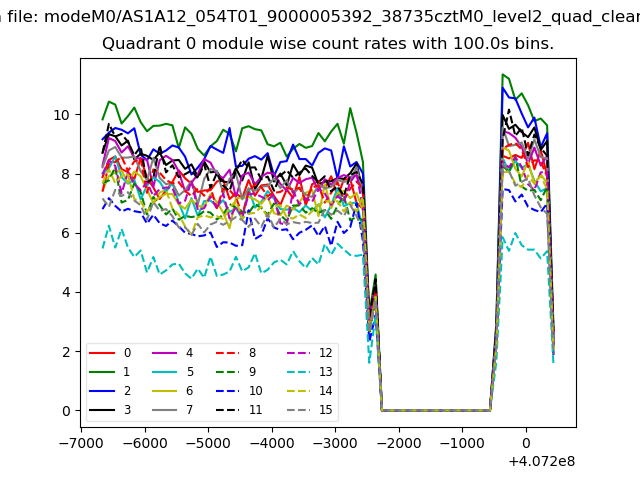 |
 |
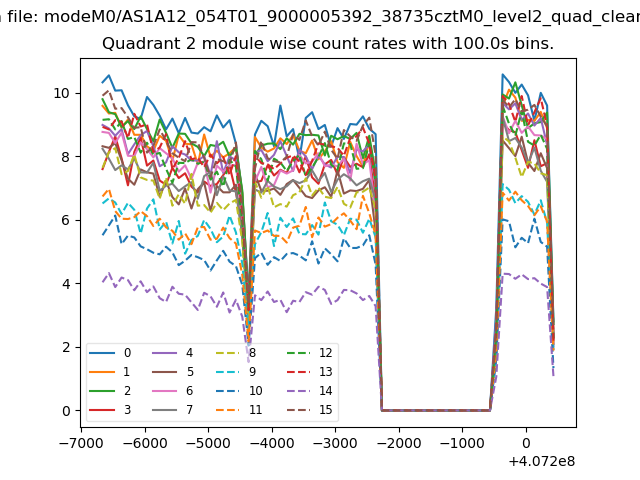
| Module-wise count rates for Quadrant B Data is divided into 100 sec bins |
 |
 |
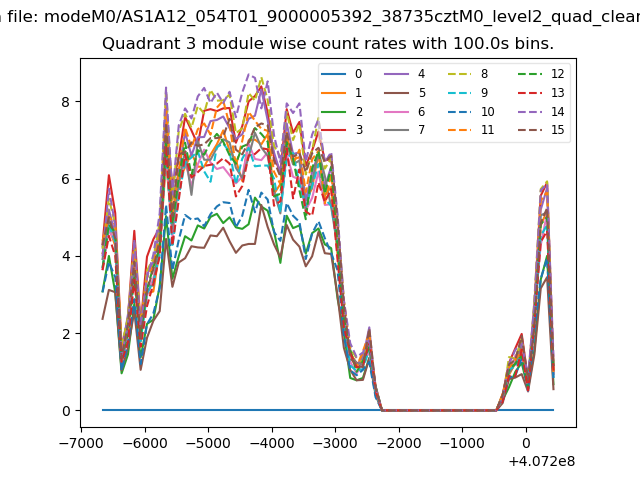
| Module-wise count rates for Quadrant C Data is divided into 100 sec bins |
 |
 |
| Module-wise count rates for Quadrant D Data is divided into 100 sec bins |
 |
 |
| Parameter | Plot |
|---|---|
| CZT HV Monitor | 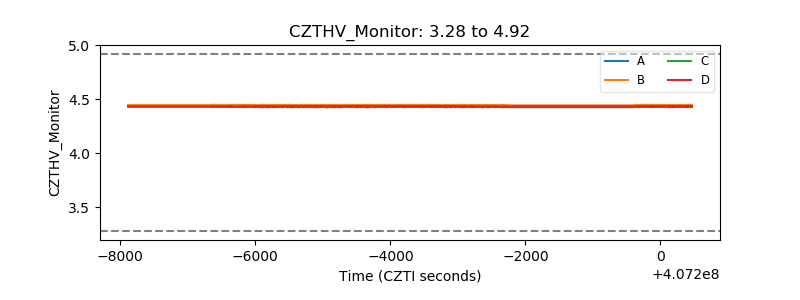 |
| D_VDD | 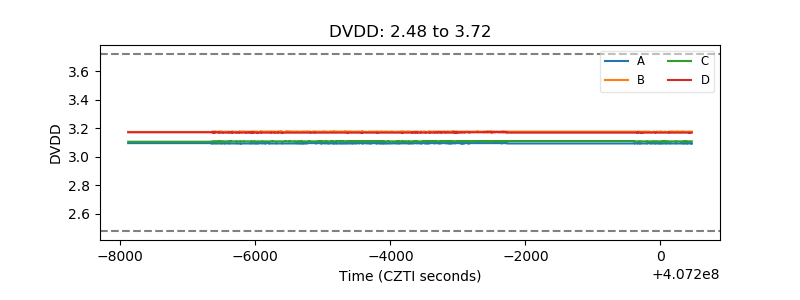 |
| Temperature 1 | 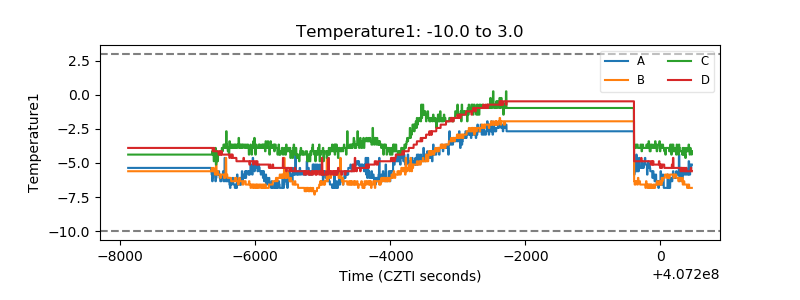 |
| Veto HV Monitor | 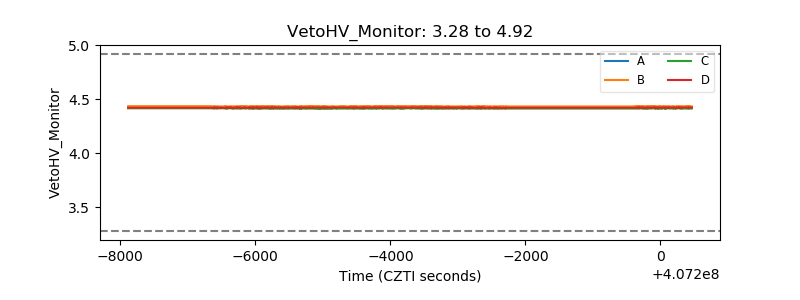 |
| Veto LLD | 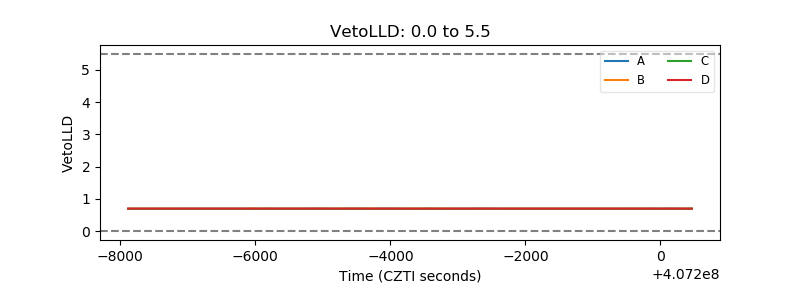 |
| Alpha Counter | 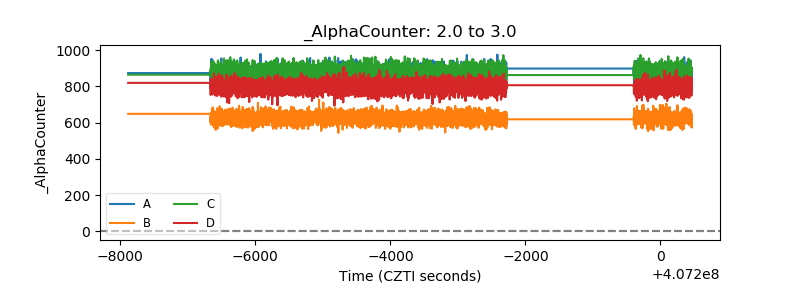 |
| _CPM_Rate | 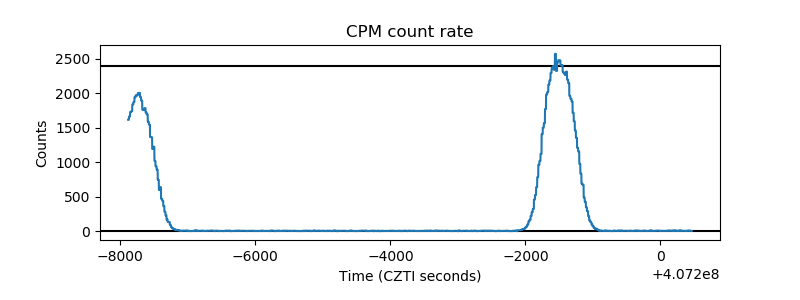 |
| CZT Counter | 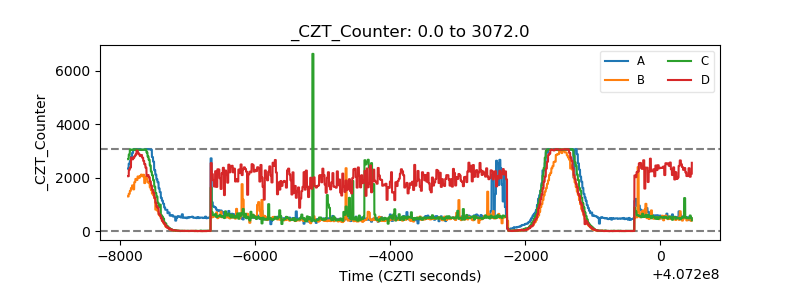 |
| +2.5 Volts monitor | 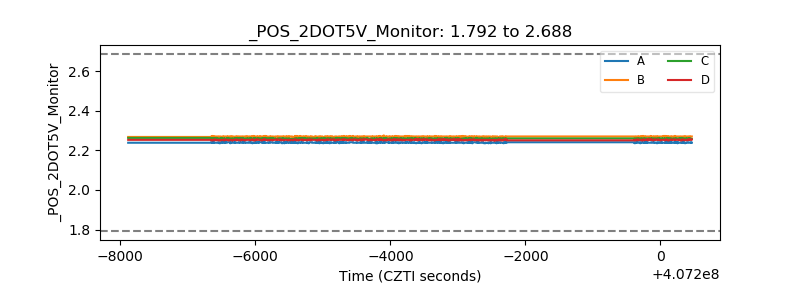 |
| +5 Volts monitor | 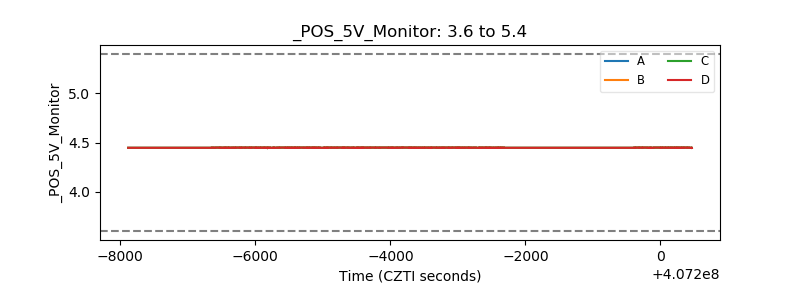 |
| _ROLL_ROT | 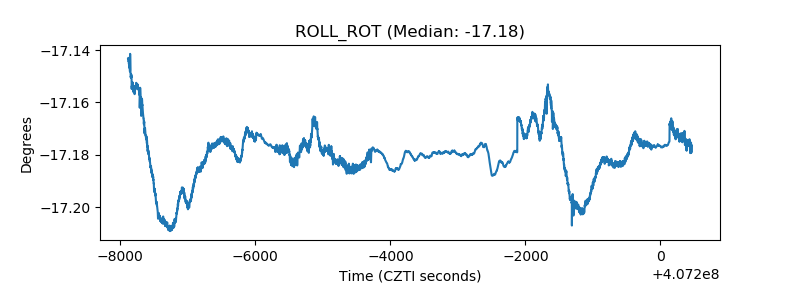 |
| _Roll_DEC | 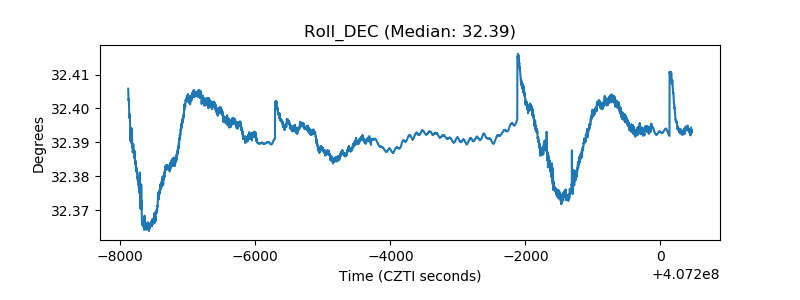 |
| _Roll_RA | 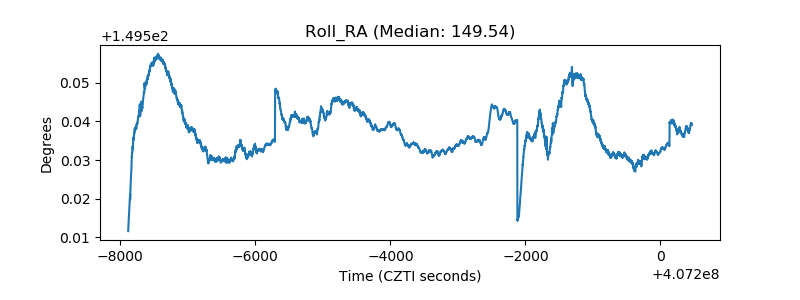 |
| Veto Counter | 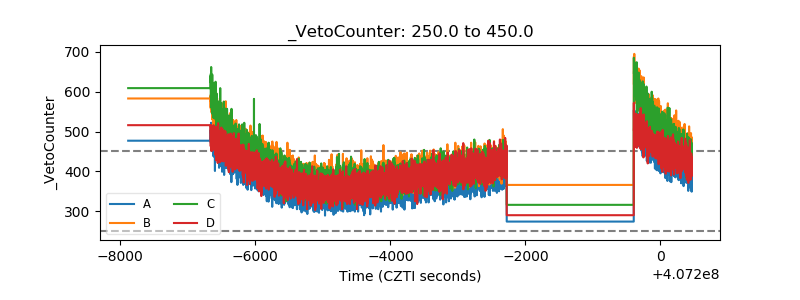 |