| Param | Original file | Final file |
|---|---|---|
| Filename | modeM0/AS1A12_054T01_9000005392_38736cztM0_level2.fits | modeM0/AS1A12_054T01_9000005392_38736cztM0_level2_quad_clean.evt |
| Size (bytes) | 551,085,120 | 90,115,200 |
| Size | 525.6 MB | 85.9 MB |
| Events in quadrant A | 4,294,366 | 635,746 |
| Events in quadrant B | 2,629,247 | 697,692 |
| Events in quadrant C | 2,959,837 | 648,419 |
| Events in quadrant D | 10,097,997 | 369,636 |
| Mode M9 | |||
|---|---|---|---|
| Quadrant | BADHDUFLAG | Total packets | Discarded packets |
| A | 0 | 26 | 0 |
| B | 0 | 26 | 0 |
| C | 0 | 26 | 0 |
| D | 0 | 27 | 0 |
| Mode SS | |||
|---|---|---|---|
| Quadrant | BADHDUFLAG | Total packets | Discarded packets |
| A | 0 | 110 | 0 |
| B | 0 | 110 | 0 |
| C | 0 | 110 | 0 |
| D | 0 | 110 | 0 |
| Mode M0 | |||
|---|---|---|---|
| Quadrant | BADHDUFLAG | Total packets | Discarded packets |
| A | 0 | 16250 | 3 |
| B | 0 | 11242 | 2 |
| C | 0 | 12033 | 2 |
| D | 0 | 33748 | 2 |
| Quadrant | Total seconds | Saturated seconds | Saturation percentage |
|---|---|---|---|
| A | 5387 | 367 | 6.812697% |
| B | 5387 | 22 | 0.408391% |
| C | 5387 | 54 | 1.002413% |
| D | 5387 | 2359 | 43.790607% |
Noise dominated data is calculated using 1-second bins in cleaned event files. If a bin has >2000 counts, and if more than 50% of those come from <1% of pixels, then it is considered to be noise-dominated and hence unusable.
| Quadrant | # 1 sec bins | Bins with >0 counts | Bins with >2000 counts | High rate bins dominated by noise | Noise dominated (total time) | Noise dominated (detector-on time) | Marked lightcurve |
|---|---|---|---|---|---|---|---|
| A | 7389 | 5388 | 305 | 305 | 4.13% | 5.66% | 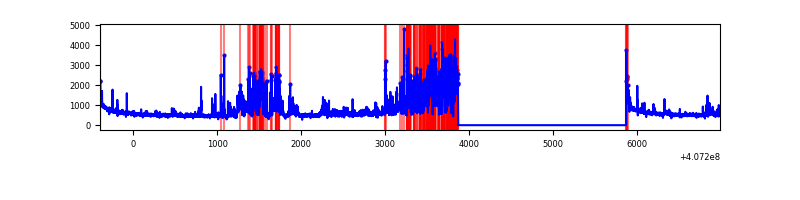 |
| B | 7389 | 5388 | 8 | 8 | 0.11% | 0.15% | 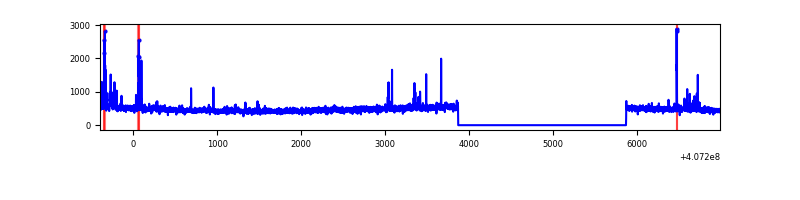 |
| C | 7389 | 5388 | 46 | 46 | 0.62% | 0.85% | 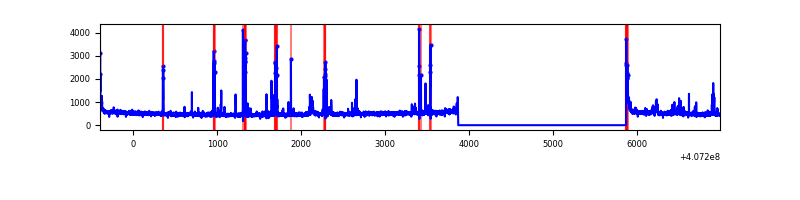 |
| D | 7389 | 5388 | 2213 | 2213 | 29.95% | 41.07% | 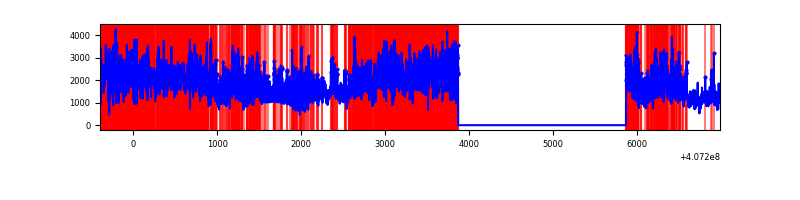 |
Top three noisy pixels from each quadrant. If the there are fewer than three noisy pixels in the level2.evt file, extra rows are filled as -1
| Pixel properties | Quadrant properties | ||||||
|---|---|---|---|---|---|---|---|
| Quadrant | DetID | PixID | Counts | Sigma | Mean | Median | Sigma |
| A | 0 | 8 | 1496758 | 12157.9 | 607 | 597 | 123.1 |
| A | 10 | 83 | 394452 | 3200.49 | 607 | 597 | 123.1 |
| A | 9 | 143 | 40548 | 324.64 | 607 | 597 | 123.1 |
| B | 4 | 171 | 81698 | 678.79 | 630 | 616 | 119.5 |
| B | 5 | 184 | 25404 | 207.52 | 630 | 616 | 119.5 |
| B | 12 | 111 | 14849 | 119.15 | 630 | 616 | 119.5 |
| C | 14 | 254 | 246158 | 1718.3 | 609 | 613 | 142.9 |
| C | 15 | 214 | 222805 | 1554.88 | 609 | 613 | 142.9 |
| C | 0 | 10 | 64839 | 449.45 | 609 | 613 | 142.9 |
| D | 2 | 16 | 4892797 | 39618.6 | 507 | 494 | 123.5 |
| D | 12 | 235 | 2013939 | 16305.18 | 507 | 494 | 123.5 |
| D | 2 | 249 | 470103 | 3802.96 | 507 | 494 | 123.5 |
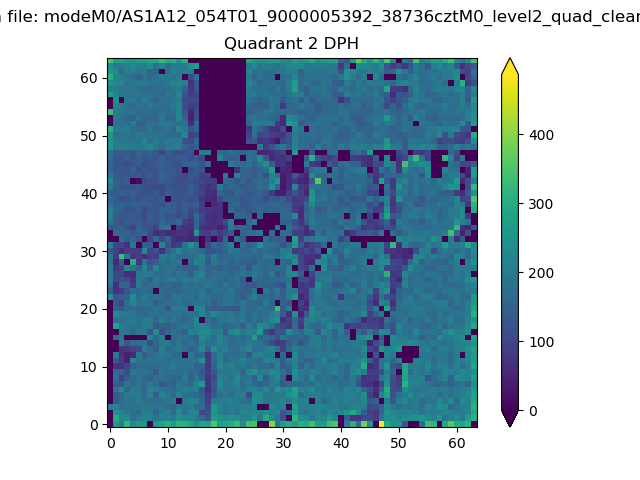
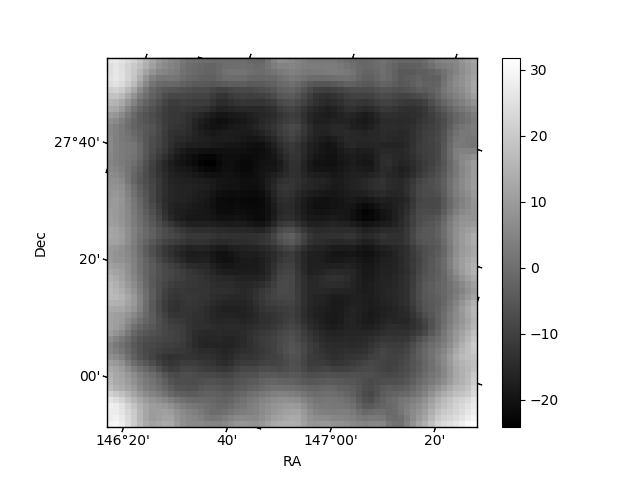
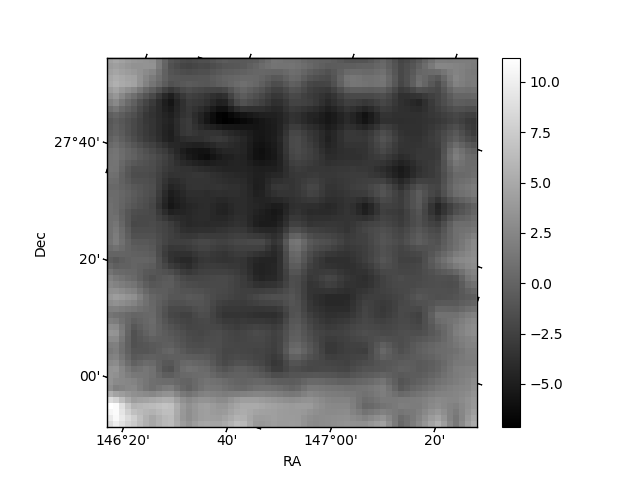
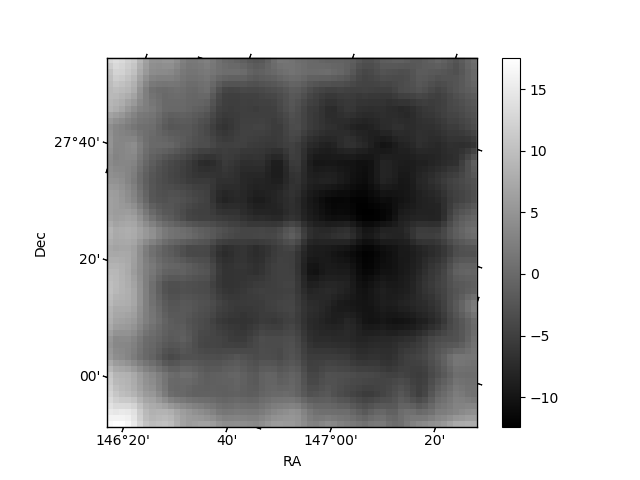
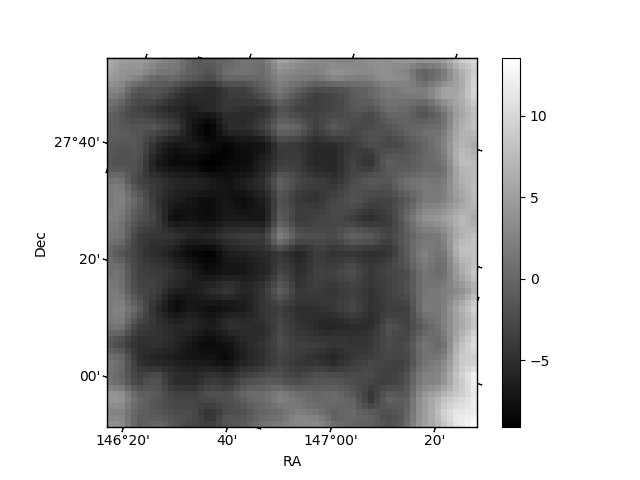
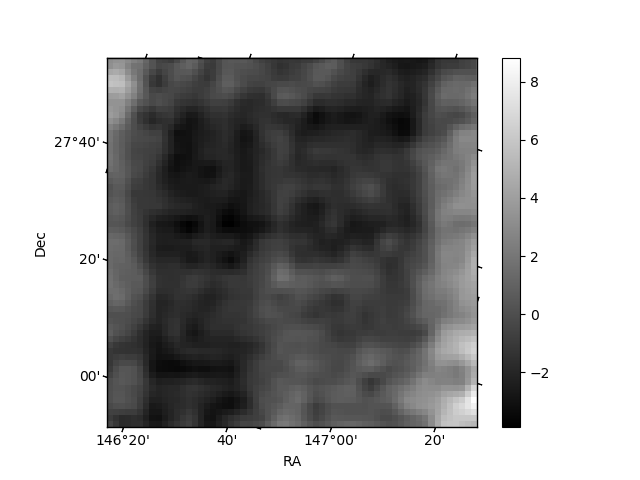
Histogram calculated using DETX and DETY for each event in the final _common_clean file
| Quadrant A | 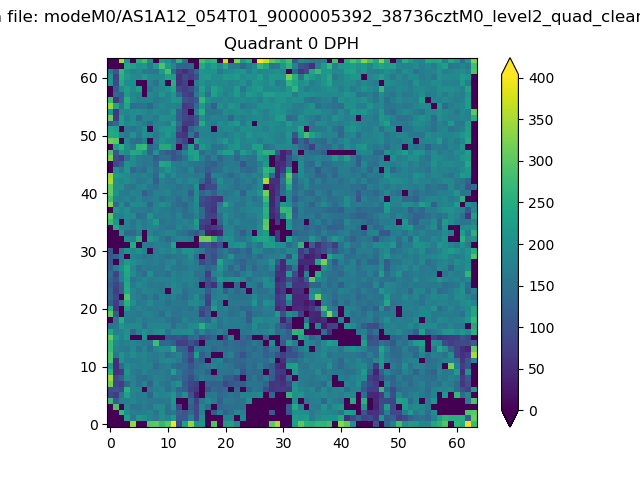 |
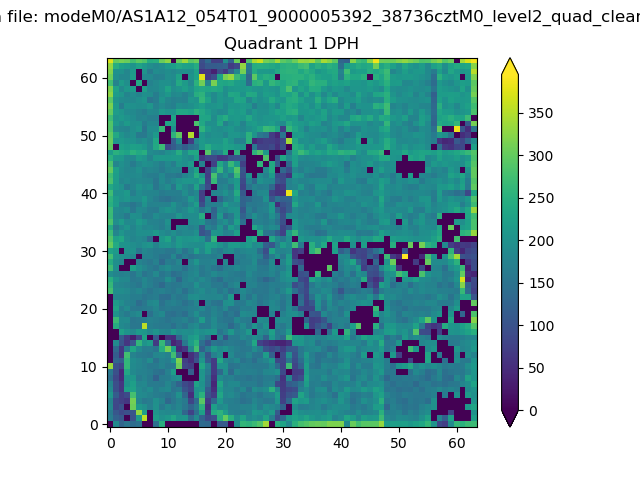 |
Quadrant B |
|---|---|---|---|
| Quadrant D | 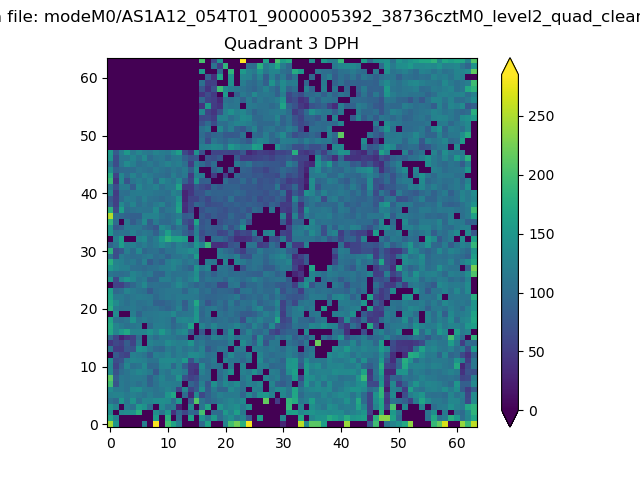 |
 |
Quadrant C |
| Plot type | Count rate plots | Images |
|---|---|---|
| Comparison with Poisson distribution Blue bars denote a histogram of data divided into 1 sec bins. Red curve is a Poisson curve with rate = median count rate of data. |
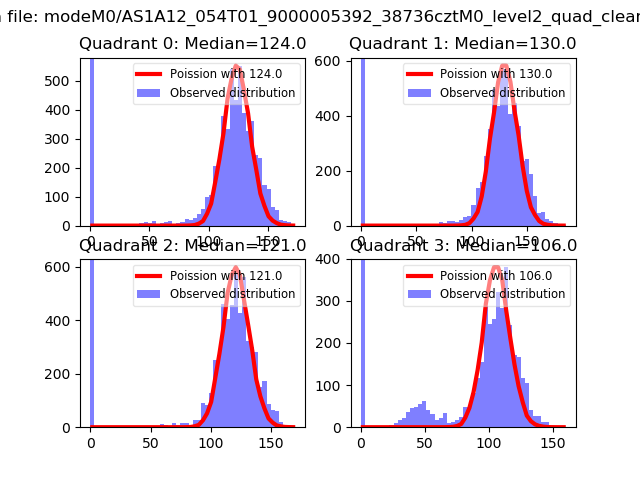 |
 |
| Quadrant-wise count rates Data is divided into 100 sec bins |
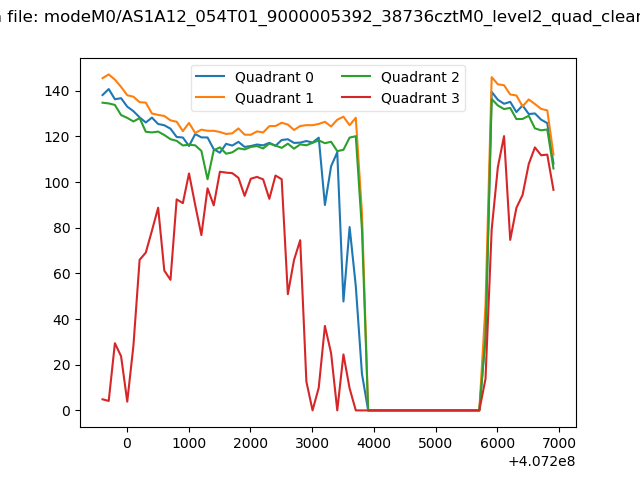 |
|
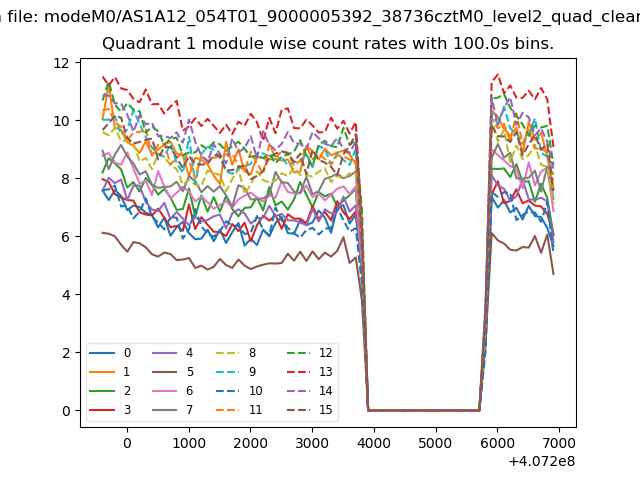
| Module-wise count rates for Quadrant A Data is divided into 100 sec bins |
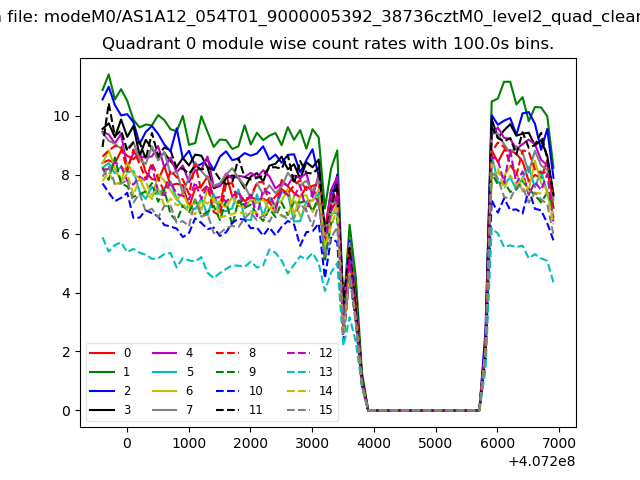 |
 |
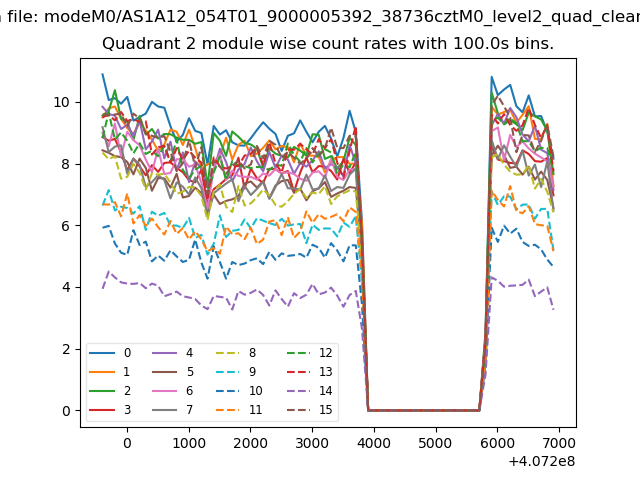
| Module-wise count rates for Quadrant B Data is divided into 100 sec bins |
 |
 |
| Module-wise count rates for Quadrant C Data is divided into 100 sec bins |
 |
 |
| Module-wise count rates for Quadrant D Data is divided into 100 sec bins |
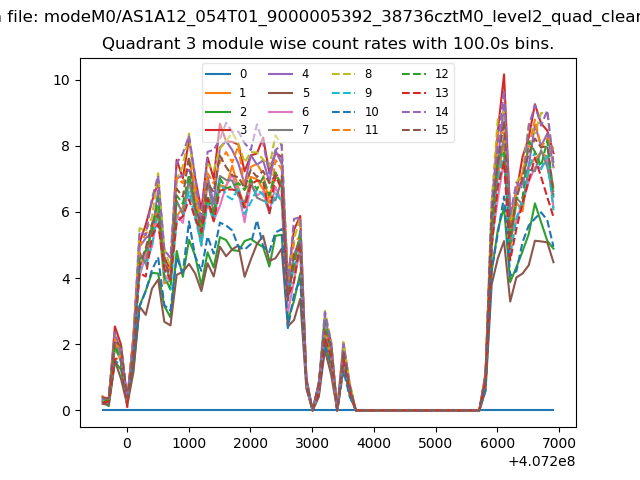 |
 |
| Parameter | Plot |
|---|---|
| CZT HV Monitor | 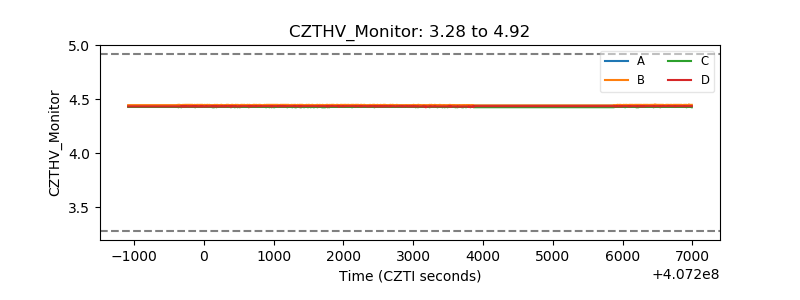 |
| D_VDD | 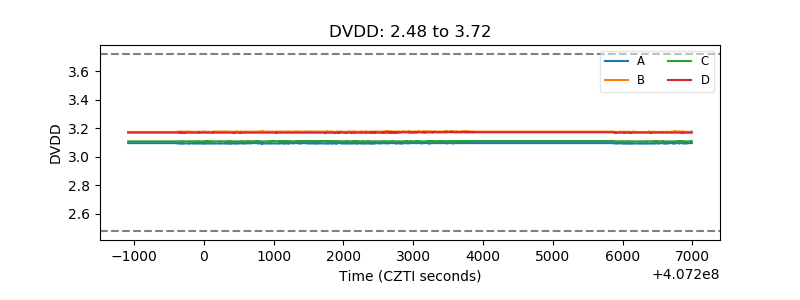 |
| Temperature 1 | 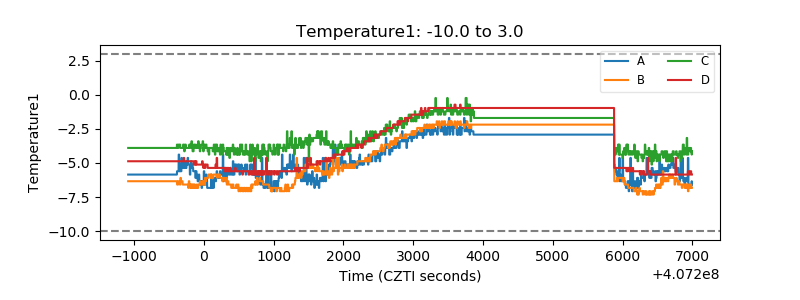 |
| Veto HV Monitor | 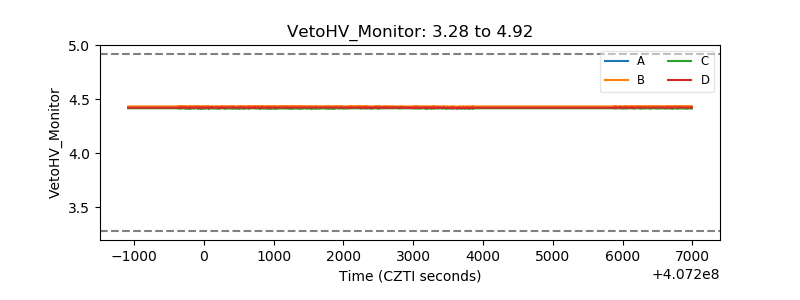 |
| Veto LLD | 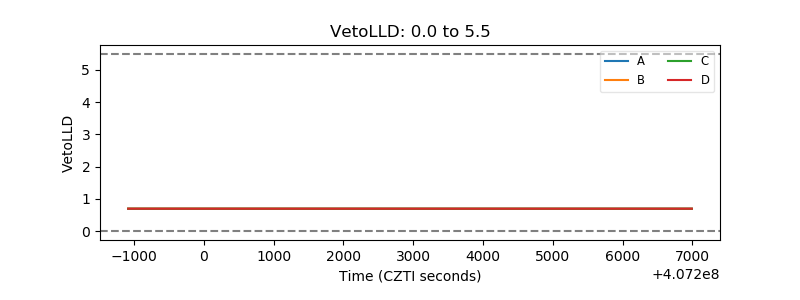 |
| Alpha Counter | 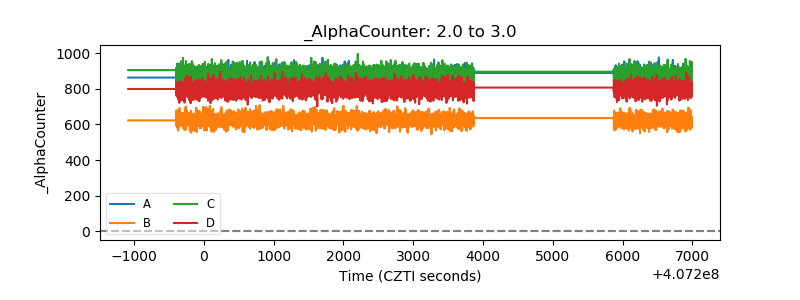 |
| _CPM_Rate | 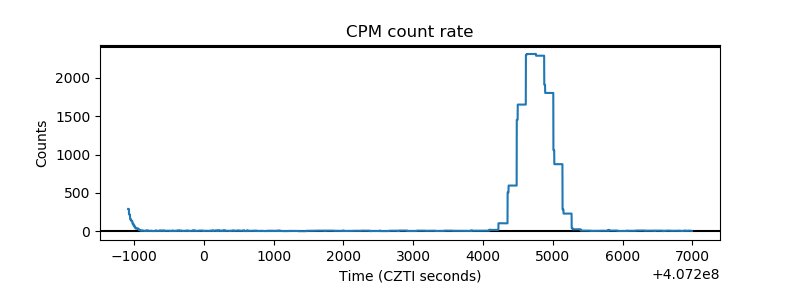 |
| CZT Counter | 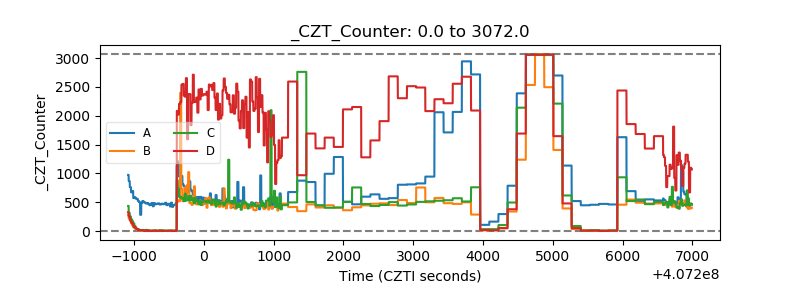 |
| +2.5 Volts monitor | 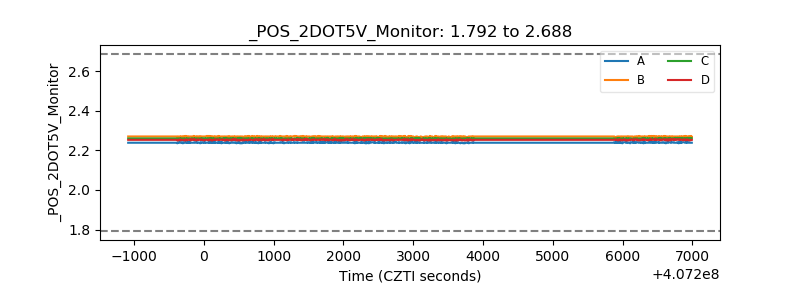 |
| +5 Volts monitor | 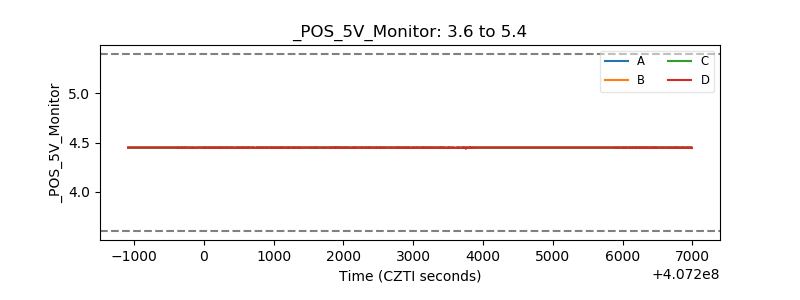 |
| _ROLL_ROT | 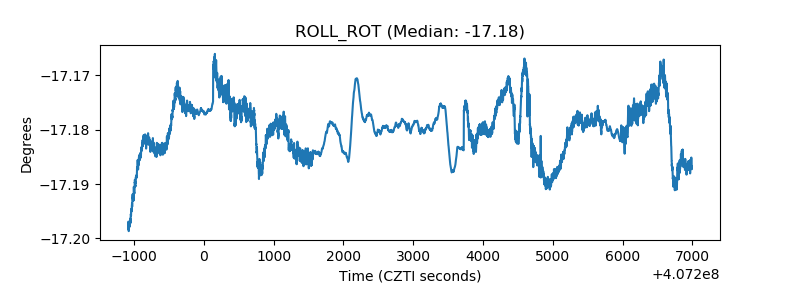 |
| _Roll_DEC | 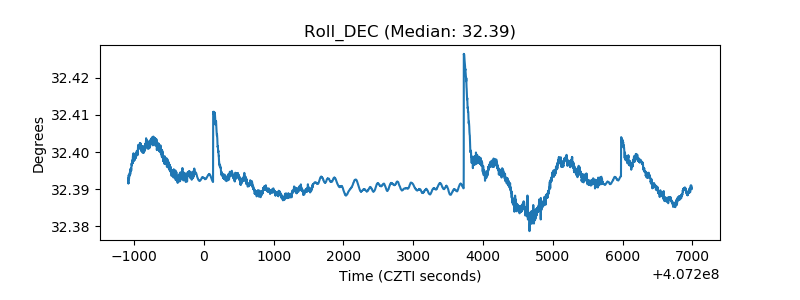 |
| _Roll_RA | 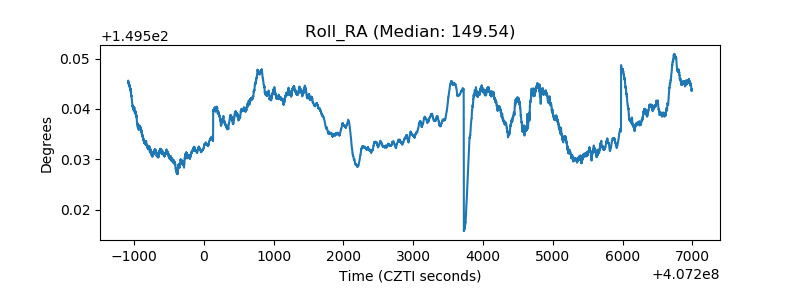 |
| Veto Counter | 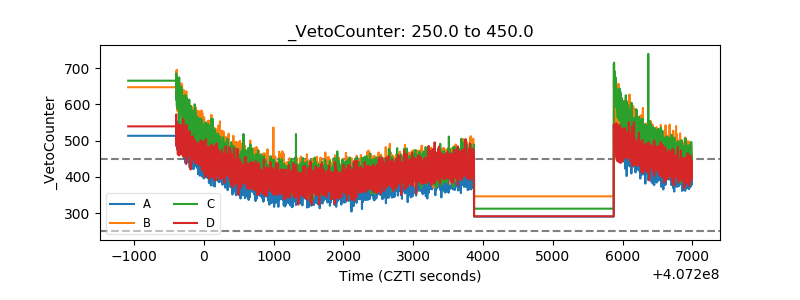 |