| Param | Original file | Final file |
|---|---|---|
| Filename | modeM0/AS1A12_054T01_9000005392_38737cztM0_level2.fits | modeM0/AS1A12_054T01_9000005392_38737cztM0_level2_quad_clean.evt |
| Size (bytes) | 483,376,320 | 91,630,080 |
| Size | 461.0 MB | 87.4 MB |
| Events in quadrant A | 3,865,743 | 638,919 |
| Events in quadrant B | 2,583,380 | 681,791 |
| Events in quadrant C | 2,813,000 | 636,839 |
| Events in quadrant D | 8,222,399 | 448,364 |
| Mode M9 | |||
|---|---|---|---|
| Quadrant | BADHDUFLAG | Total packets | Discarded packets |
| A | 0 | 27 | 0 |
| B | 0 | 27 | 0 |
| C | 0 | 27 | 0 |
| D | 0 | 28 | 0 |
| Mode SS | |||
|---|---|---|---|
| Quadrant | BADHDUFLAG | Total packets | Discarded packets |
| A | 0 | 108 | 0 |
| B | 0 | 108 | 0 |
| C | 0 | 108 | 0 |
| D | 0 | 108 | 0 |
| Mode M0 | |||
|---|---|---|---|
| Quadrant | BADHDUFLAG | Total packets | Discarded packets |
| A | 0 | 14969 | 3 |
| B | 0 | 11020 | 2 |
| C | 0 | 11528 | 2 |
| D | 0 | 28053 | 2 |
| Quadrant | Total seconds | Saturated seconds | Saturation percentage |
|---|---|---|---|
| A | 5262 | 232 | 4.408970% |
| B | 5262 | 20 | 0.380084% |
| C | 5262 | 28 | 0.532117% |
| D | 5262 | 1535 | 29.171418% |
Noise dominated data is calculated using 1-second bins in cleaned event files. If a bin has >2000 counts, and if more than 50% of those come from <1% of pixels, then it is considered to be noise-dominated and hence unusable.
| Quadrant | # 1 sec bins | Bins with >0 counts | Bins with >2000 counts | High rate bins dominated by noise | Noise dominated (total time) | Noise dominated (detector-on time) | Marked lightcurve |
|---|---|---|---|---|---|---|---|
| A | 7354 | 5263 | 154 | 154 | 2.09% | 2.93% | 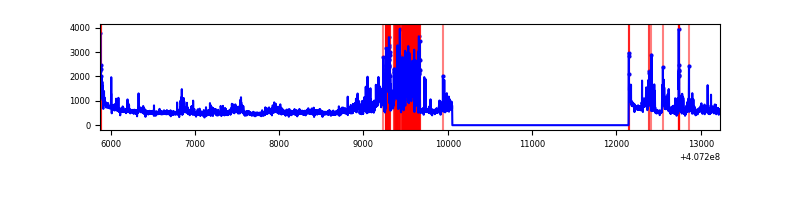 |
| B | 7354 | 5263 | 11 | 11 | 0.15% | 0.21% | 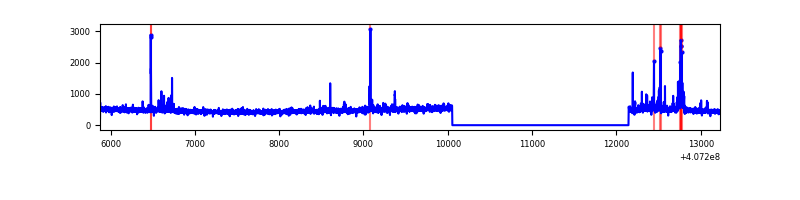 |
| C | 7354 | 5263 | 19 | 19 | 0.26% | 0.36% | 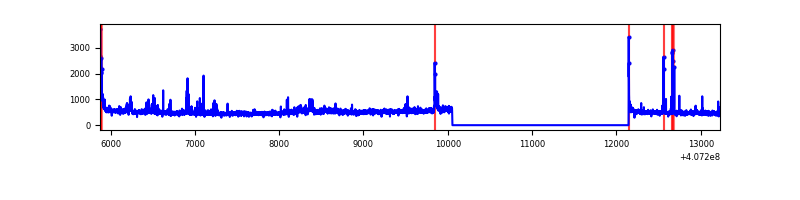 |
| D | 7354 | 5263 | 1317 | 1317 | 17.91% | 25.02% | 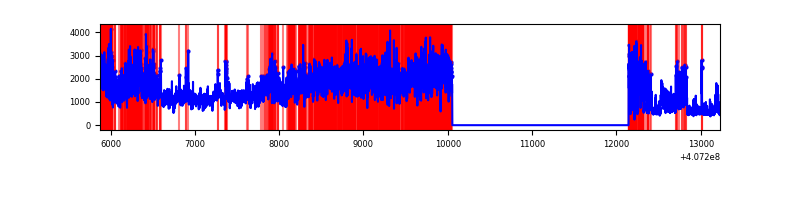 |
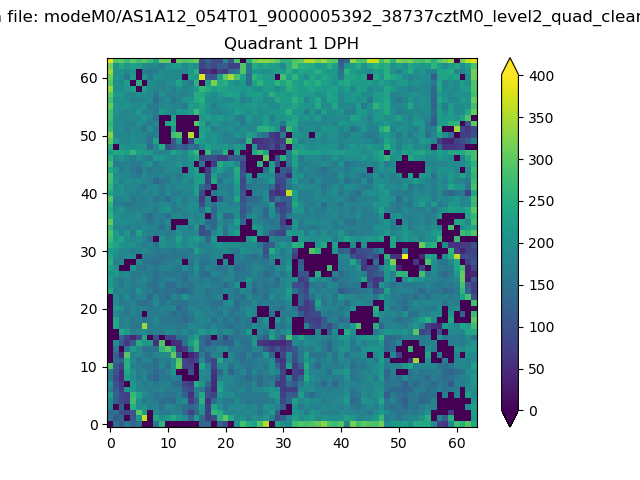
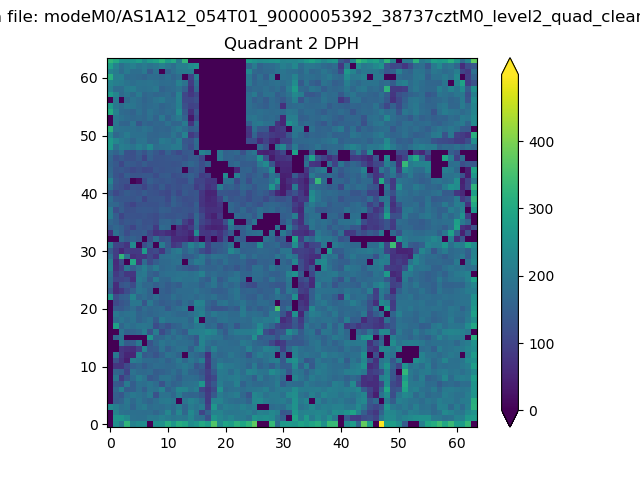
Top three noisy pixels from each quadrant. If the there are fewer than three noisy pixels in the level2.evt file, extra rows are filled as -1
| Pixel properties | Quadrant properties | ||||||
|---|---|---|---|---|---|---|---|
| Quadrant | DetID | PixID | Counts | Sigma | Mean | Median | Sigma |
| A | 0 | 8 | 1080119 | 8862.88 | 605 | 594 | 121.8 |
| A | 10 | 83 | 392420 | 3216.88 | 605 | 594 | 121.8 |
| A | 9 | 143 | 51735 | 419.86 | 605 | 594 | 121.8 |
| B | 4 | 171 | 133564 | 1133.5 | 613 | 597 | 117.3 |
| B | 0 | 230 | 20965 | 173.63 | 613 | 597 | 117.3 |
| B | 12 | 111 | 14055 | 114.72 | 613 | 597 | 117.3 |
| C | 15 | 214 | 217941 | 1575.08 | 593 | 598 | 138.0 |
| C | 14 | 254 | 189891 | 1371.8 | 593 | 598 | 138.0 |
| C | 0 | 10 | 62988 | 452.14 | 593 | 598 | 138.0 |
| D | 2 | 16 | 4068175 | 31090.74 | 537 | 521 | 130.8 |
| D | 12 | 235 | 870576 | 6650.18 | 537 | 521 | 130.8 |
| D | 14 | 52 | 403946 | 3083.54 | 537 | 521 | 130.8 |
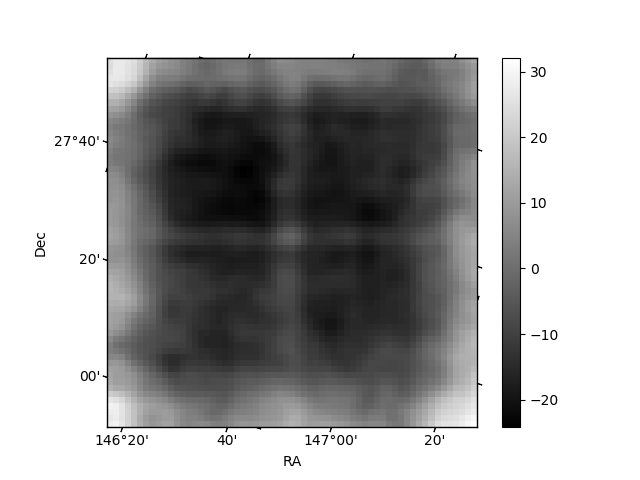
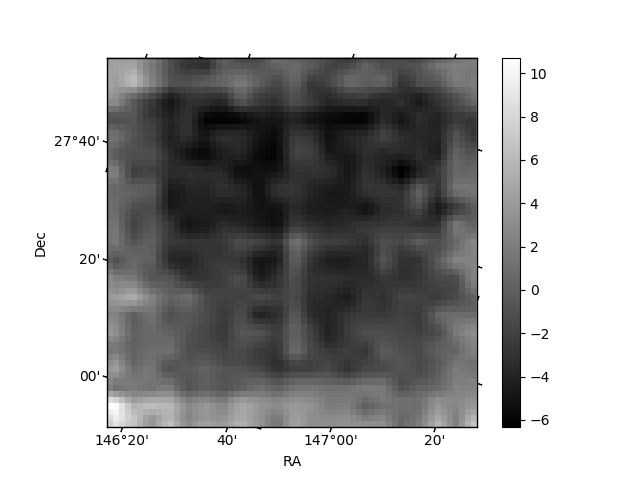
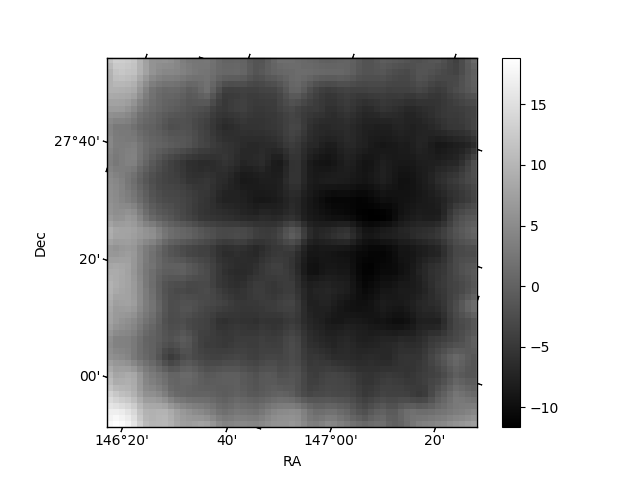
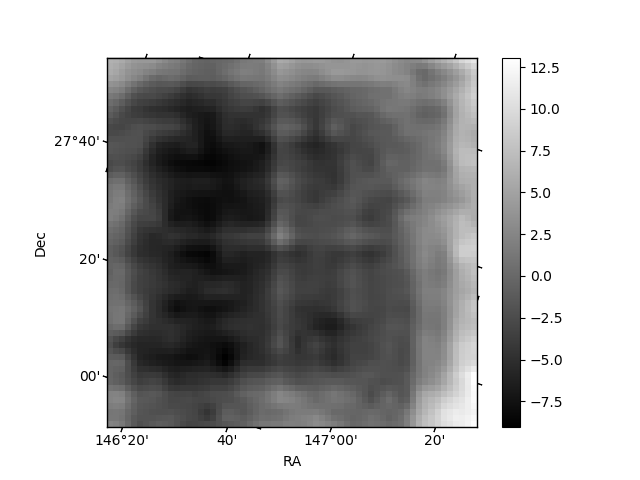
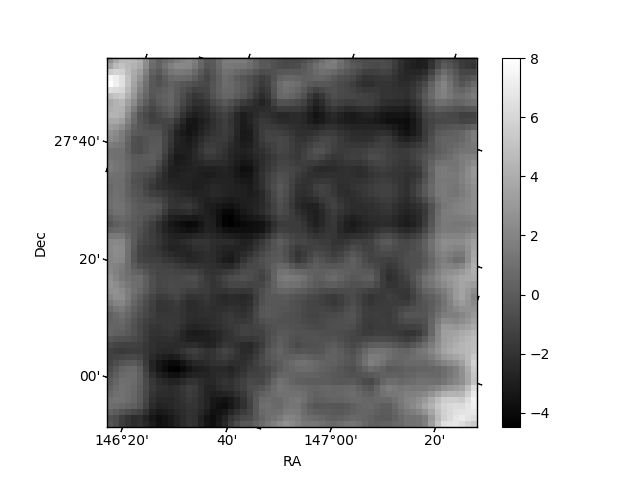
Histogram calculated using DETX and DETY for each event in the final _common_clean file
| Quadrant A | 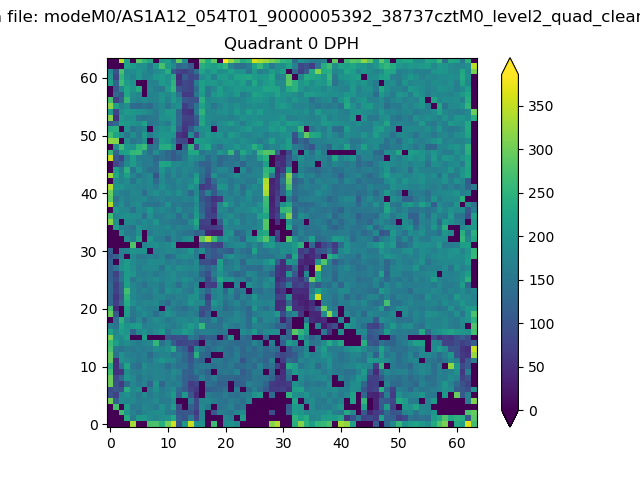 |
 |
Quadrant B |
|---|---|---|---|
| Quadrant D | 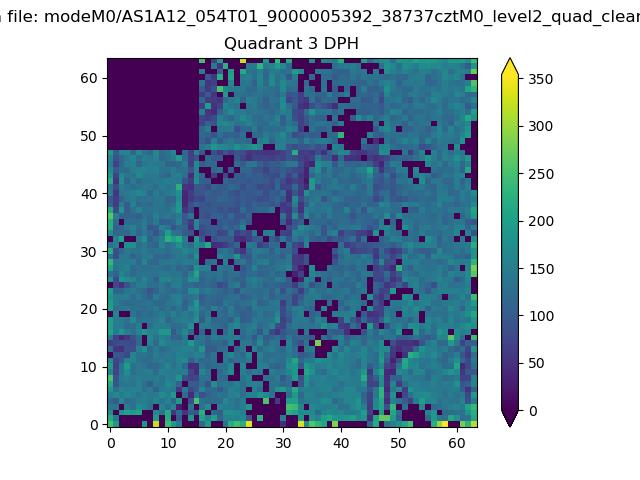 |
 |
Quadrant C |
| Plot type | Count rate plots | Images |
|---|---|---|
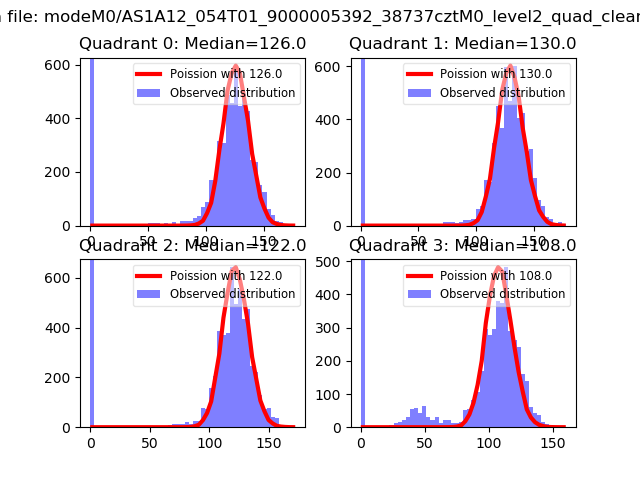
| Comparison with Poisson distribution Blue bars denote a histogram of data divided into 1 sec bins. Red curve is a Poisson curve with rate = median count rate of data. |
 |
 |
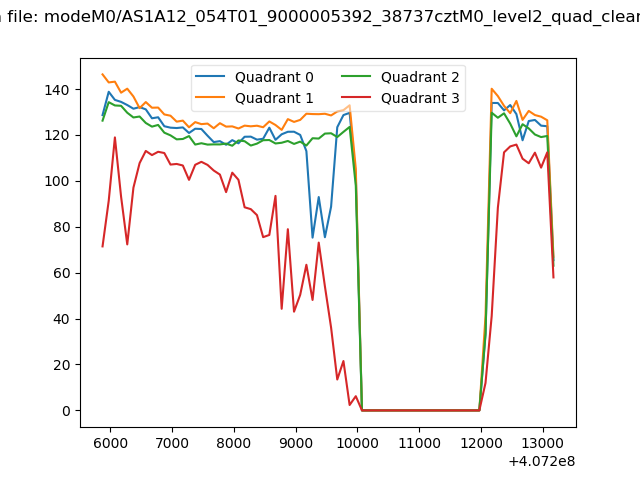
| Quadrant-wise count rates Data is divided into 100 sec bins |
 |
|
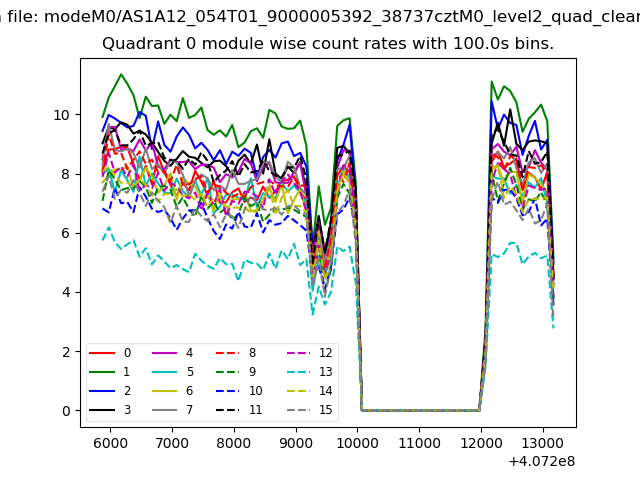
| Module-wise count rates for Quadrant A Data is divided into 100 sec bins |
 |
 |
| Module-wise count rates for Quadrant B Data is divided into 100 sec bins |
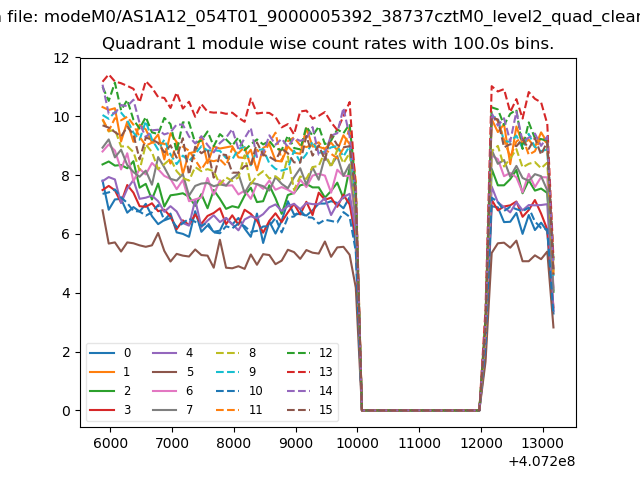 |
 |
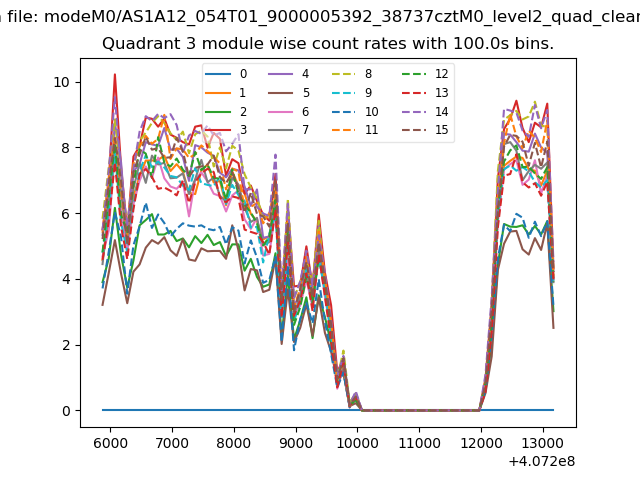
| Module-wise count rates for Quadrant C Data is divided into 100 sec bins |
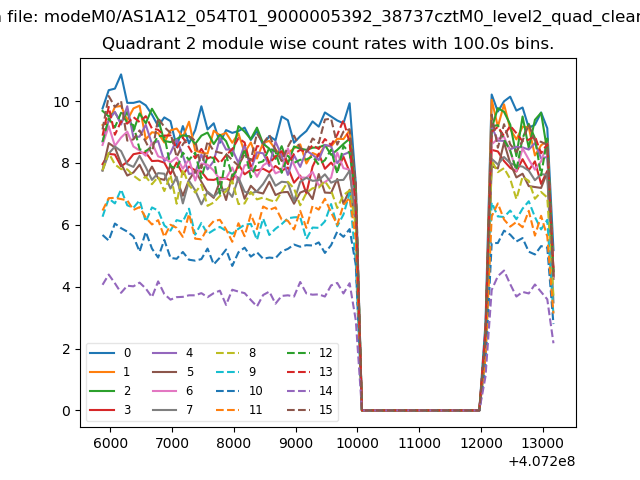 |
 |
| Module-wise count rates for Quadrant D Data is divided into 100 sec bins |
 |
 |
| Parameter | Plot |
|---|---|
| CZT HV Monitor | 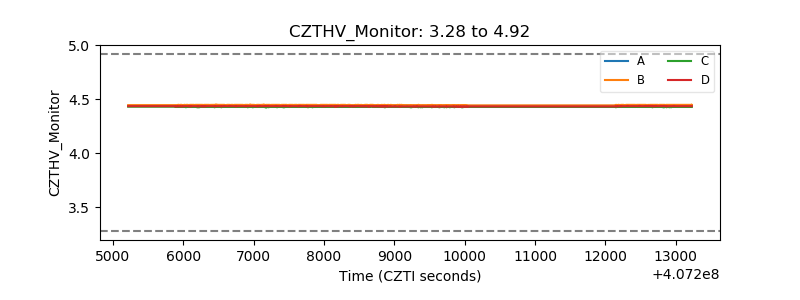 |
| D_VDD | 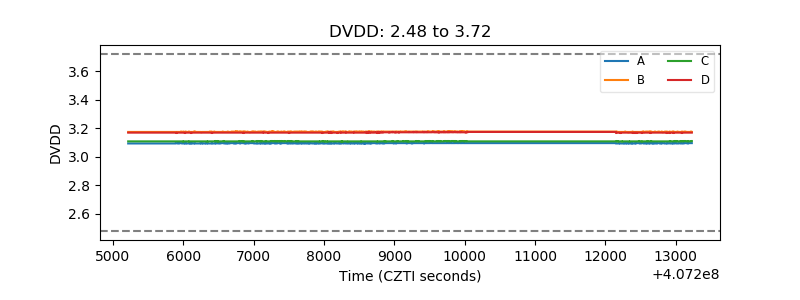 |
| Temperature 1 | 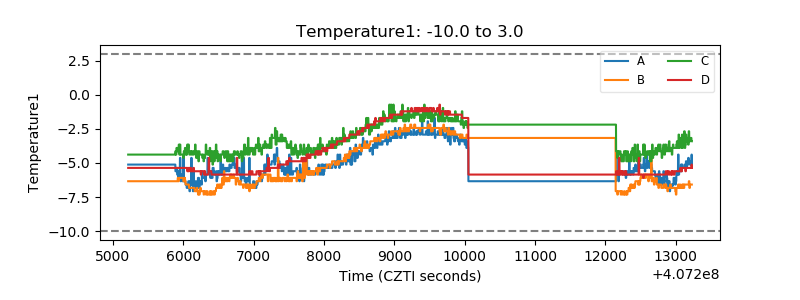 |
| Veto HV Monitor | 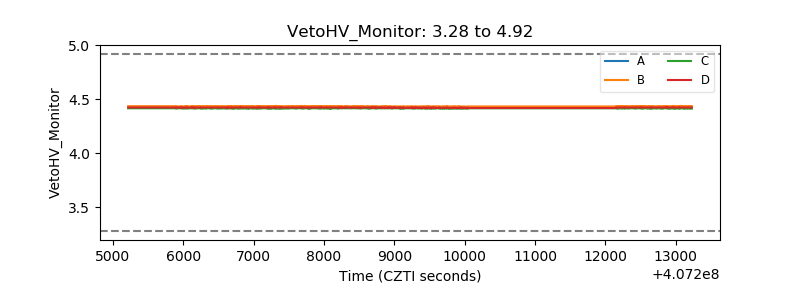 |
| Veto LLD | 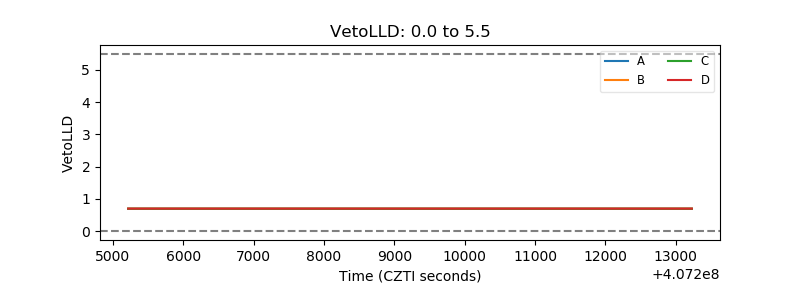 |
| Alpha Counter | 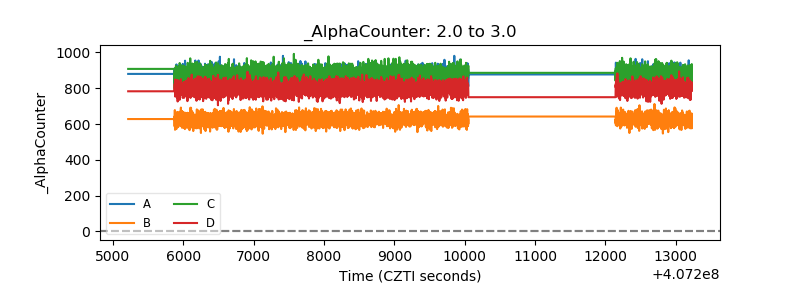 |
| _CPM_Rate | 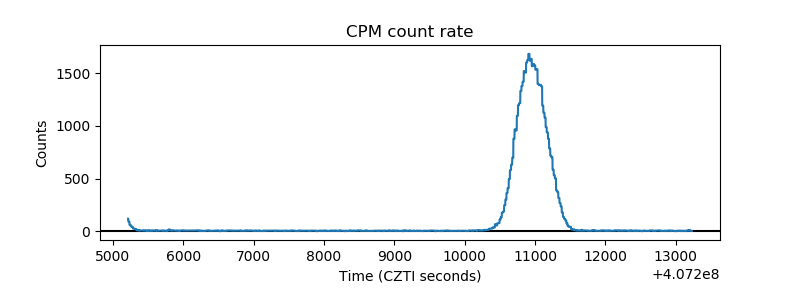 |
| CZT Counter | 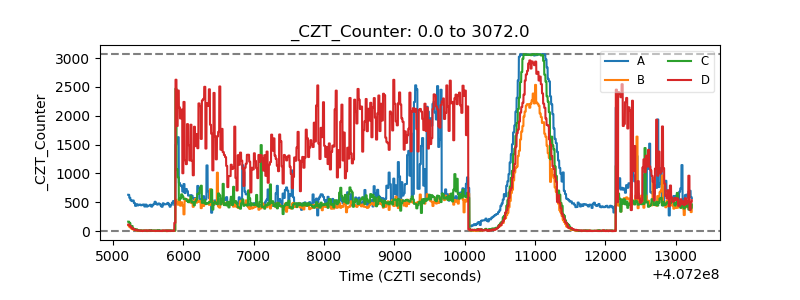 |
| +2.5 Volts monitor | 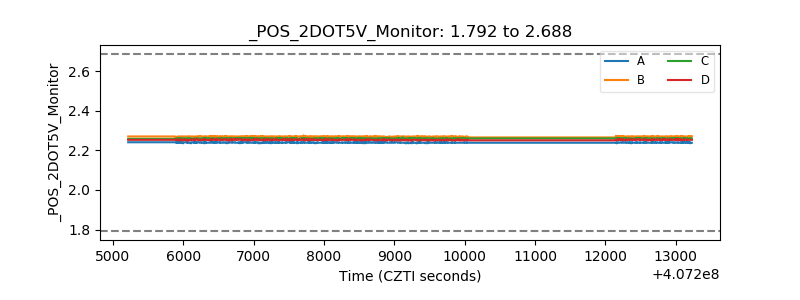 |
| +5 Volts monitor |  |
| _ROLL_ROT | 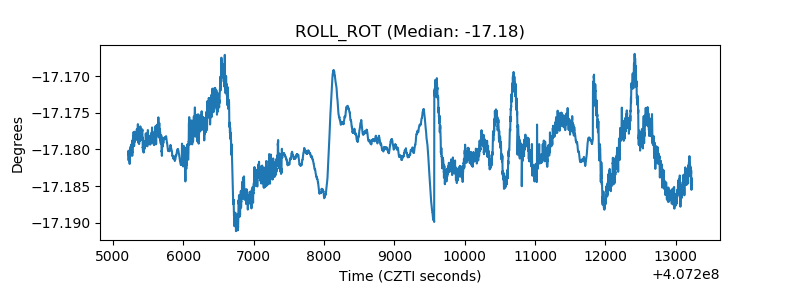 |
| _Roll_DEC | 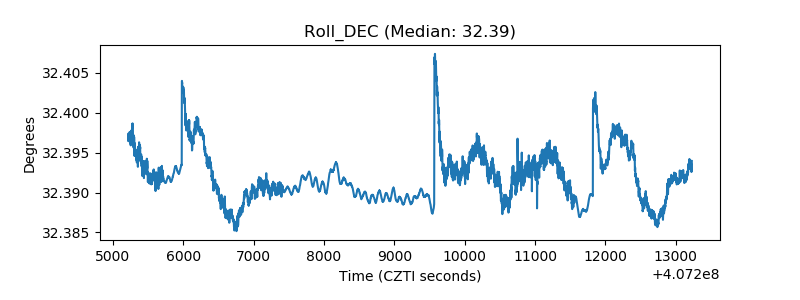 |
| _Roll_RA | 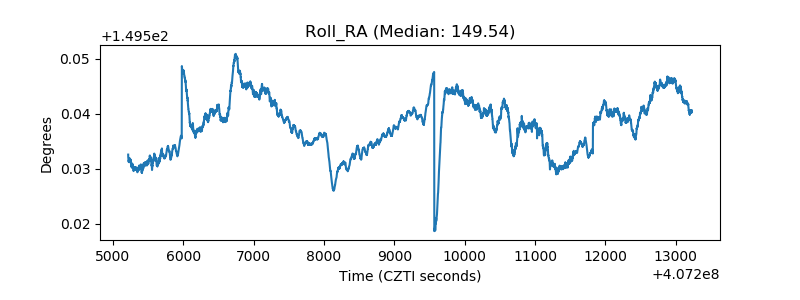 |
| Veto Counter | 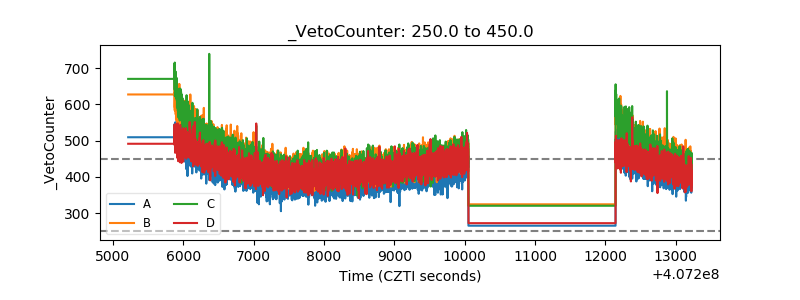 |