| Param | Original file | Final file |
|---|---|---|
| Filename | modeM0/AS1A12_054T01_9000005392_38738cztM0_level2.fits | modeM0/AS1A12_054T01_9000005392_38738cztM0_level2_quad_clean.evt |
| Size (bytes) | 408,268,800 | 91,218,240 |
| Size | 389.4 MB | 87.0 MB |
| Events in quadrant A | 3,641,944 | 625,226 |
| Events in quadrant B | 2,661,098 | 652,070 |
| Events in quadrant C | 2,653,359 | 612,609 |
| Events in quadrant D | 5,750,995 | 506,970 |
| Mode M9 | |||
|---|---|---|---|
| Quadrant | BADHDUFLAG | Total packets | Discarded packets |
| A | 0 | 36 | 0 |
| B | 0 | 36 | 0 |
| C | 0 | 36 | 0 |
| D | 0 | 37 | 0 |
| Mode SS | |||
|---|---|---|---|
| Quadrant | BADHDUFLAG | Total packets | Discarded packets |
| A | 0 | 106 | 0 |
| B | 0 | 106 | 0 |
| C | 0 | 106 | 0 |
| D | 0 | 106 | 0 |
| Mode M0 | |||
|---|---|---|---|
| Quadrant | BADHDUFLAG | Total packets | Discarded packets |
| A | 0 | 14135 | 3 |
| B | 0 | 11275 | 2 |
| C | 0 | 11023 | 2 |
| D | 0 | 20679 | 2 |
| Quadrant | Total seconds | Saturated seconds | Saturation percentage |
|---|---|---|---|
| A | 5215 | 174 | 3.336529% |
| B | 5215 | 56 | 1.073826% |
| C | 5215 | 28 | 0.536913% |
| D | 5215 | 677 | 12.981783% |
Noise dominated data is calculated using 1-second bins in cleaned event files. If a bin has >2000 counts, and if more than 50% of those come from <1% of pixels, then it is considered to be noise-dominated and hence unusable.
| Quadrant | # 1 sec bins | Bins with >0 counts | Bins with >2000 counts | High rate bins dominated by noise | Noise dominated (total time) | Noise dominated (detector-on time) | Marked lightcurve |
|---|---|---|---|---|---|---|---|
| A | 7337 | 5216 | 91 | 91 | 1.24% | 1.74% | 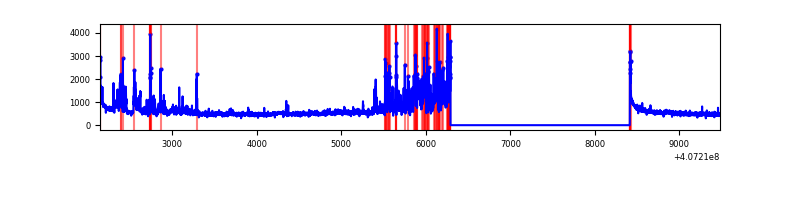 |
| B | 7337 | 5216 | 24 | 24 | 0.33% | 0.46% | 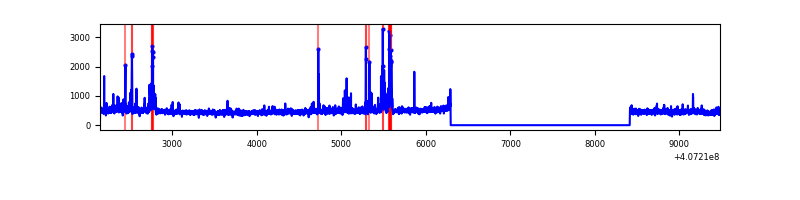 |
| C | 7337 | 5216 | 28 | 28 | 0.38% | 0.54% | 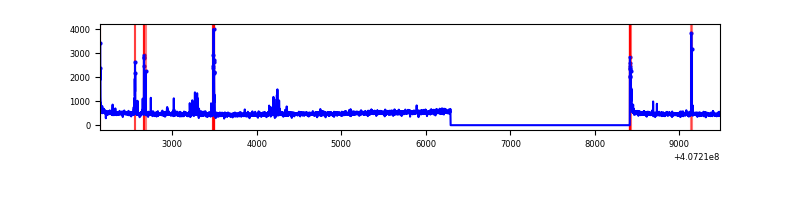 |
| D | 7337 | 5216 | 540 | 540 | 7.36% | 10.35% | 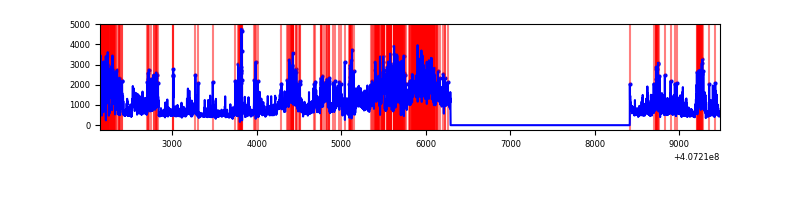 |
Top three noisy pixels from each quadrant. If the there are fewer than three noisy pixels in the level2.evt file, extra rows are filled as -1
| Pixel properties | Quadrant properties | ||||||
|---|---|---|---|---|---|---|---|
| Quadrant | DetID | PixID | Counts | Sigma | Mean | Median | Sigma |
| A | 0 | 8 | 886006 | 7433.46 | 594 | 584 | 119.1 |
| A | 10 | 83 | 394991 | 3311.2 | 594 | 584 | 119.1 |
| A | 9 | 143 | 52164 | 433.03 | 594 | 584 | 119.1 |
| B | 4 | 171 | 249863 | 2160.56 | 595 | 579 | 115.4 |
| B | 0 | 189 | 31798 | 270.58 | 595 | 579 | 115.4 |
| B | 0 | 230 | 19953 | 167.92 | 595 | 579 | 115.4 |
| C | 15 | 214 | 217481 | 1615.32 | 580 | 583 | 134.3 |
| C | 14 | 254 | 89724 | 663.86 | 580 | 583 | 134.3 |
| C | 0 | 10 | 50812 | 374.07 | 580 | 583 | 134.3 |
| D | 12 | 235 | 1448618 | 10852.02 | 553 | 539 | 133.4 |
| D | 2 | 16 | 1022678 | 7659.99 | 553 | 539 | 133.4 |
| D | 2 | 249 | 480432 | 3596.36 | 553 | 539 | 133.4 |
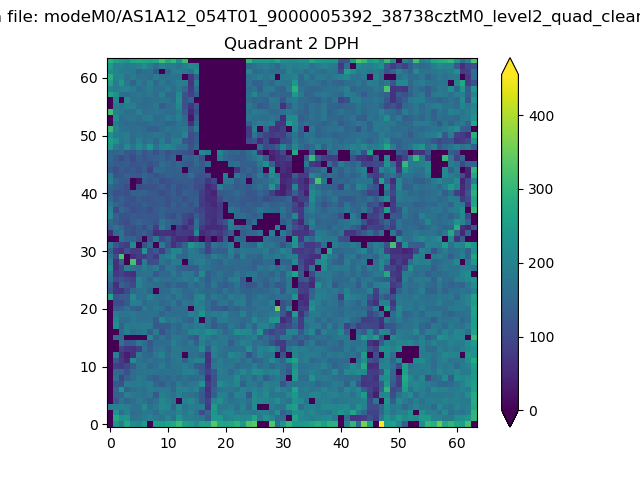
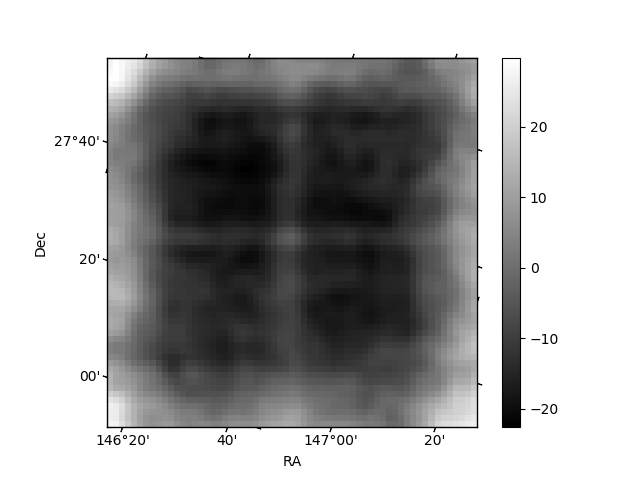
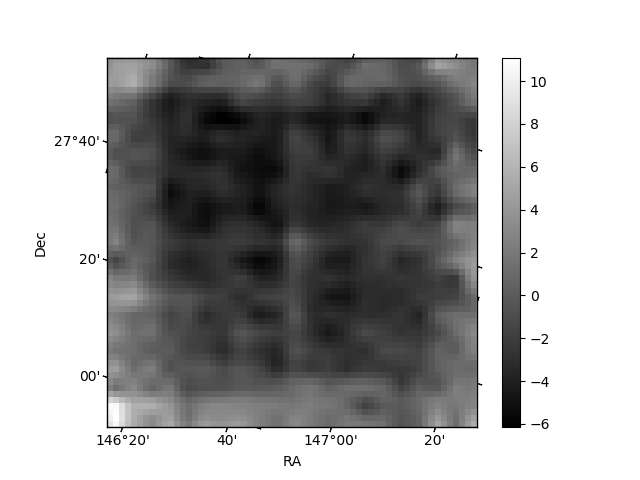
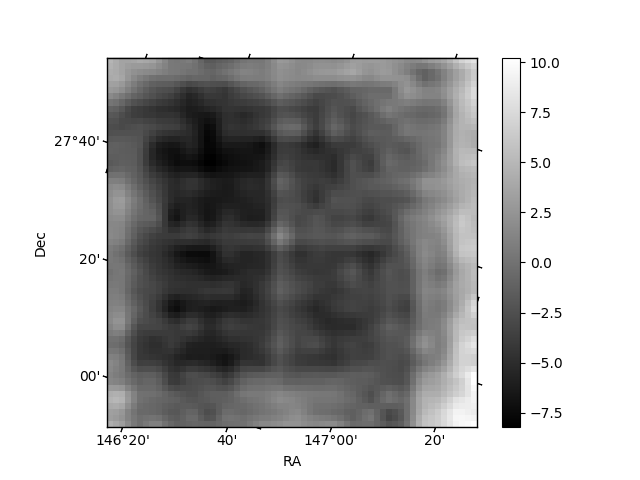
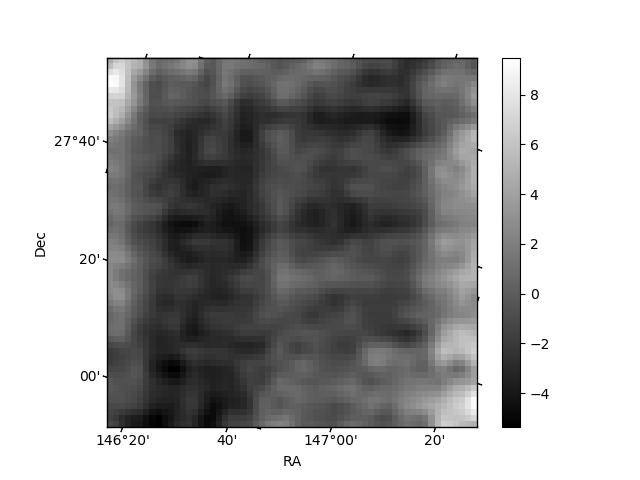
Histogram calculated using DETX and DETY for each event in the final _common_clean file
| Quadrant A | 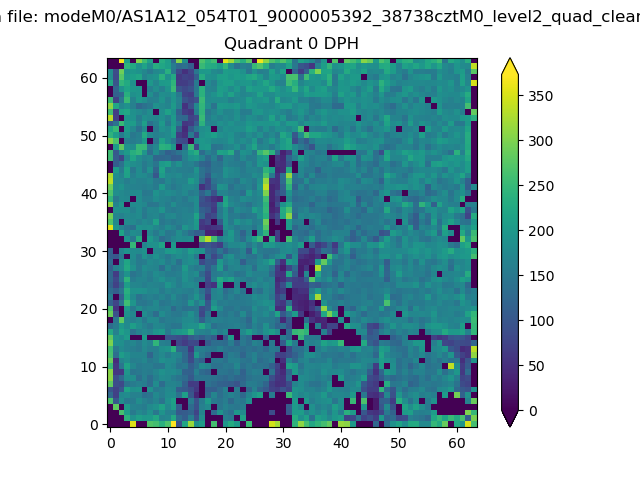 |
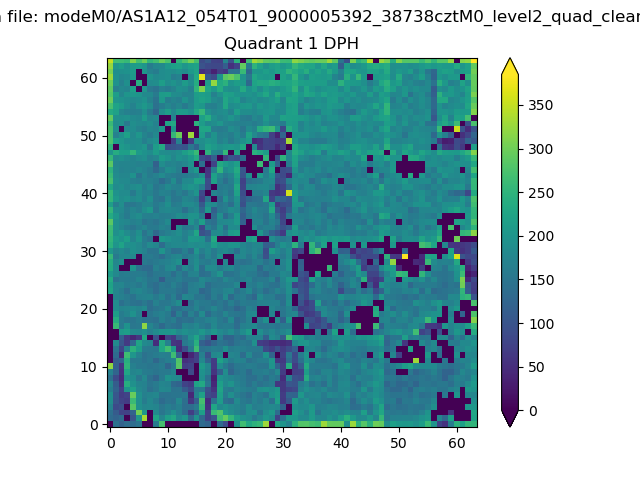 |
Quadrant B |
|---|---|---|---|
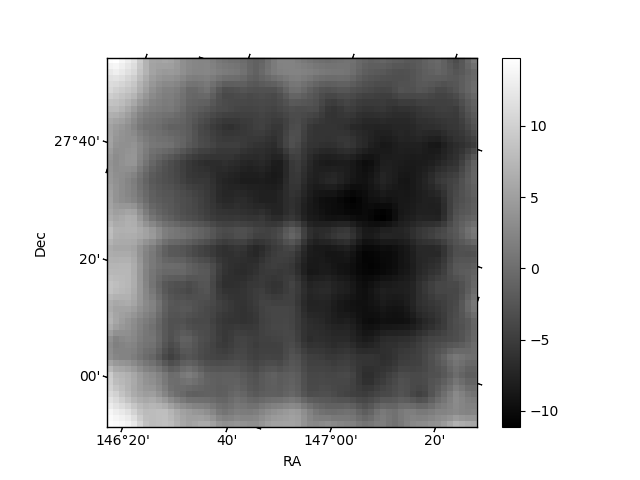
| Quadrant D | 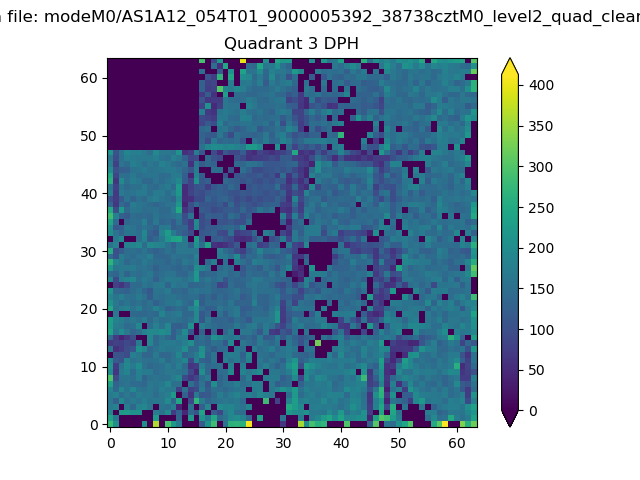 |
 |
Quadrant C |
| Plot type | Count rate plots | Images |
|---|---|---|
| Comparison with Poisson distribution Blue bars denote a histogram of data divided into 1 sec bins. Red curve is a Poisson curve with rate = median count rate of data. |
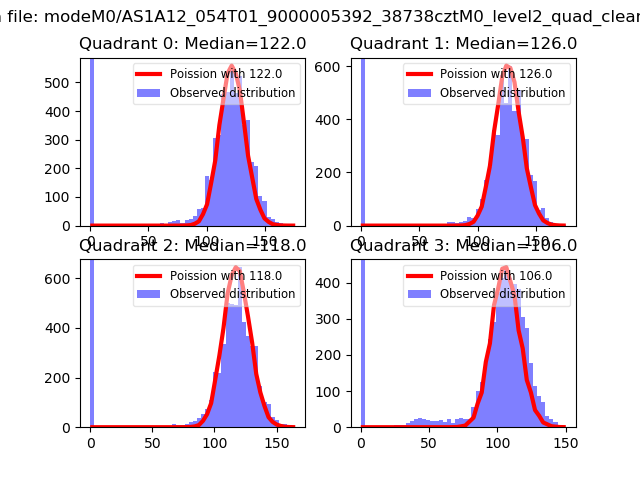 |
 |
| Quadrant-wise count rates Data is divided into 100 sec bins |
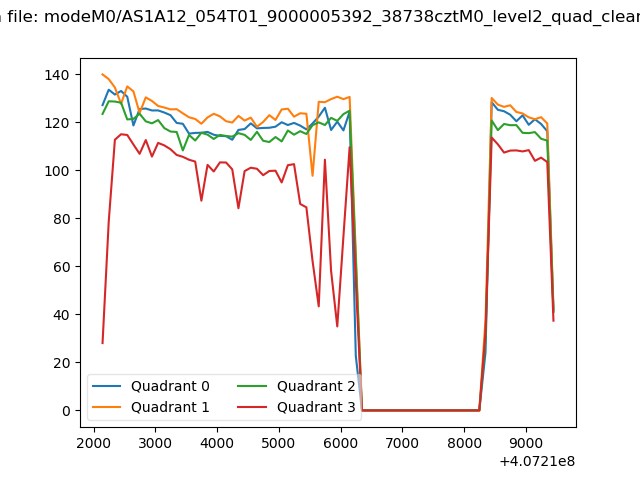 |
|
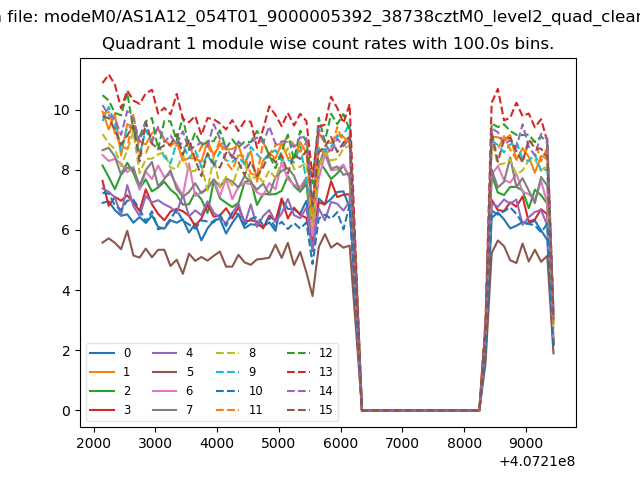
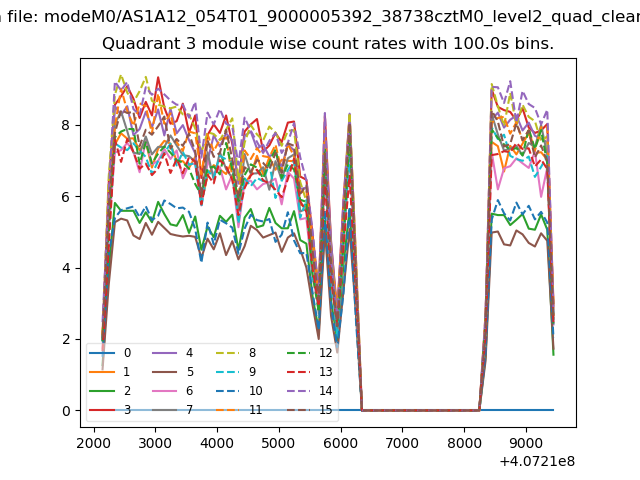
| Module-wise count rates for Quadrant A Data is divided into 100 sec bins |
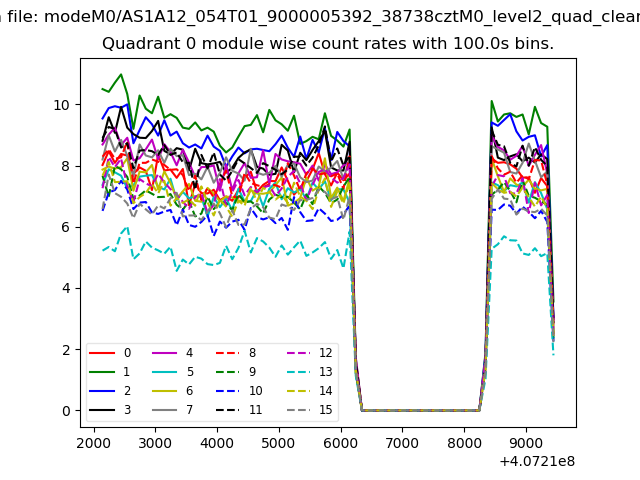 |
 |
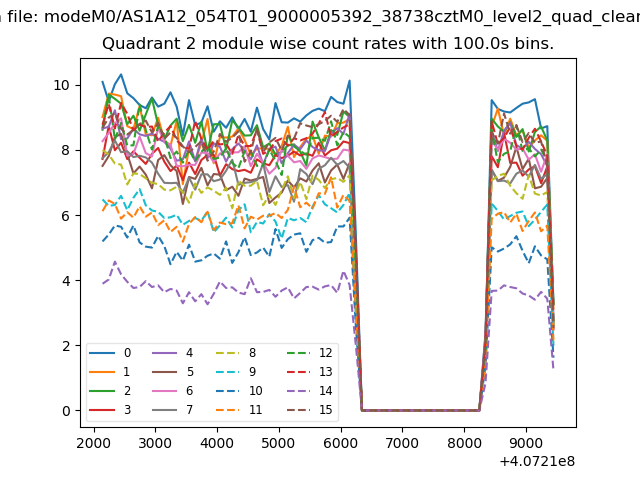
| Module-wise count rates for Quadrant B Data is divided into 100 sec bins |
 |
 |
| Module-wise count rates for Quadrant C Data is divided into 100 sec bins |
 |
 |
| Module-wise count rates for Quadrant D Data is divided into 100 sec bins |
 |
 |
| Parameter | Plot |
|---|---|
| CZT HV Monitor | 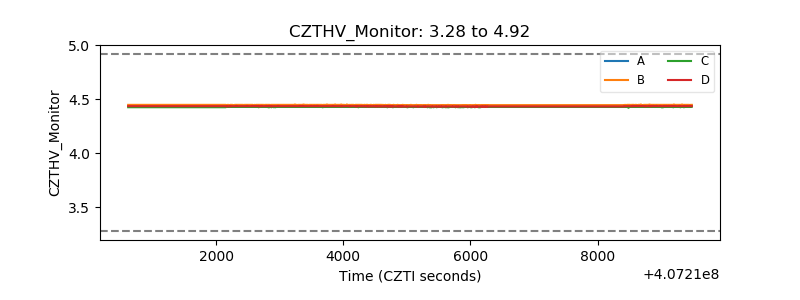 |
| D_VDD | 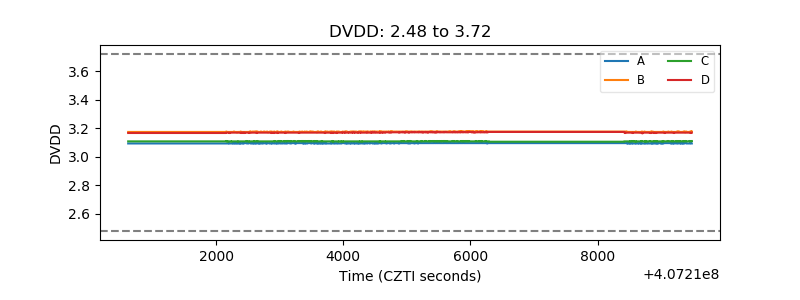 |
| Temperature 1 | 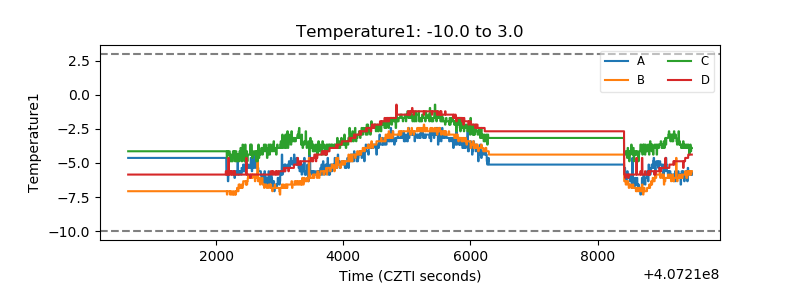 |
| Veto HV Monitor | 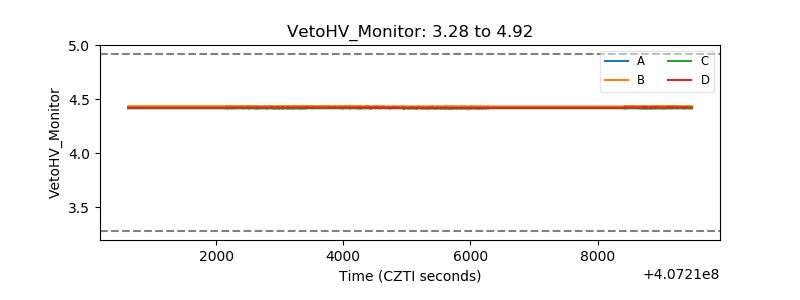 |
| Veto LLD | 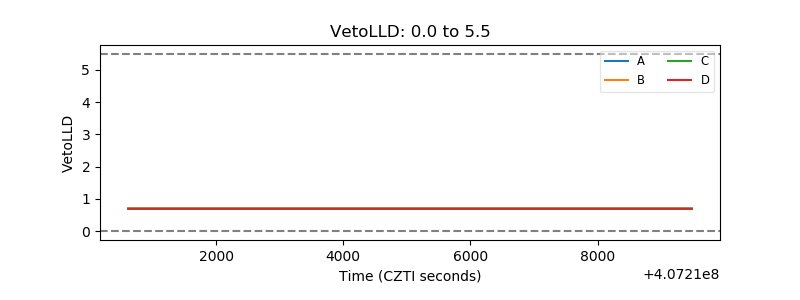 |
| Alpha Counter | 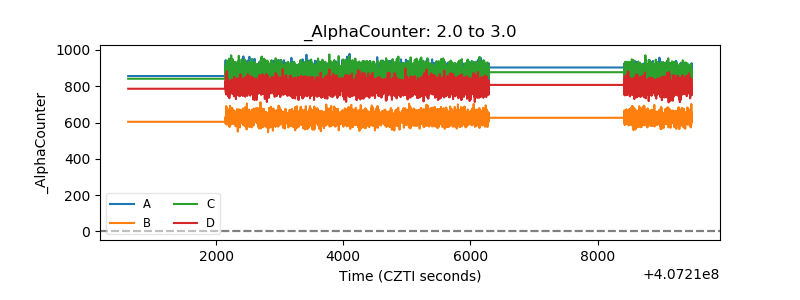 |
| _CPM_Rate | 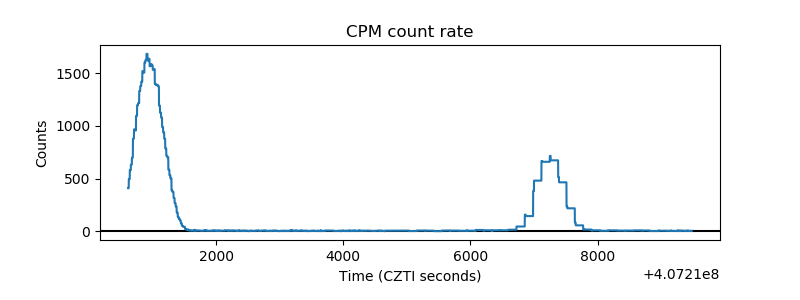 |
| CZT Counter | 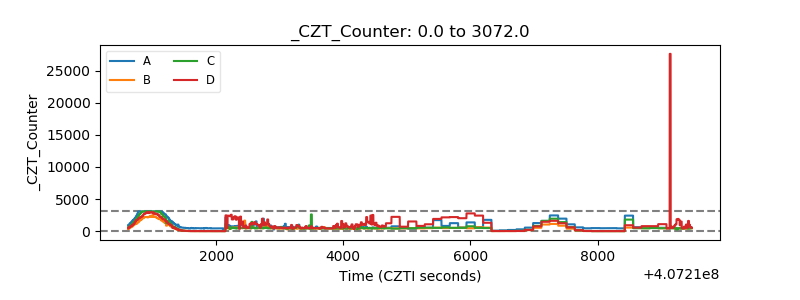 |
| +2.5 Volts monitor | 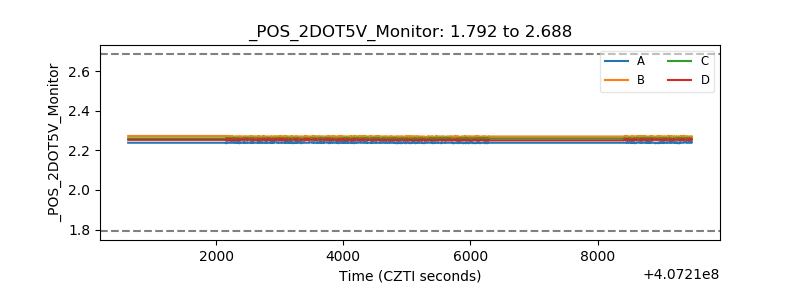 |
| +5 Volts monitor | 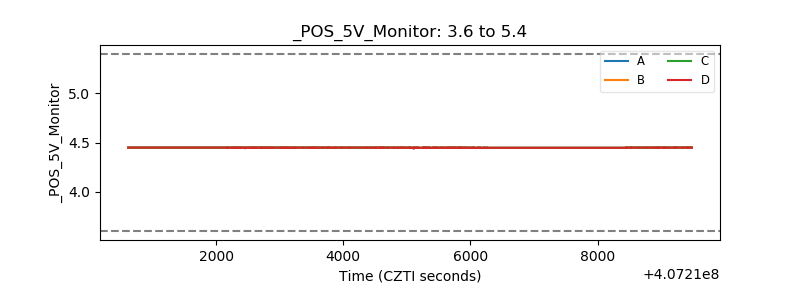 |
| _ROLL_ROT | 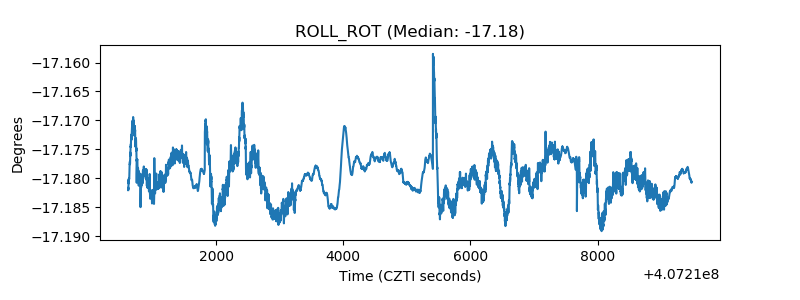 |
| _Roll_DEC | 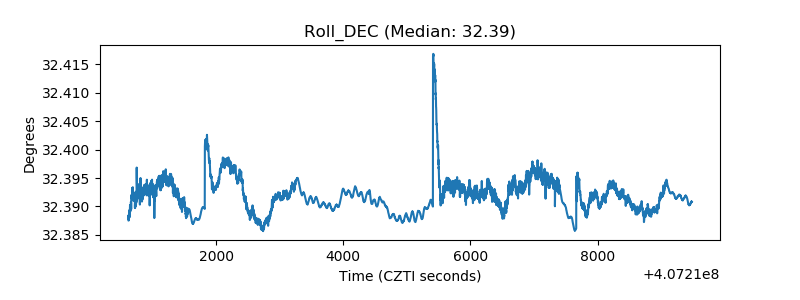 |
| _Roll_RA | 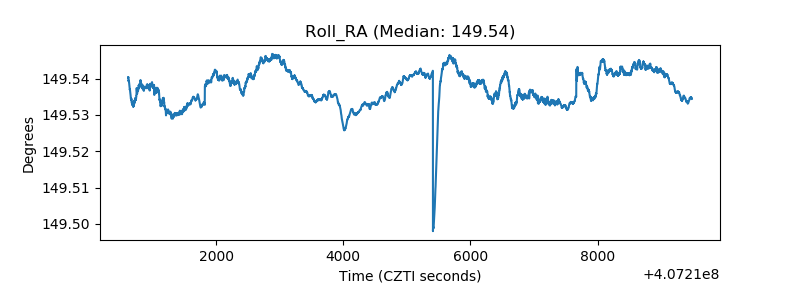 |
| Veto Counter | 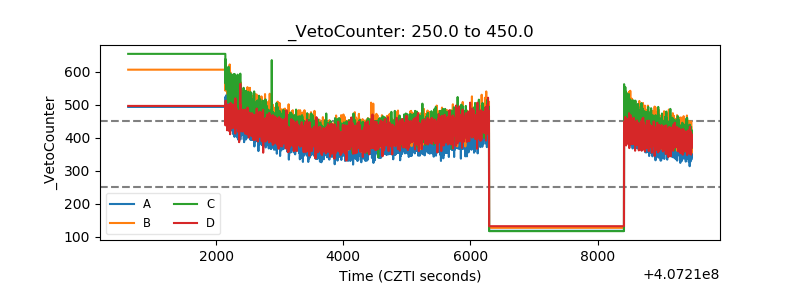 |