| Param | Original file | Final file |
|---|---|---|
| Filename | modeM0/AS1A12_054T01_9000005392_38739cztM0_level2.fits | modeM0/AS1A12_054T01_9000005392_38739cztM0_level2_quad_clean.evt |
| Size (bytes) | 416,877,120 | 86,829,120 |
| Size | 397.6 MB | 82.8 MB |
| Events in quadrant A | 4,367,516 | 551,704 |
| Events in quadrant B | 3,098,818 | 599,760 |
| Events in quadrant C | 2,546,644 | 585,173 |
| Events in quadrant D | 5,016,714 | 530,197 |
| Mode M9 | |||
|---|---|---|---|
| Quadrant | BADHDUFLAG | Total packets | Discarded packets |
| A | 0 | 27 | 0 |
| B | 0 | 27 | 0 |
| C | 0 | 27 | 0 |
| D | 0 | 28 | 0 |
| Mode SS | |||
|---|---|---|---|
| Quadrant | BADHDUFLAG | Total packets | Discarded packets |
| A | 0 | 106 | 0 |
| B | 0 | 106 | 0 |
| C | 0 | 106 | 0 |
| D | 0 | 106 | 0 |
| Mode M0 | |||
|---|---|---|---|
| Quadrant | BADHDUFLAG | Total packets | Discarded packets |
| A | 0 | 16312 | 3 |
| B | 0 | 12609 | 2 |
| C | 0 | 10736 | 2 |
| D | 0 | 18513 | 2 |
| Quadrant | Total seconds | Saturated seconds | Saturation percentage |
|---|---|---|---|
| A | 5170 | 557 | 10.773694% |
| B | 5170 | 227 | 4.390716% |
| C | 5170 | 18 | 0.348162% |
| D | 5170 | 189 | 3.655706% |
Noise dominated data is calculated using 1-second bins in cleaned event files. If a bin has >2000 counts, and if more than 50% of those come from <1% of pixels, then it is considered to be noise-dominated and hence unusable.
| Quadrant | # 1 sec bins | Bins with >0 counts | Bins with >2000 counts | High rate bins dominated by noise | Noise dominated (total time) | Noise dominated (detector-on time) | Marked lightcurve |
|---|---|---|---|---|---|---|---|
| A | 7263 | 5171 | 410 | 410 | 5.65% | 7.93% | 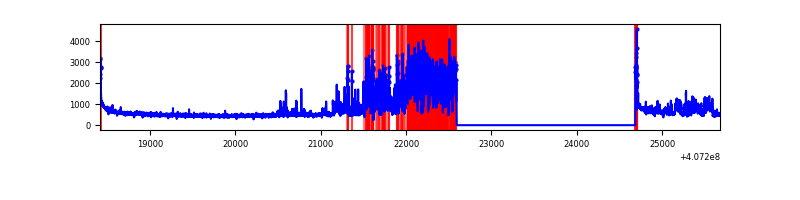 |
| B | 7263 | 5171 | 167 | 167 | 2.30% | 3.23% | 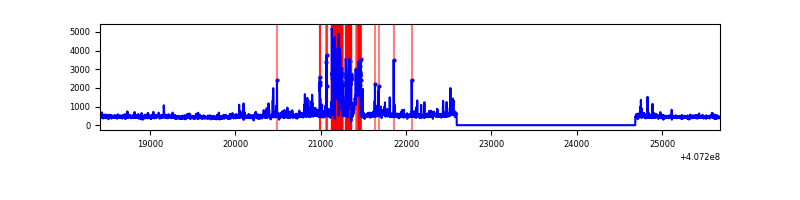 |
| C | 7263 | 5171 | 20 | 20 | 0.28% | 0.39% | 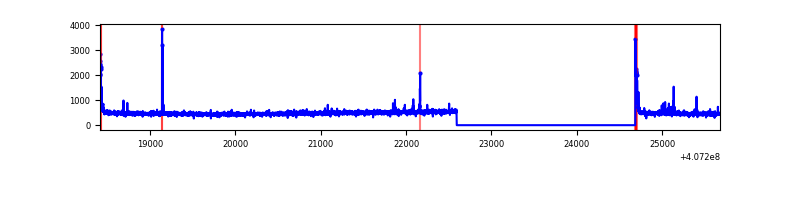 |
| D | 7263 | 5171 | 174 | 174 | 2.40% | 3.36% | 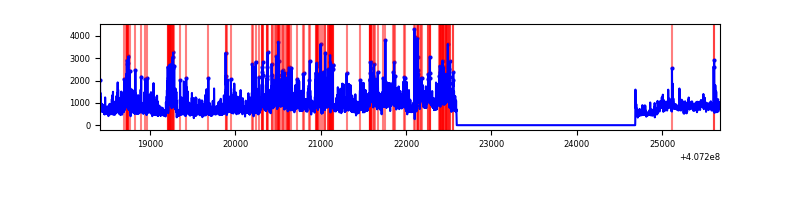 |
Top three noisy pixels from each quadrant. If the there are fewer than three noisy pixels in the level2.evt file, extra rows are filled as -1
| Pixel properties | Quadrant properties | ||||||
|---|---|---|---|---|---|---|---|
| Quadrant | DetID | PixID | Counts | Sigma | Mean | Median | Sigma |
| A | 0 | 8 | 1796442 | 15677.53 | 563 | 552 | 114.6 |
| A | 10 | 83 | 376836 | 3284.84 | 563 | 552 | 114.6 |
| A | 13 | 254 | 8189 | 66.67 | 563 | 552 | 114.6 |
| B | 5 | 184 | 628081 | 5685.57 | 567 | 552 | 110.4 |
| B | 0 | 189 | 121625 | 1096.95 | 567 | 552 | 110.4 |
| B | 4 | 171 | 105512 | 950.96 | 567 | 552 | 110.4 |
| C | 15 | 214 | 219328 | 1649.94 | 567 | 570 | 132.6 |
| C | 0 | 10 | 73930 | 553.31 | 567 | 570 | 132.6 |
| C | 14 | 254 | 40566 | 301.66 | 567 | 570 | 132.6 |
| D | 12 | 235 | 1517795 | 10988.04 | 562 | 548 | 138.1 |
| D | 2 | 16 | 718584 | 5200.08 | 562 | 548 | 138.1 |
| D | 12 | 233 | 170626 | 1231.72 | 562 | 548 | 138.1 |
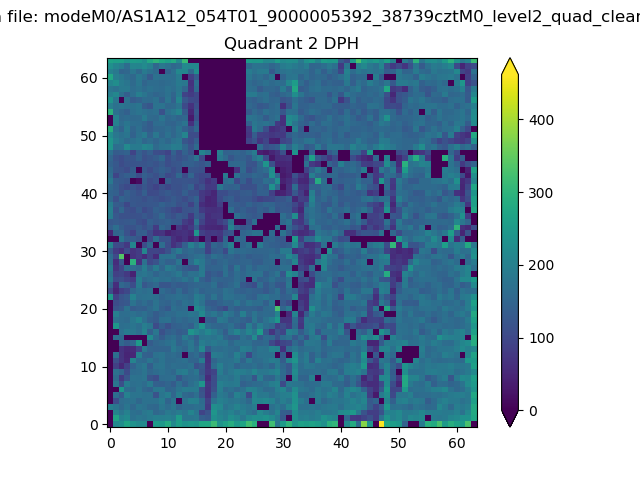
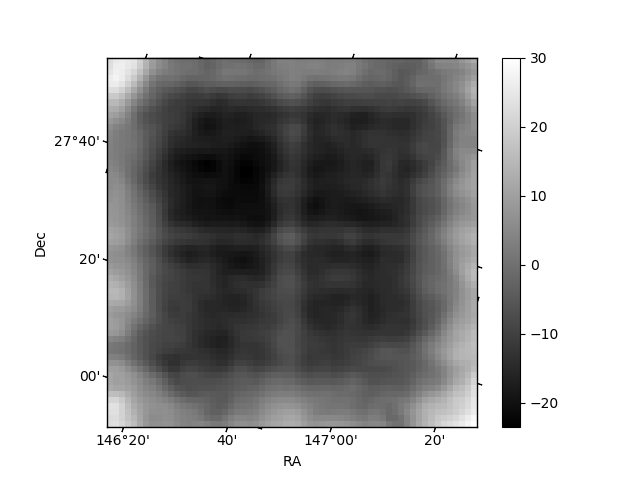
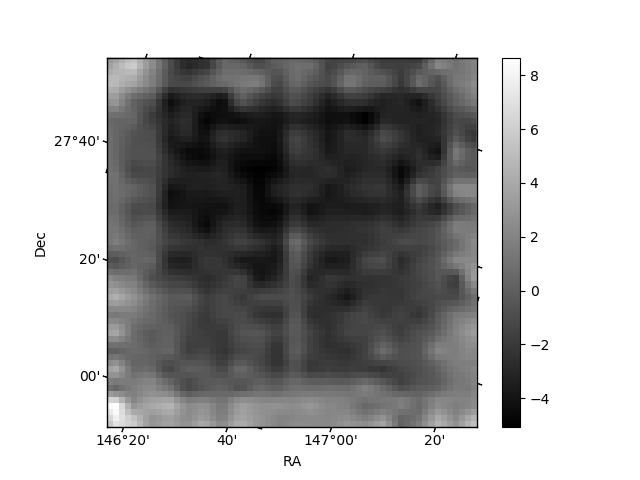
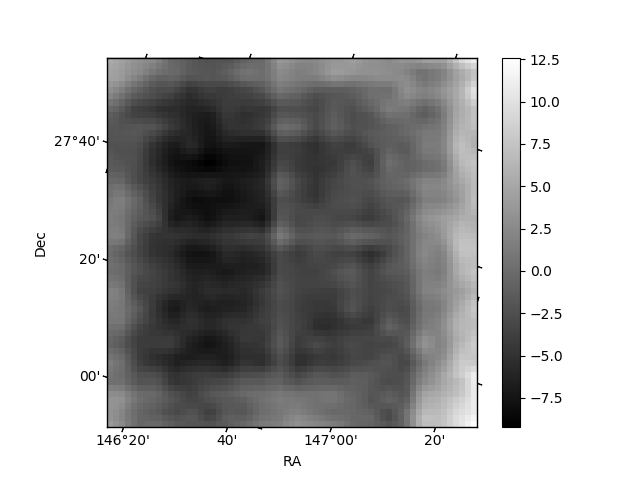
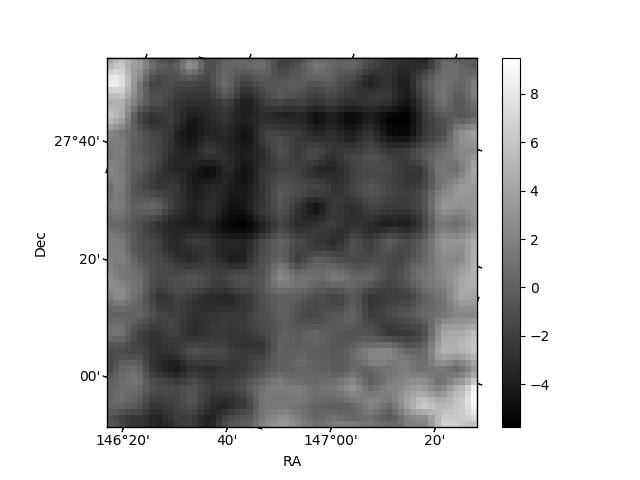
Histogram calculated using DETX and DETY for each event in the final _common_clean file
| Quadrant A | 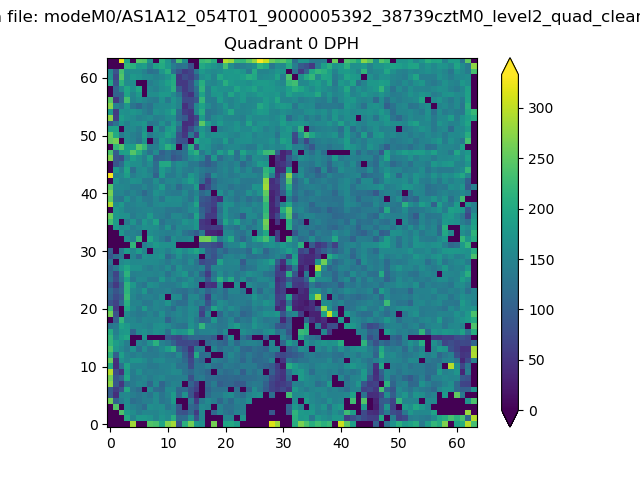 |
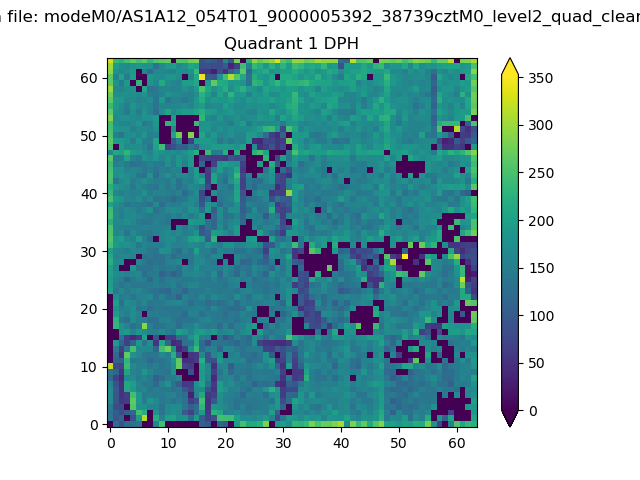 |
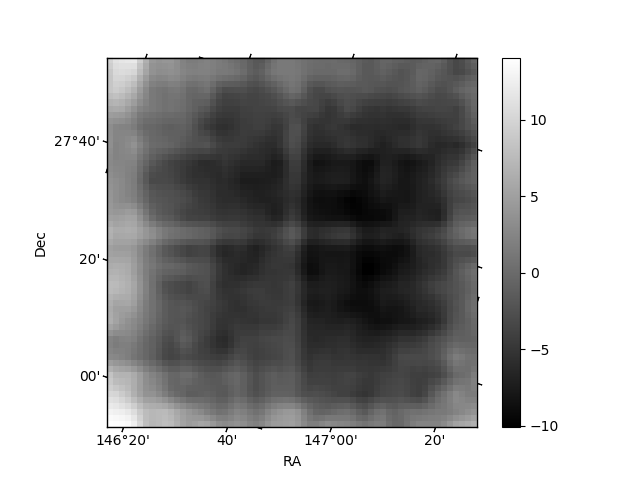
Quadrant B |
|---|---|---|---|
| Quadrant D | 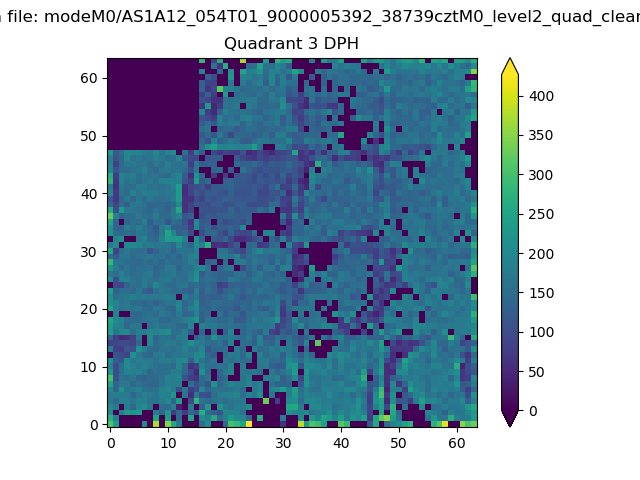 |
 |
Quadrant C |
| Plot type | Count rate plots | Images |
|---|---|---|
| Comparison with Poisson distribution Blue bars denote a histogram of data divided into 1 sec bins. Red curve is a Poisson curve with rate = median count rate of data. |
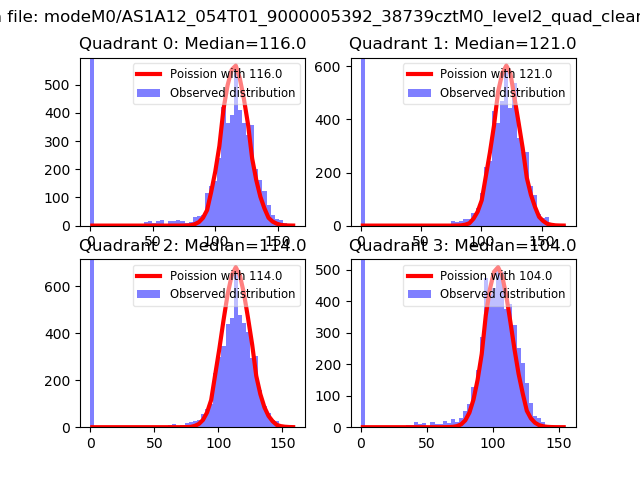 |
 |
| Quadrant-wise count rates Data is divided into 100 sec bins |
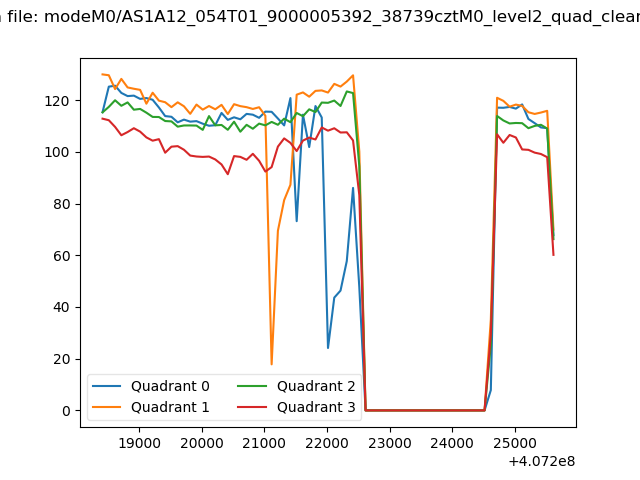 |
|
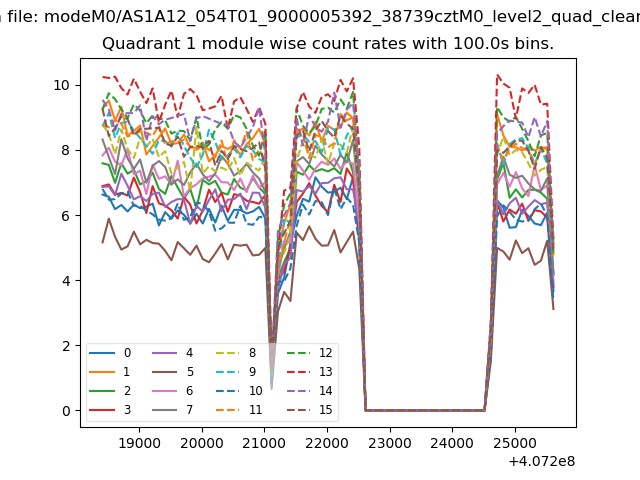
| Module-wise count rates for Quadrant A Data is divided into 100 sec bins |
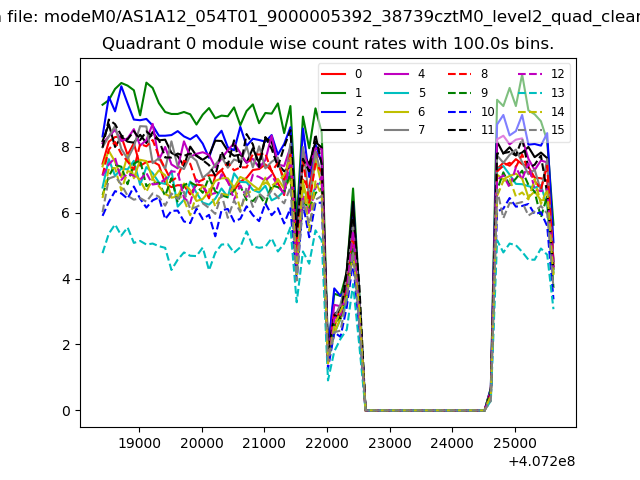 |
 |
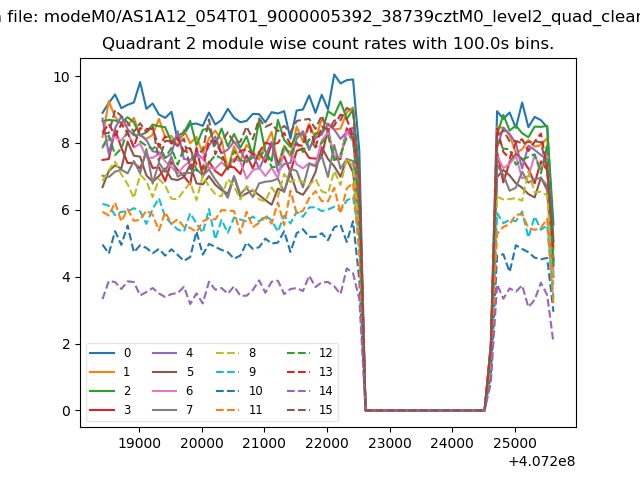
| Module-wise count rates for Quadrant B Data is divided into 100 sec bins |
 |
 |
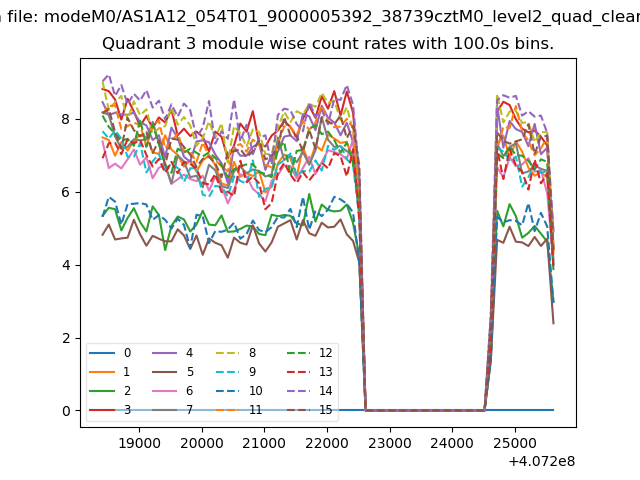
| Module-wise count rates for Quadrant C Data is divided into 100 sec bins |
 |
 |
| Module-wise count rates for Quadrant D Data is divided into 100 sec bins |
 |
 |
| Parameter | Plot |
|---|---|
| CZT HV Monitor | 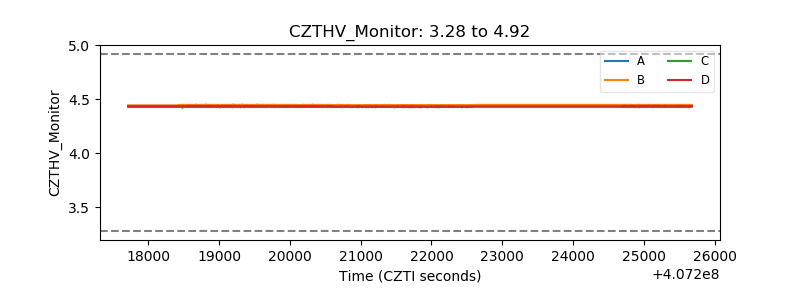 |
| D_VDD | 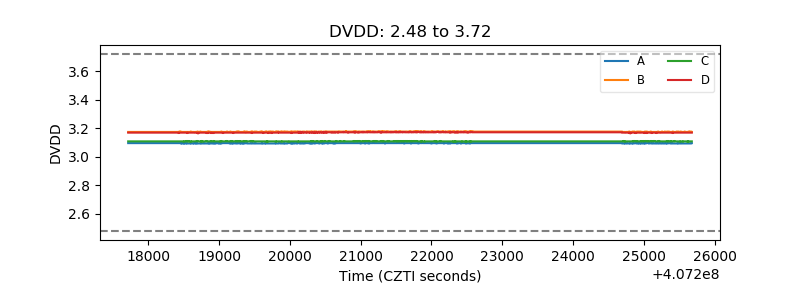 |
| Temperature 1 | 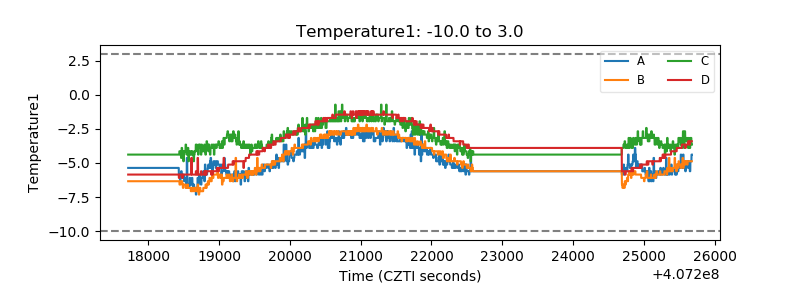 |
| Veto HV Monitor | 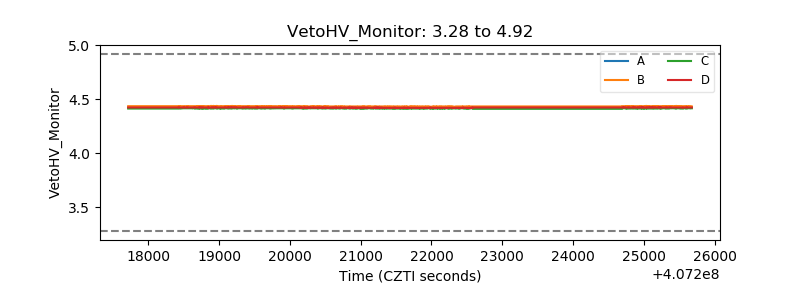 |
| Veto LLD | 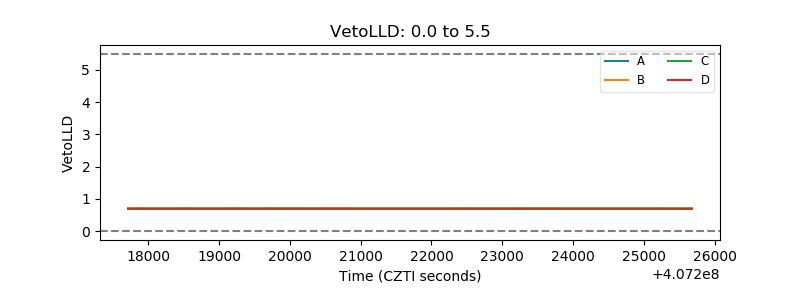 |
| Alpha Counter | 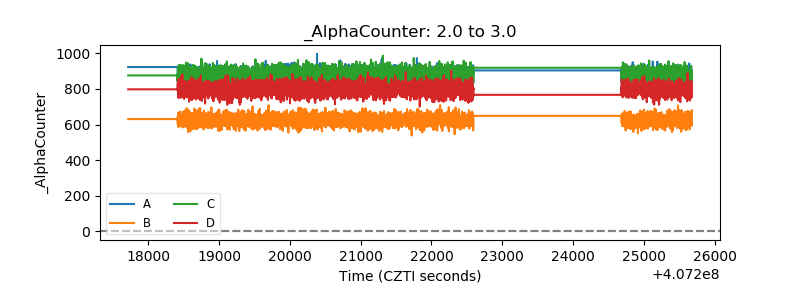 |
| _CPM_Rate | 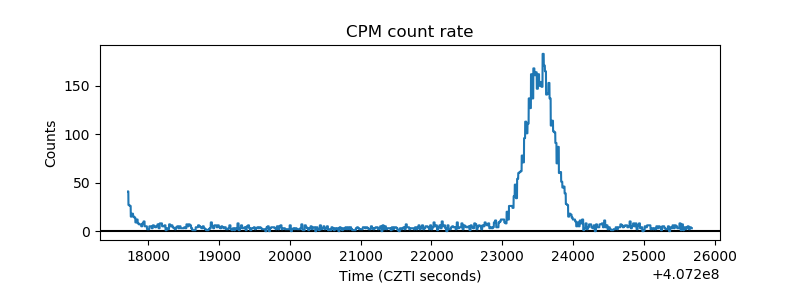 |
| CZT Counter | 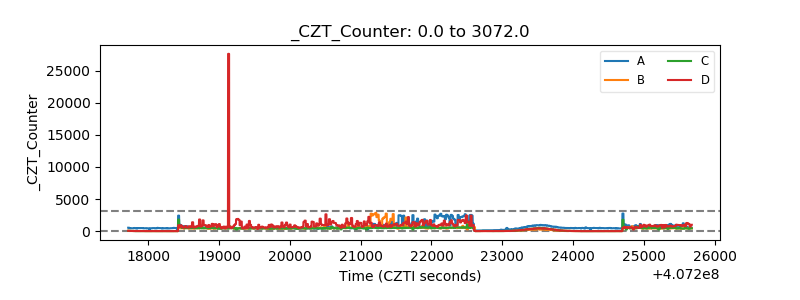 |
| +2.5 Volts monitor | 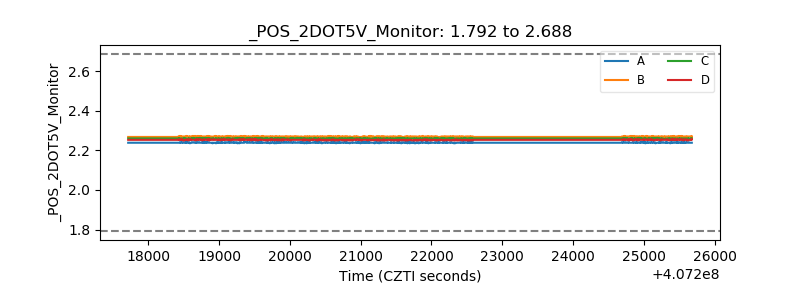 |
| +5 Volts monitor | 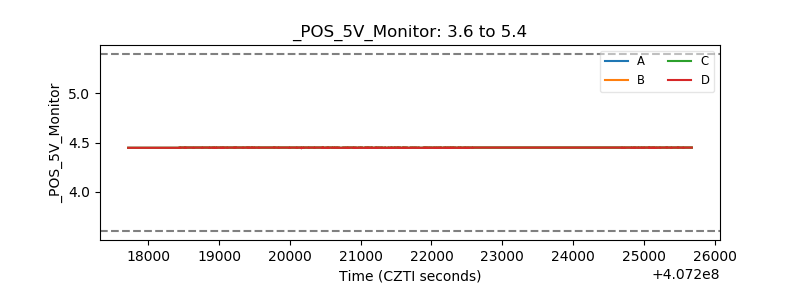 |
| _ROLL_ROT | 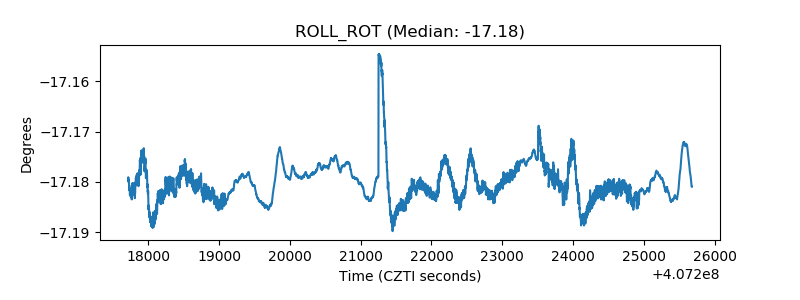 |
| _Roll_DEC | 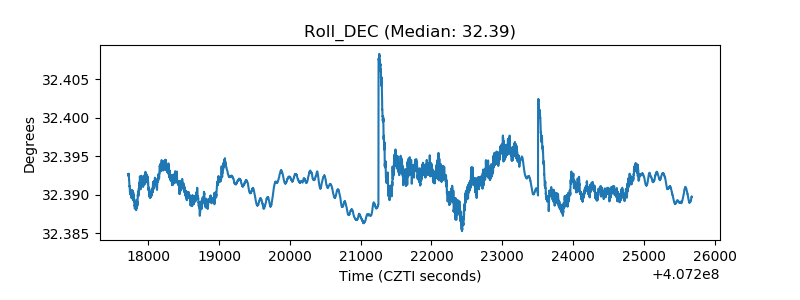 |
| _Roll_RA | 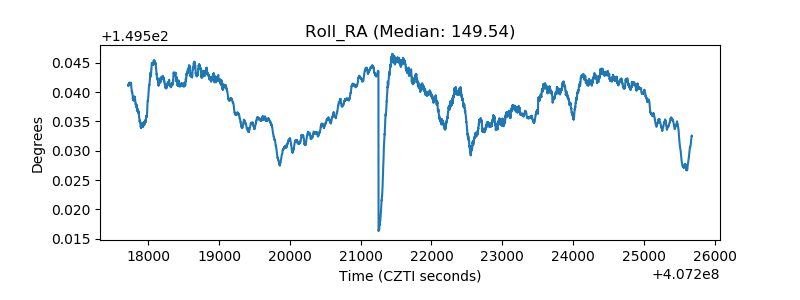 |
| Veto Counter | 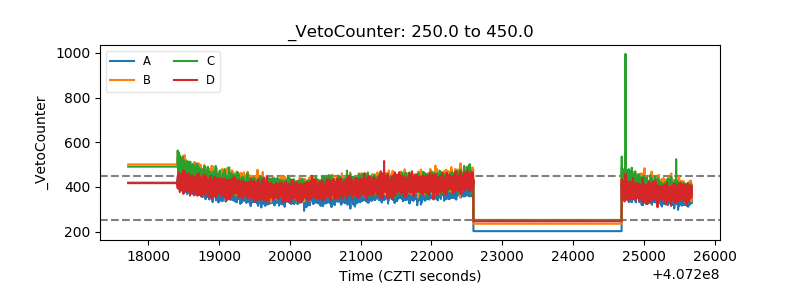 |