| Param | Original file | Final file |
|---|---|---|
| Filename | modeM0/AS1A12_054T01_9000005392_38740cztM0_level2.fits | modeM0/AS1A12_054T01_9000005392_38740cztM0_level2_quad_clean.evt |
| Size (bytes) | 378,360,000 | 87,269,760 |
| Size | 360.8 MB | 83.2 MB |
| Events in quadrant A | 3,091,018 | 592,686 |
| Events in quadrant B | 2,612,431 | 607,368 |
| Events in quadrant C | 3,024,829 | 567,522 |
| Events in quadrant D | 4,871,077 | 508,864 |
| Mode M9 | |||
|---|---|---|---|
| Quadrant | BADHDUFLAG | Total packets | Discarded packets |
| A | 0 | 30 | 0 |
| B | 0 | 30 | 0 |
| C | 0 | 30 | 0 |
| D | 0 | 31 | 0 |
| Mode SS | |||
|---|---|---|---|
| Quadrant | BADHDUFLAG | Total packets | Discarded packets |
| A | 0 | 106 | 0 |
| B | 0 | 106 | 0 |
| C | 0 | 106 | 0 |
| D | 0 | 106 | 0 |
| Mode M0 | |||
|---|---|---|---|
| Quadrant | BADHDUFLAG | Total packets | Discarded packets |
| A | 0 | 12256 | 3 |
| B | 0 | 11167 | 2 |
| C | 0 | 12287 | 2 |
| D | 0 | 18089 | 2 |
| Quadrant | Total seconds | Saturated seconds | Saturation percentage |
|---|---|---|---|
| A | 5227 | 40 | 0.765257% |
| B | 5227 | 32 | 0.612206% |
| C | 5227 | 93 | 1.779223% |
| D | 5227 | 301 | 5.758561% |
Noise dominated data is calculated using 1-second bins in cleaned event files. If a bin has >2000 counts, and if more than 50% of those come from <1% of pixels, then it is considered to be noise-dominated and hence unusable.
| Quadrant | # 1 sec bins | Bins with >0 counts | Bins with >2000 counts | High rate bins dominated by noise | Noise dominated (total time) | Noise dominated (detector-on time) | Marked lightcurve |
|---|---|---|---|---|---|---|---|
| A | 7080 | 5228 | 26 | 26 | 0.37% | 0.50% | 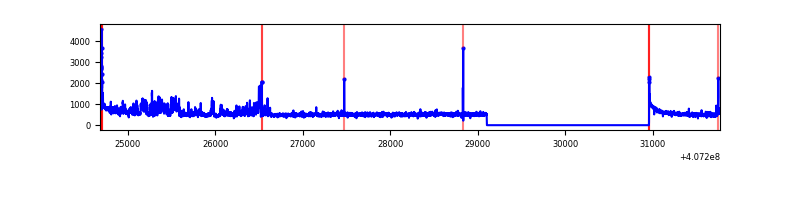 |
| B | 7080 | 5228 | 9 | 9 | 0.13% | 0.17% | 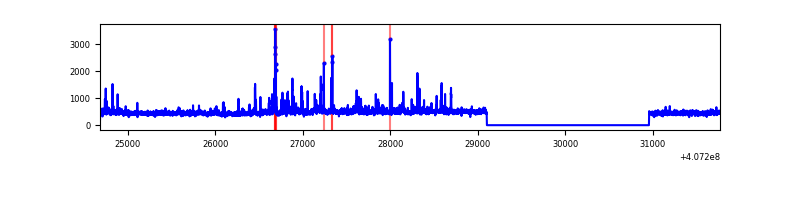 |
| C | 7080 | 5228 | 83 | 83 | 1.17% | 1.59% | 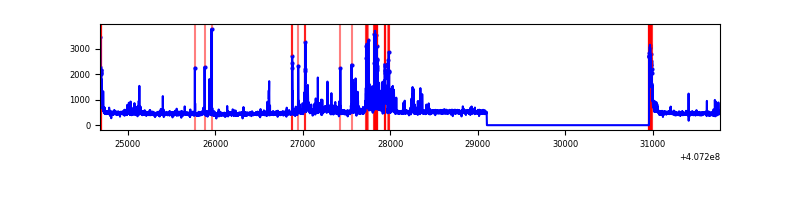 |
| D | 7080 | 5228 | 236 | 236 | 3.33% | 4.51% | 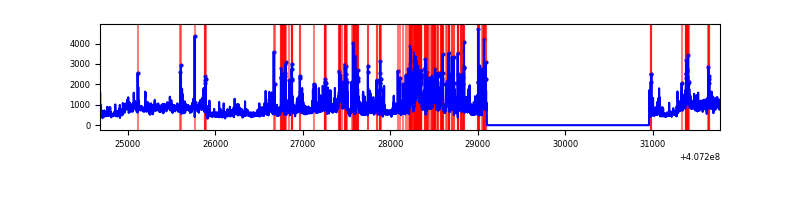 |
Top three noisy pixels from each quadrant. If the there are fewer than three noisy pixels in the level2.evt file, extra rows are filled as -1
| Pixel properties | Quadrant properties | ||||||
|---|---|---|---|---|---|---|---|
| Quadrant | DetID | PixID | Counts | Sigma | Mean | Median | Sigma |
| A | 0 | 8 | 396560 | 3294.42 | 588 | 575 | 120.2 |
| A | 10 | 83 | 387223 | 3216.74 | 588 | 575 | 120.2 |
| A | 9 | 143 | 30701 | 250.63 | 588 | 575 | 120.2 |
| B | 4 | 171 | 175581 | 1530.02 | 583 | 567 | 114.4 |
| B | 0 | 189 | 110653 | 962.4 | 583 | 567 | 114.4 |
| B | 12 | 111 | 14192 | 119.11 | 583 | 567 | 114.4 |
| C | 14 | 254 | 399298 | 3000.86 | 568 | 571 | 132.9 |
| C | 15 | 214 | 233700 | 1754.55 | 568 | 571 | 132.9 |
| C | 0 | 10 | 127824 | 957.72 | 568 | 571 | 132.9 |
| D | 2 | 16 | 988368 | 7052.94 | 564 | 548 | 140.1 |
| D | 2 | 249 | 825732 | 5891.73 | 564 | 548 | 140.1 |
| D | 12 | 235 | 329103 | 2345.85 | 564 | 548 | 140.1 |
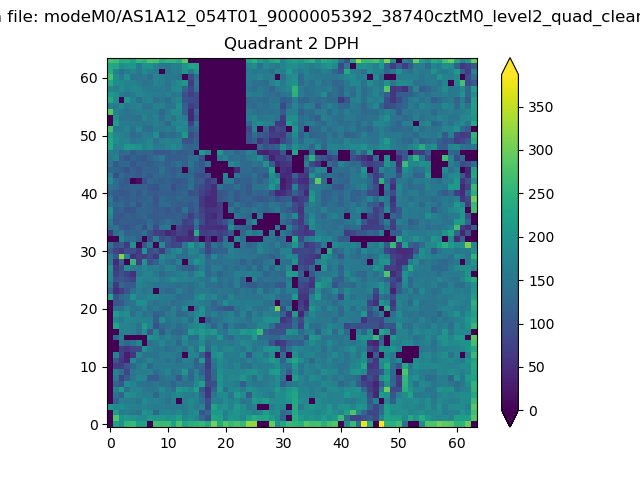
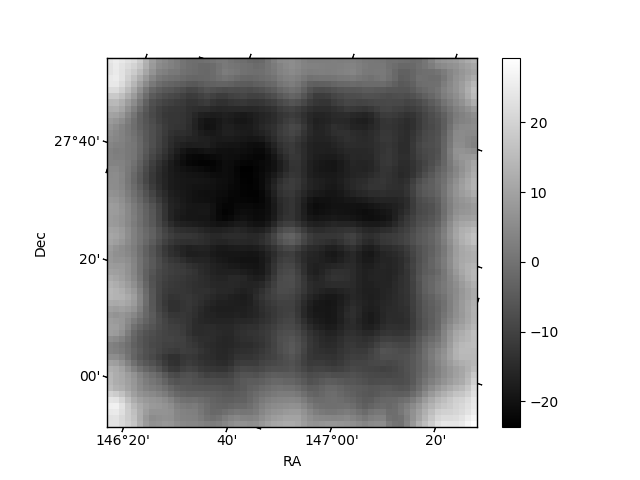
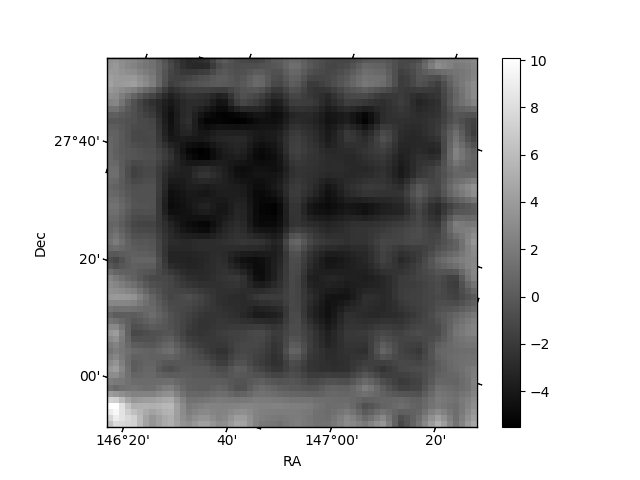
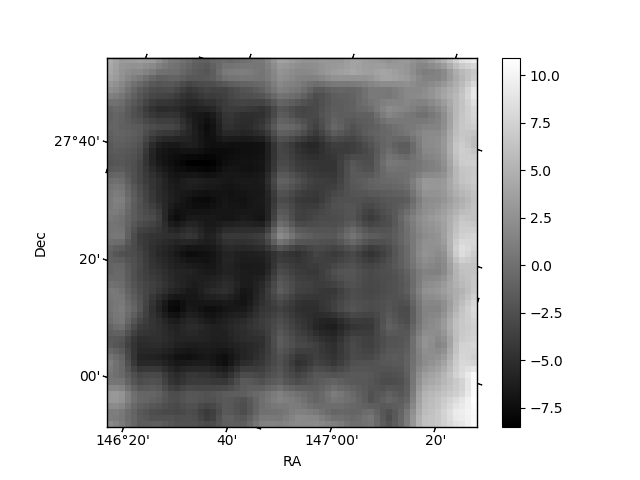
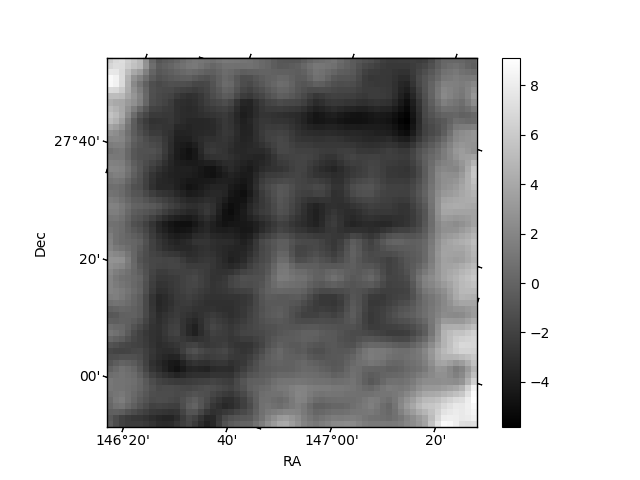
Histogram calculated using DETX and DETY for each event in the final _common_clean file
| Quadrant A | 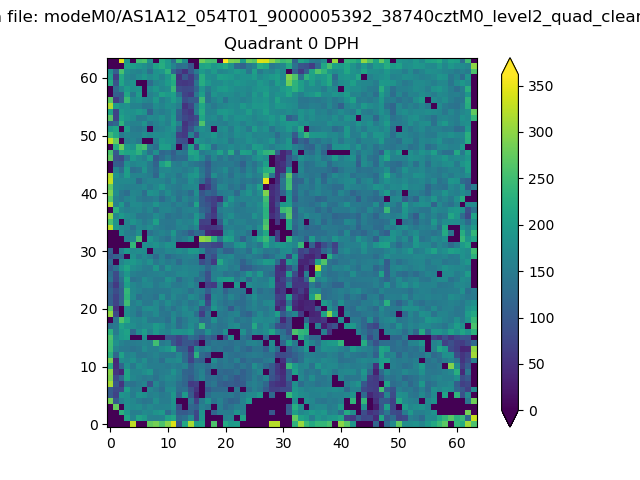 |
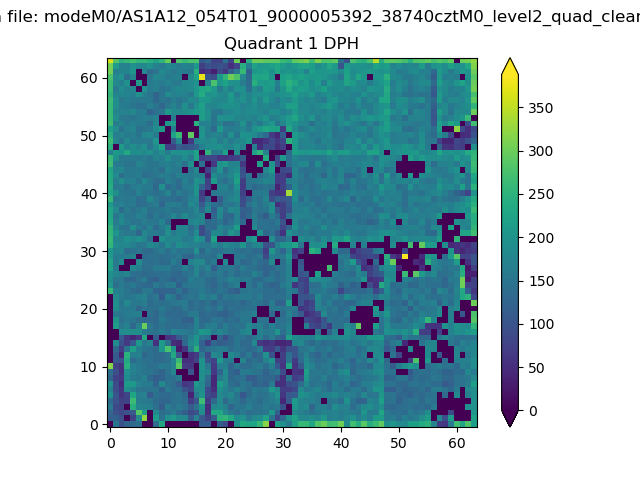 |
Quadrant B |
|---|---|---|---|
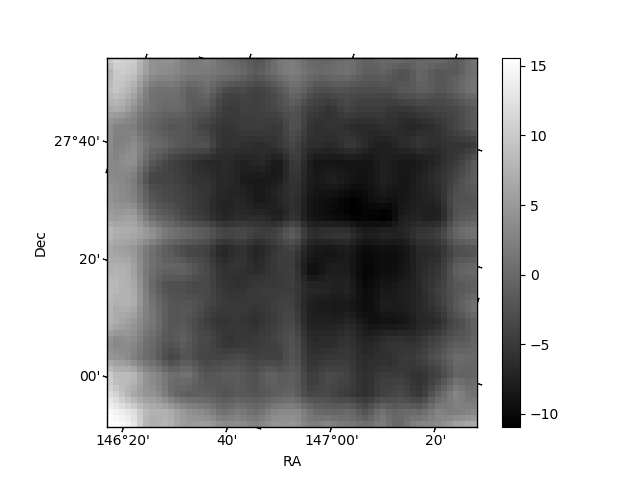
| Quadrant D | 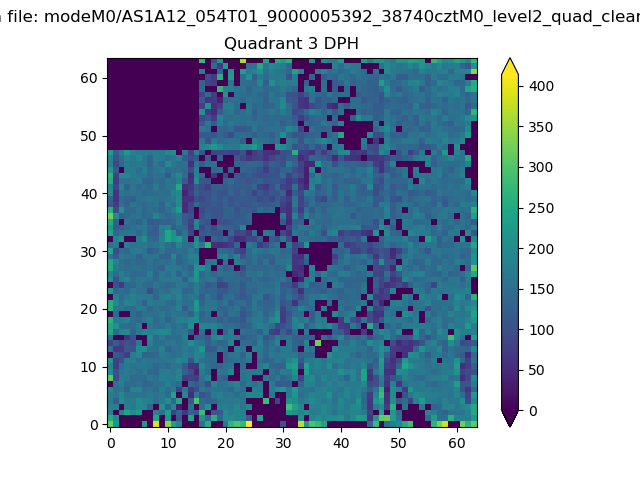 |
 |
Quadrant C |
| Plot type | Count rate plots | Images |
|---|---|---|
| Comparison with Poisson distribution Blue bars denote a histogram of data divided into 1 sec bins. Red curve is a Poisson curve with rate = median count rate of data. |
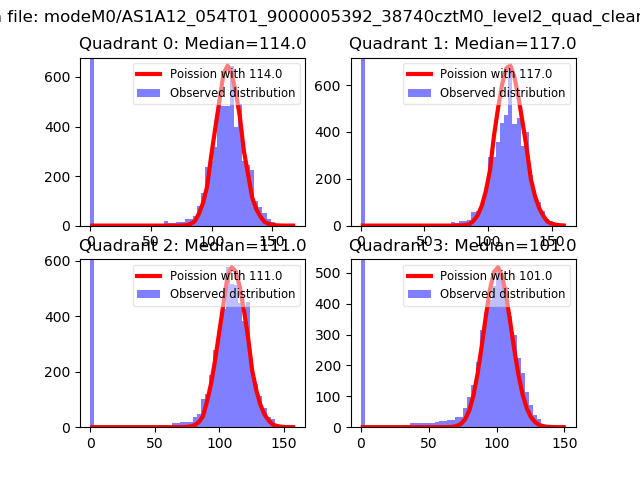 |
 |
| Quadrant-wise count rates Data is divided into 100 sec bins |
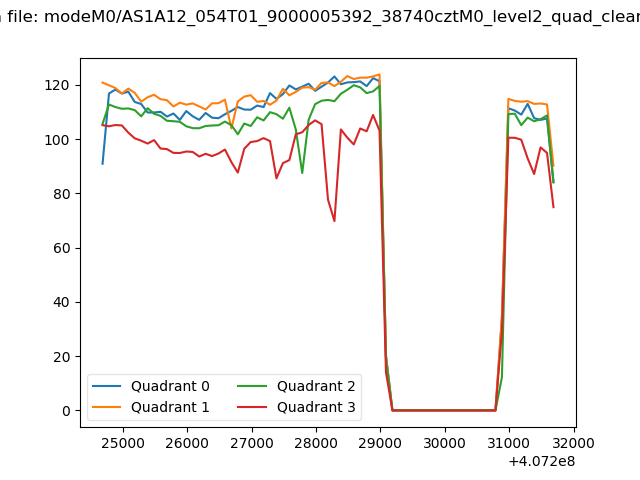 |
|
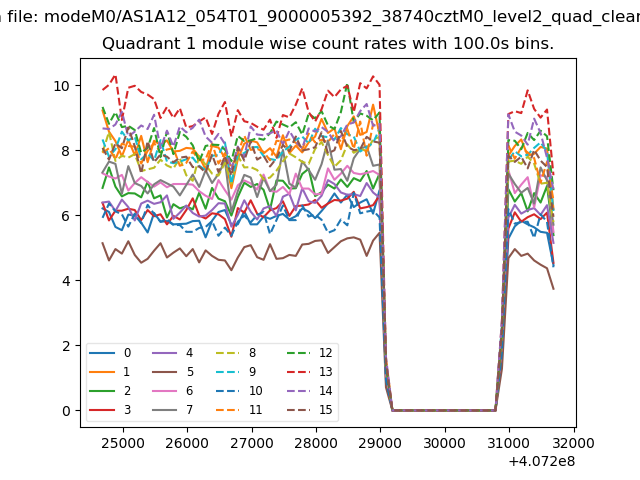
| Module-wise count rates for Quadrant A Data is divided into 100 sec bins |
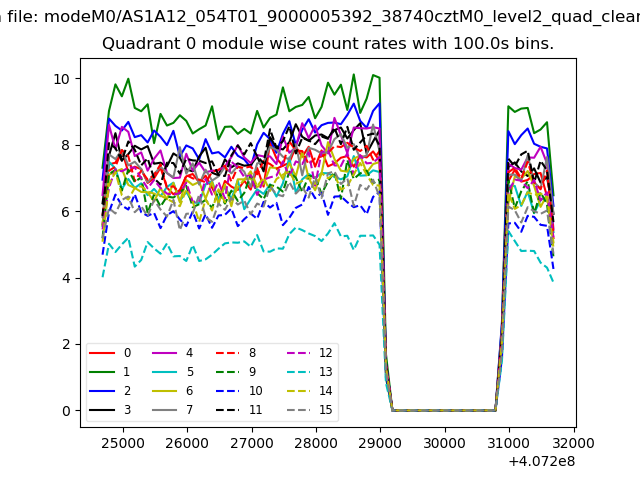 |
 |
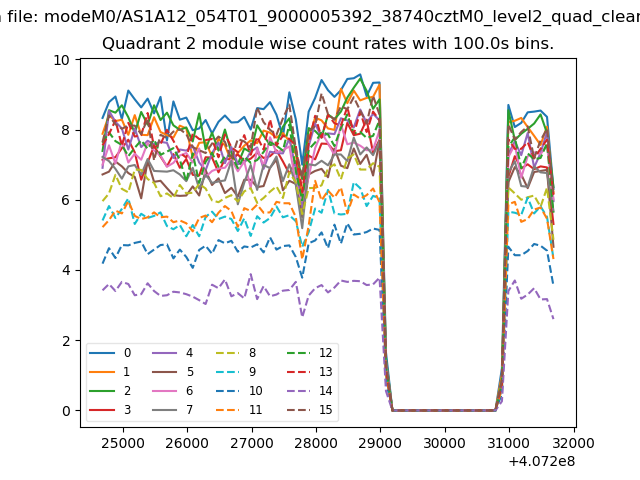
| Module-wise count rates for Quadrant B Data is divided into 100 sec bins |
 |
 |
| Module-wise count rates for Quadrant C Data is divided into 100 sec bins |
 |
 |
| Module-wise count rates for Quadrant D Data is divided into 100 sec bins |
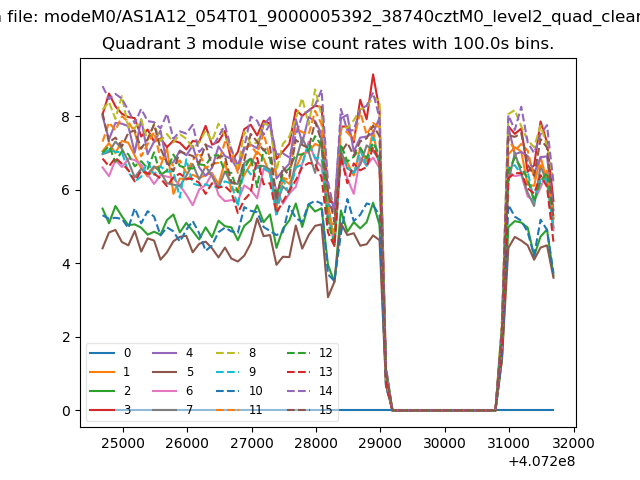 |
 |
| Parameter | Plot |
|---|---|
| CZT HV Monitor | 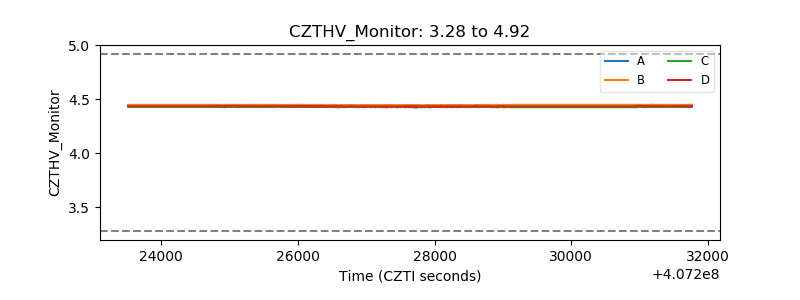 |
| D_VDD | 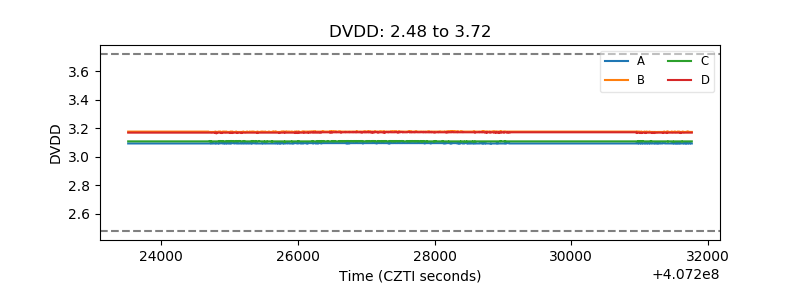 |
| Temperature 1 | 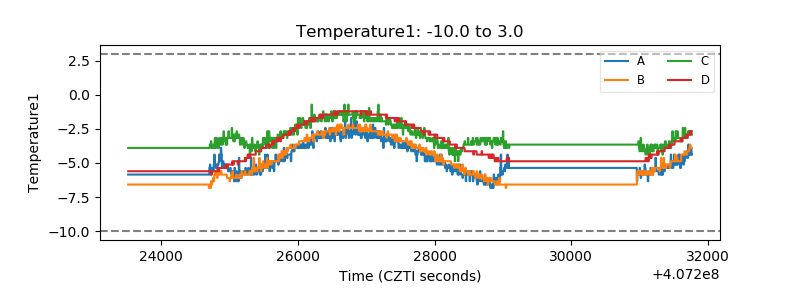 |
| Veto HV Monitor | 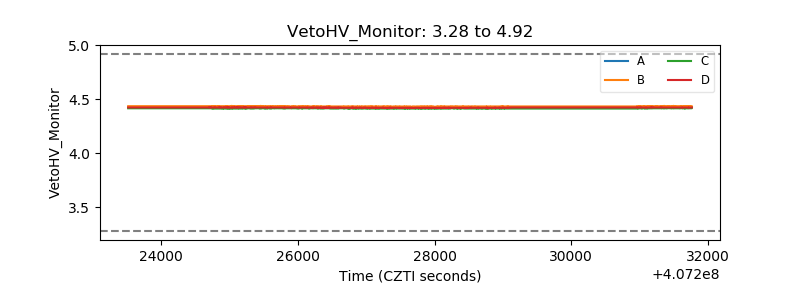 |
| Veto LLD | 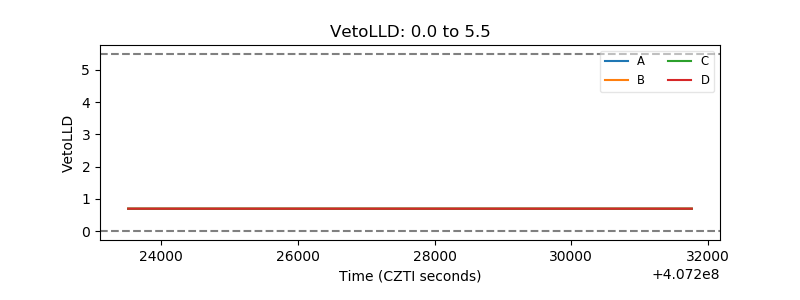 |
| Alpha Counter | 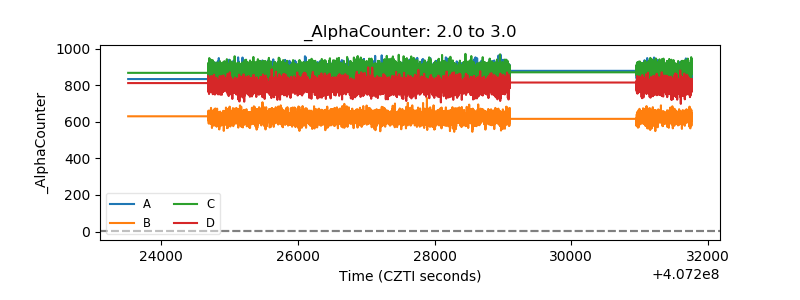 |
| _CPM_Rate | 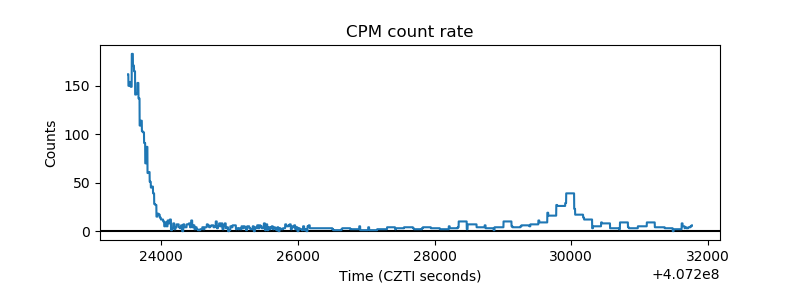 |
| CZT Counter | 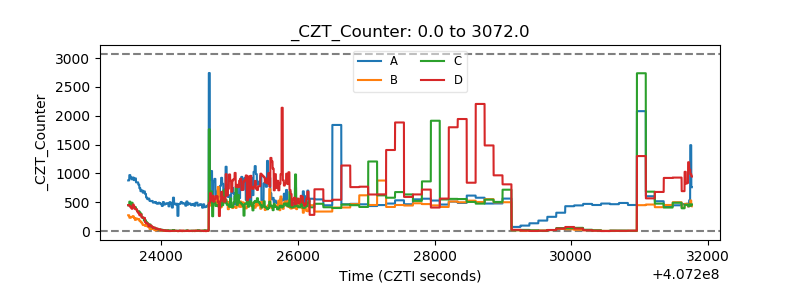 |
| +2.5 Volts monitor | 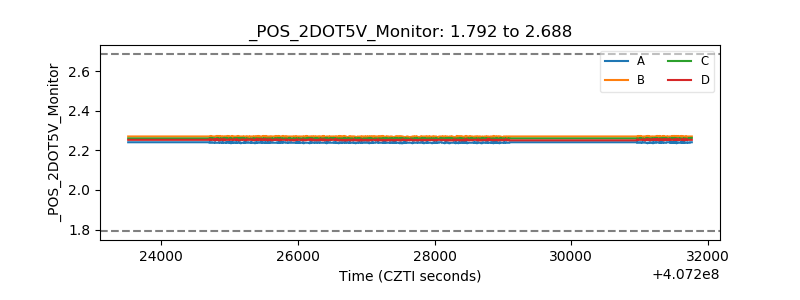 |
| +5 Volts monitor | 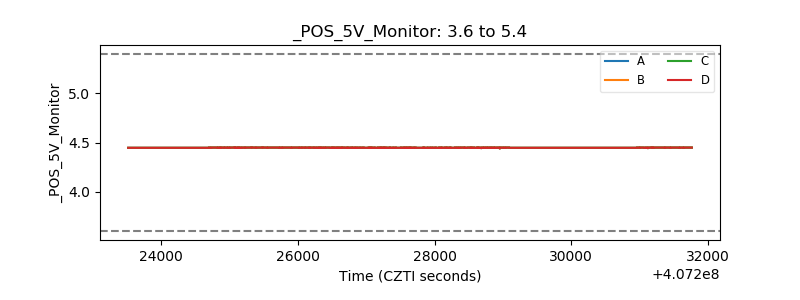 |
| _ROLL_ROT | 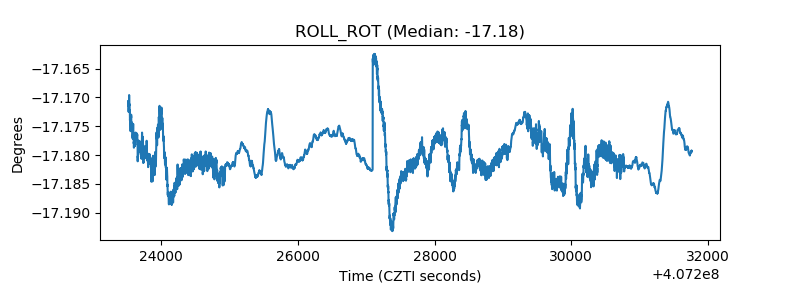 |
| _Roll_DEC | 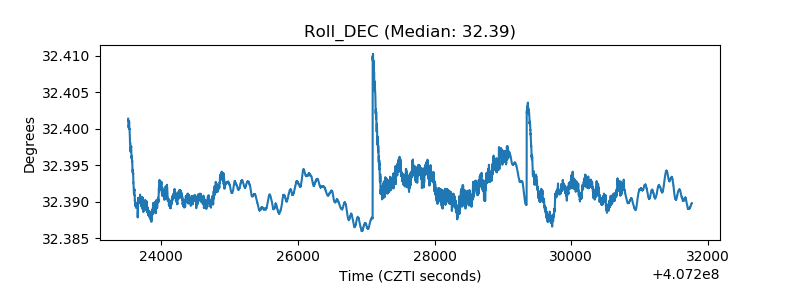 |
| _Roll_RA | 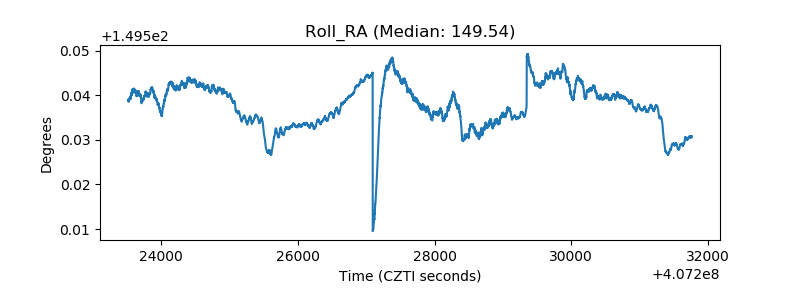 |
| Veto Counter | 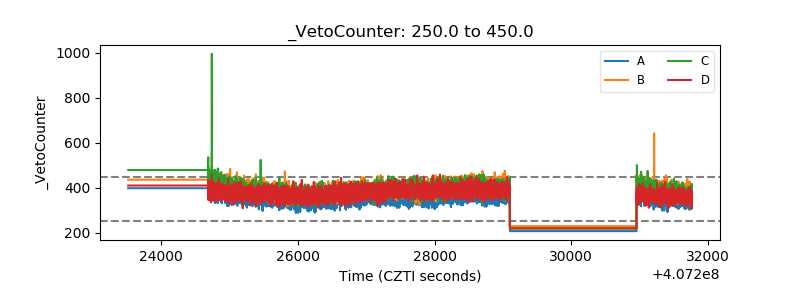 |