| Param | Original file | Final file |
|---|---|---|
| Filename | modeM0/AS1A12_054T01_9000005392_38742cztM0_level2.fits | modeM0/AS1A12_054T01_9000005392_38742cztM0_level2_quad_clean.evt |
| Size (bytes) | 382,150,080 | 93,539,520 |
| Size | 364.4 MB | 89.2 MB |
| Events in quadrant A | 2,974,869 | 633,452 |
| Events in quadrant B | 3,304,304 | 638,310 |
| Events in quadrant C | 2,870,026 | 607,326 |
| Events in quadrant D | 4,553,707 | 554,776 |
| Mode M9 | |||
|---|---|---|---|
| Quadrant | BADHDUFLAG | Total packets | Discarded packets |
| A | 0 | 13 | 0 |
| B | 0 | 13 | 0 |
| C | 0 | 13 | 0 |
| D | 0 | 14 | 0 |
| Mode SS | |||
|---|---|---|---|
| Quadrant | BADHDUFLAG | Total packets | Discarded packets |
| A | 0 | 116 | 0 |
| B | 0 | 116 | 0 |
| C | 0 | 116 | 0 |
| D | 0 | 116 | 0 |
| Mode M0 | |||
|---|---|---|---|
| Quadrant | BADHDUFLAG | Total packets | Discarded packets |
| A | 0 | 12153 | 3 |
| B | 0 | 13573 | 2 |
| C | 0 | 11948 | 2 |
| D | 0 | 17542 | 2 |
| Quadrant | Total seconds | Saturated seconds | Saturation percentage |
|---|---|---|---|
| A | 5698 | 14 | 0.245700% |
| B | 5698 | 79 | 1.386451% |
| C | 5698 | 34 | 0.596701% |
| D | 5698 | 141 | 2.474552% |
Noise dominated data is calculated using 1-second bins in cleaned event files. If a bin has >2000 counts, and if more than 50% of those come from <1% of pixels, then it is considered to be noise-dominated and hence unusable.
| Quadrant | # 1 sec bins | Bins with >0 counts | Bins with >2000 counts | High rate bins dominated by noise | Noise dominated (total time) | Noise dominated (detector-on time) | Marked lightcurve |
|---|---|---|---|---|---|---|---|
| A | 7041 | 5699 | 8 | 8 | 0.11% | 0.14% | 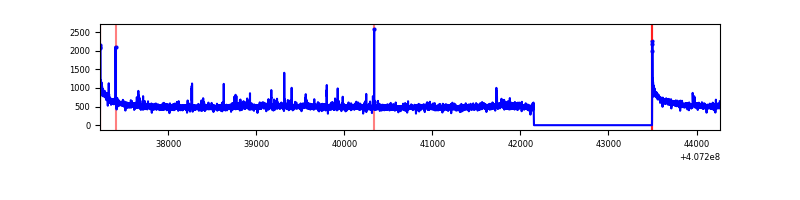 |
| B | 7041 | 5699 | 41 | 41 | 0.58% | 0.72% | 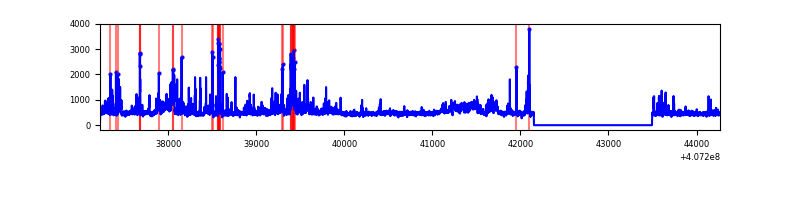 |
| C | 7041 | 5699 | 31 | 31 | 0.44% | 0.54% | 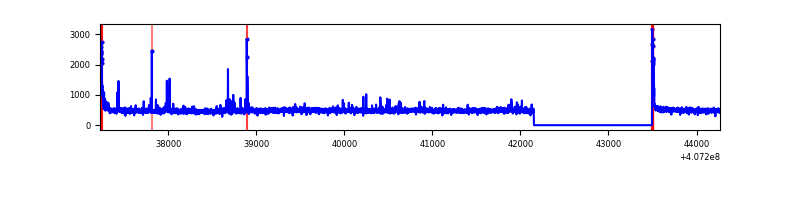 |
| D | 7041 | 5699 | 109 | 109 | 1.55% | 1.91% | 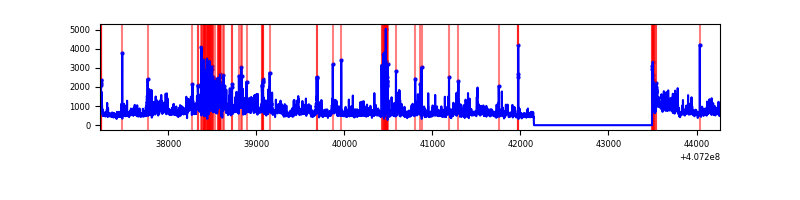 |
Top three noisy pixels from each quadrant. If the there are fewer than three noisy pixels in the level2.evt file, extra rows are filled as -1
| Pixel properties | Quadrant properties | ||||||
|---|---|---|---|---|---|---|---|
| Quadrant | DetID | PixID | Counts | Sigma | Mean | Median | Sigma |
| A | 10 | 83 | 424242 | 3242.92 | 641 | 628 | 130.6 |
| A | 15 | 223 | 45789 | 345.72 | 641 | 628 | 130.6 |
| A | 9 | 143 | 11901 | 86.3 | 641 | 628 | 130.6 |
| B | 4 | 171 | 343574 | 2761.74 | 634 | 617 | 124.2 |
| B | 5 | 184 | 237786 | 1909.85 | 634 | 617 | 124.2 |
| B | 0 | 189 | 120706 | 967.04 | 634 | 617 | 124.2 |
| C | 15 | 214 | 253006 | 1728.1 | 622 | 624 | 146.0 |
| C | 0 | 10 | 99770 | 678.87 | 622 | 624 | 146.0 |
| C | 14 | 254 | 47940 | 323.98 | 622 | 624 | 146.0 |
| D | 12 | 235 | 1105604 | 7273.79 | 616 | 598 | 151.9 |
| D | 2 | 16 | 384622 | 2527.87 | 616 | 598 | 151.9 |
| D | 12 | 227 | 178917 | 1173.8 | 616 | 598 | 151.9 |
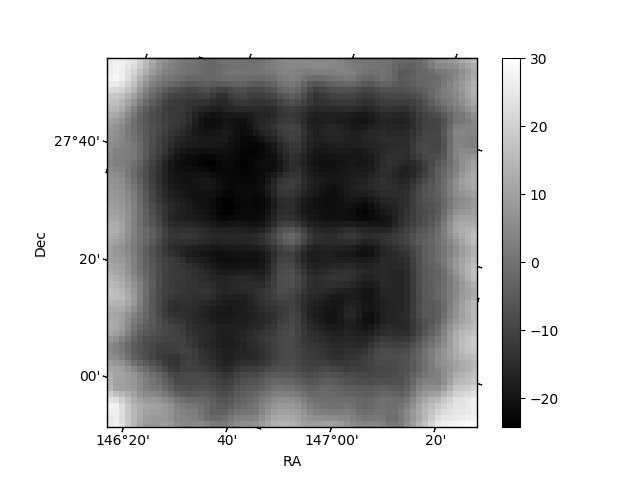
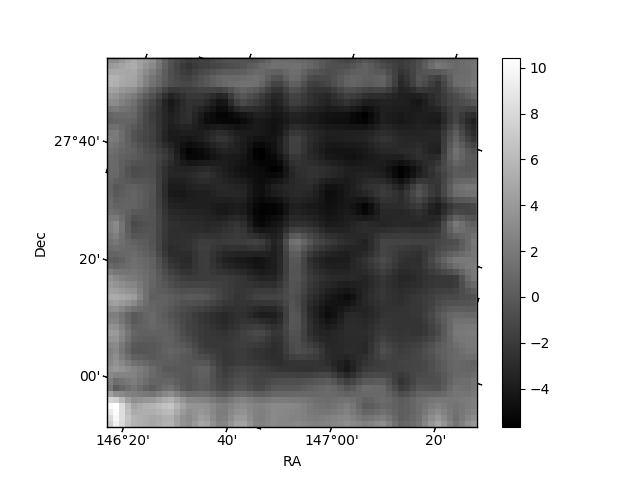
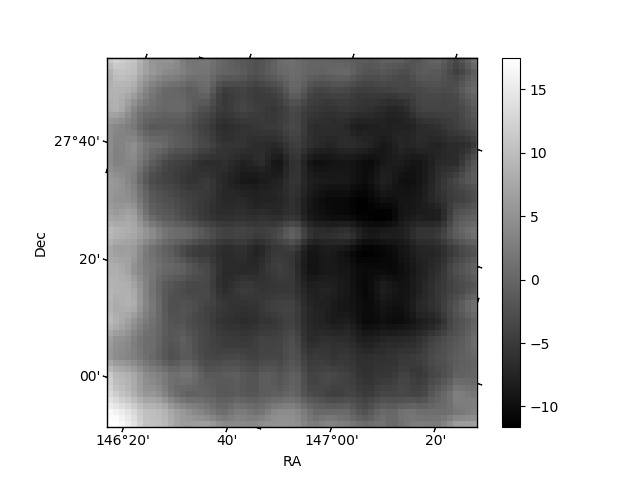
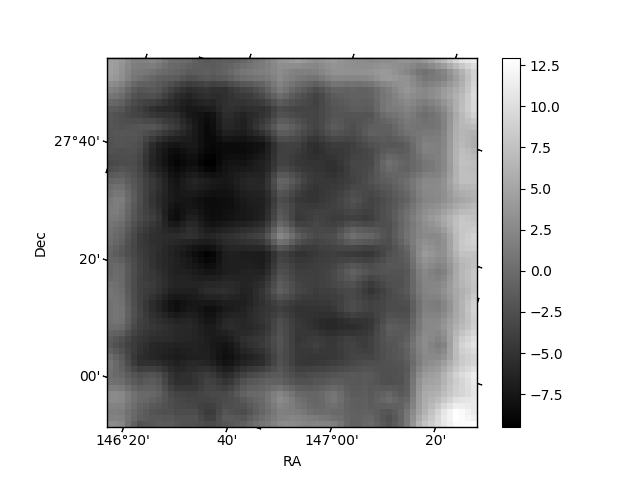
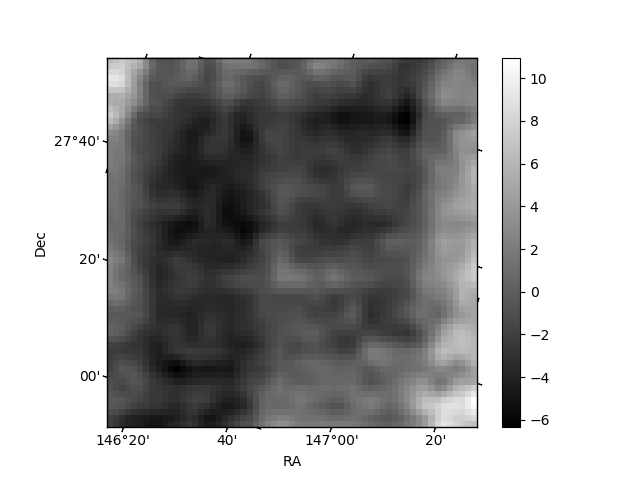
Histogram calculated using DETX and DETY for each event in the final _common_clean file
| Quadrant A | 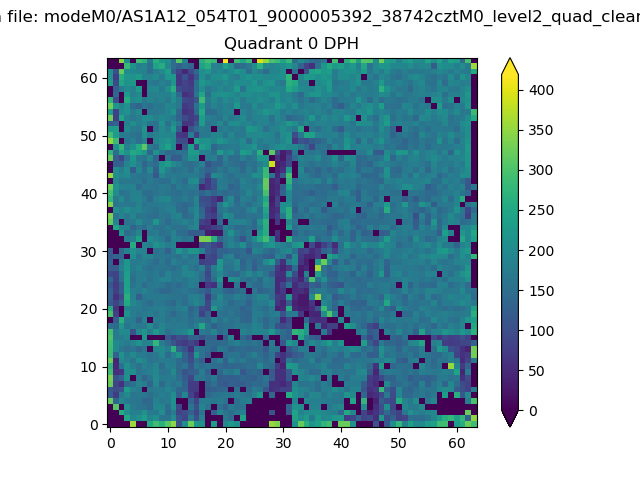 |
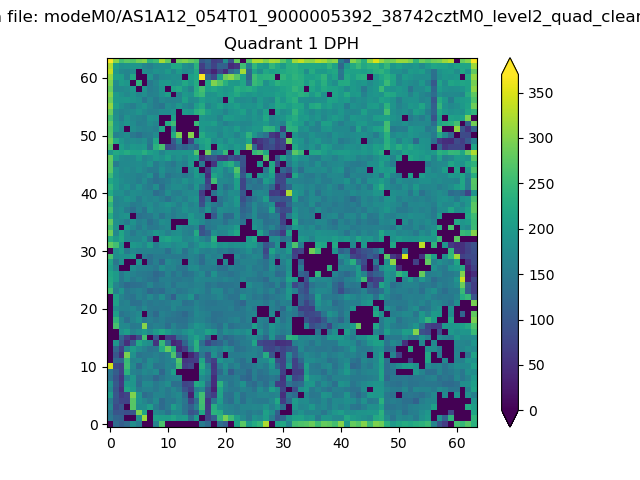 |
Quadrant B |
|---|---|---|---|
| Quadrant D | 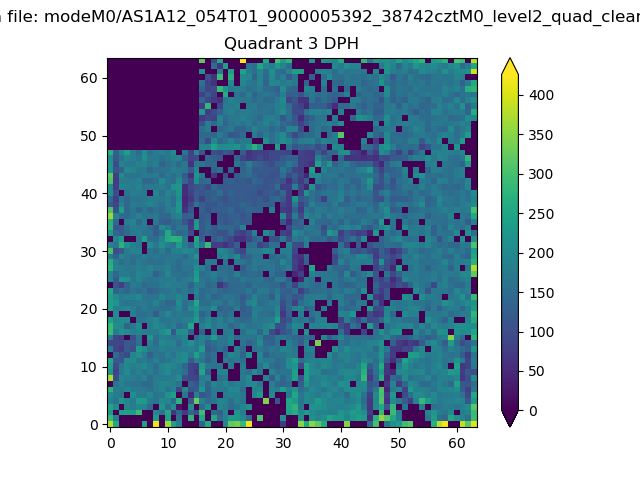 |
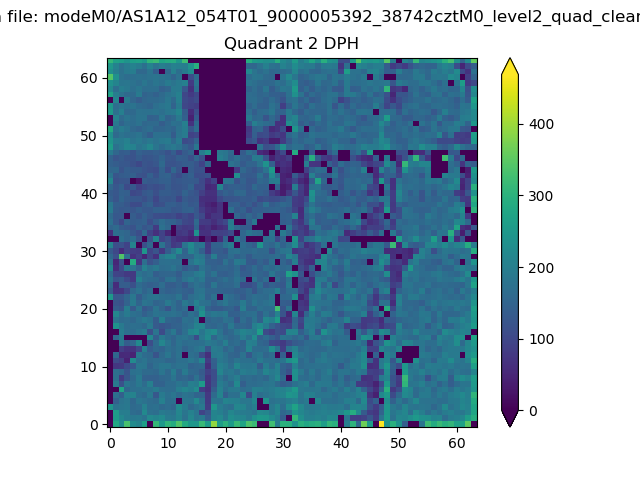 |
Quadrant C |
| Plot type | Count rate plots | Images |
|---|---|---|
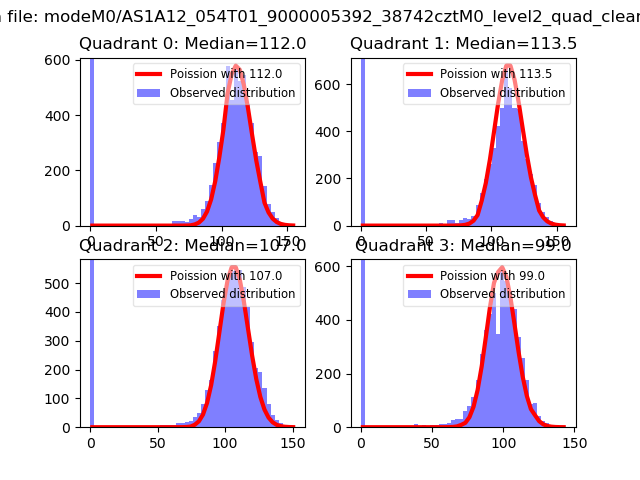
| Comparison with Poisson distribution Blue bars denote a histogram of data divided into 1 sec bins. Red curve is a Poisson curve with rate = median count rate of data. |
 |
 |
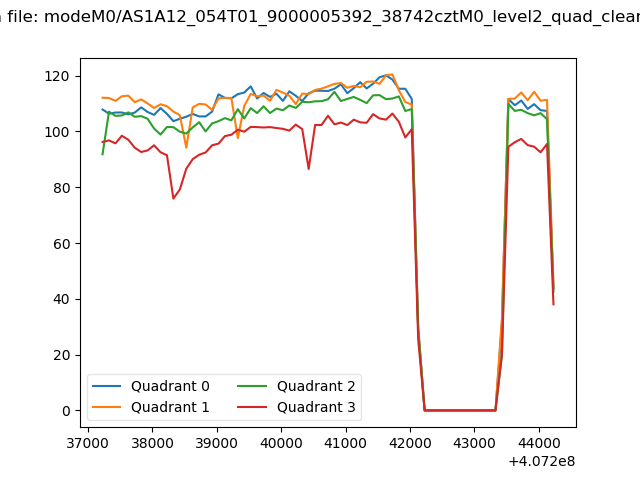
| Quadrant-wise count rates Data is divided into 100 sec bins |
 |
|
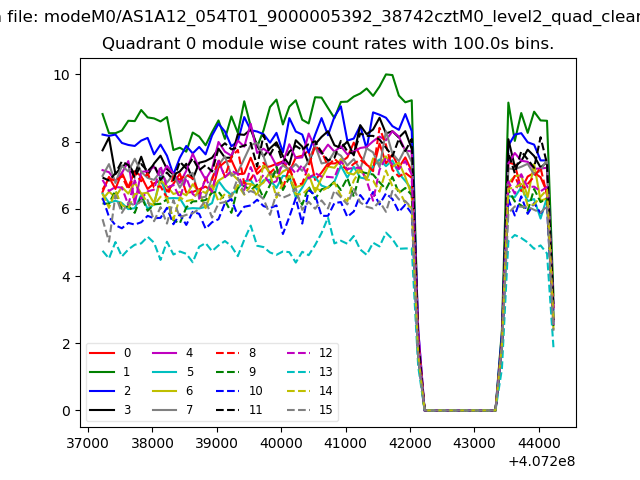
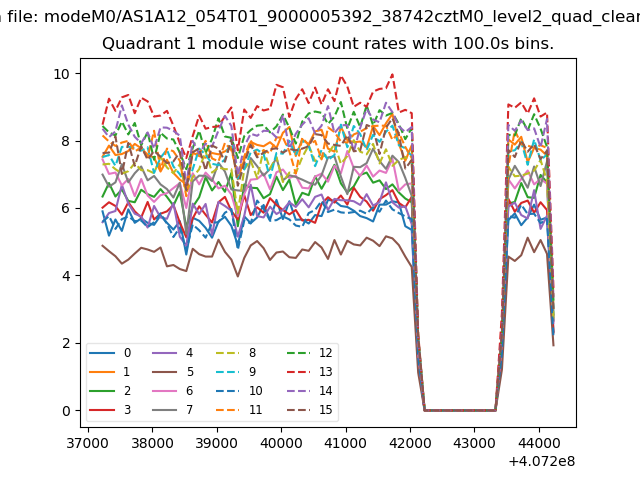
| Module-wise count rates for Quadrant A Data is divided into 100 sec bins |
 |
 |
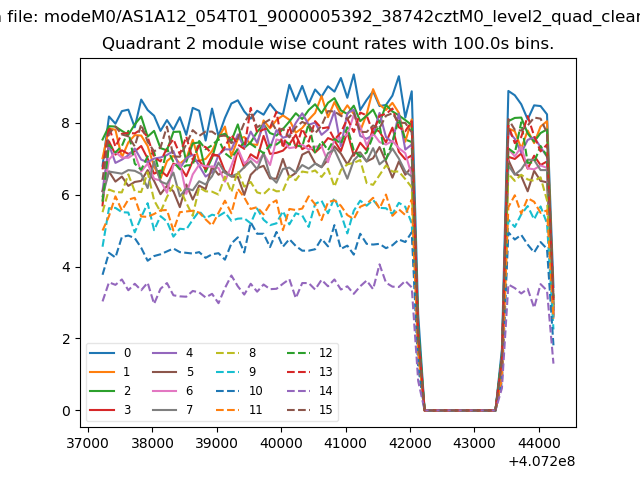
| Module-wise count rates for Quadrant B Data is divided into 100 sec bins |
 |
 |
| Module-wise count rates for Quadrant C Data is divided into 100 sec bins |
 |
 |
| Module-wise count rates for Quadrant D Data is divided into 100 sec bins |
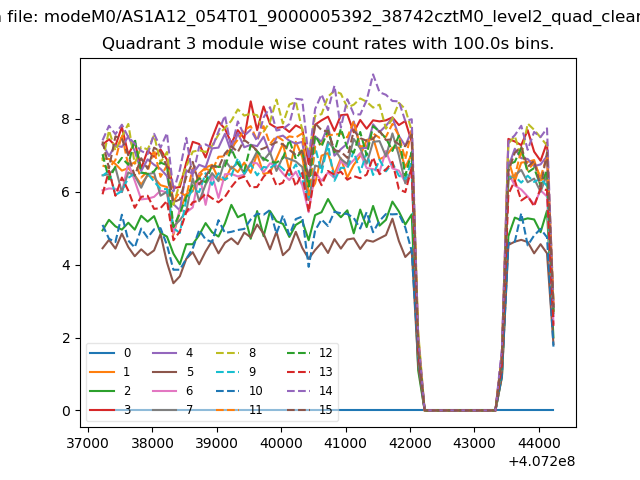 |
 |
| Parameter | Plot |
|---|---|
| CZT HV Monitor | 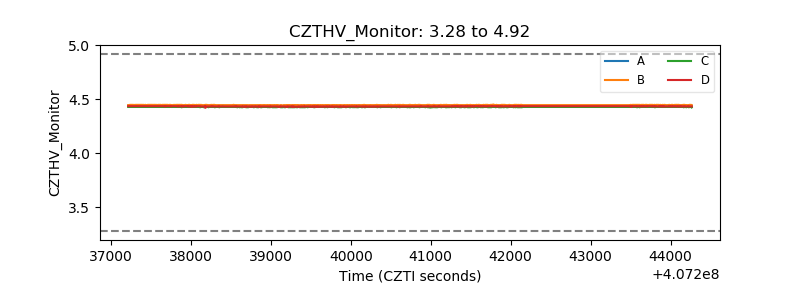 |
| D_VDD | 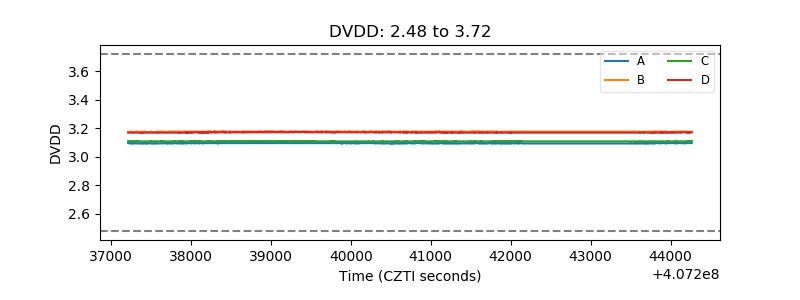 |
| Temperature 1 | 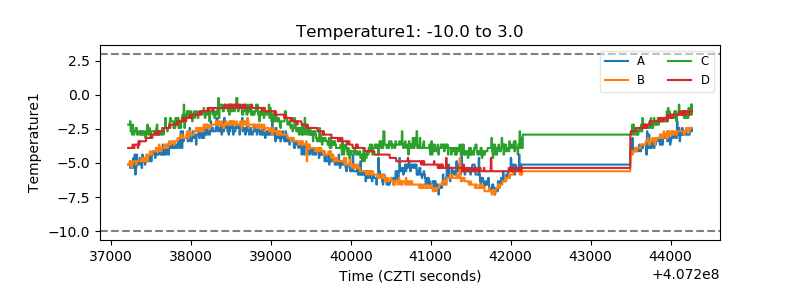 |
| Veto HV Monitor | 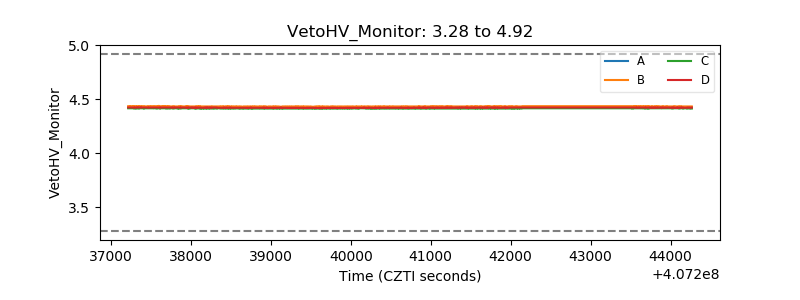 |
| Veto LLD | 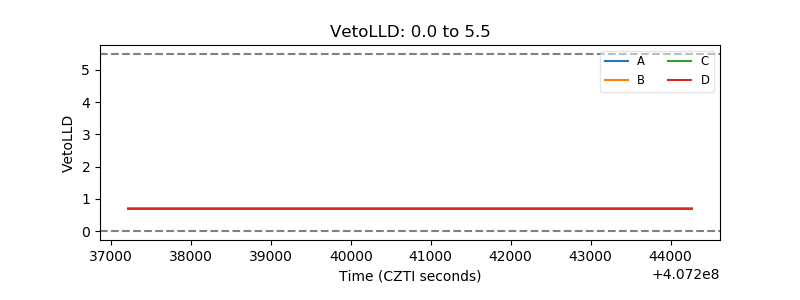 |
| Alpha Counter | 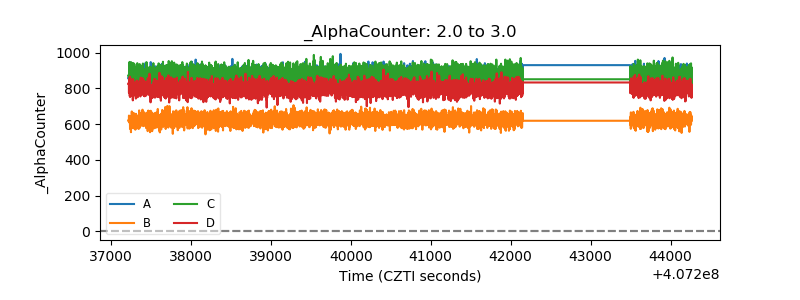 |
| _CPM_Rate | 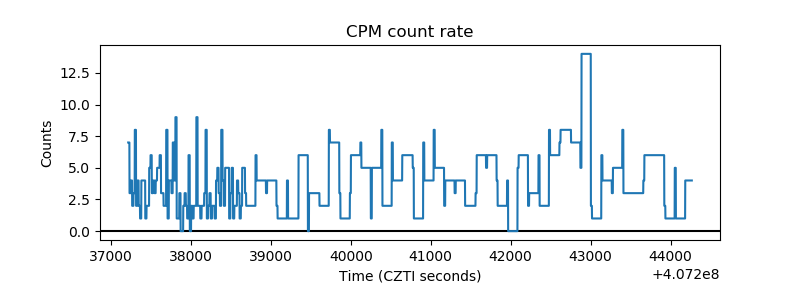 |
| CZT Counter | 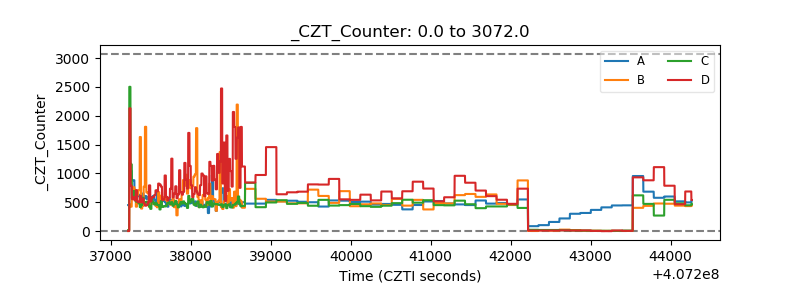 |
| +2.5 Volts monitor | 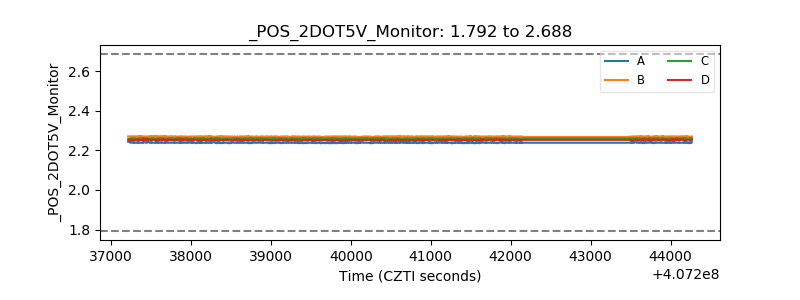 |
| +5 Volts monitor | 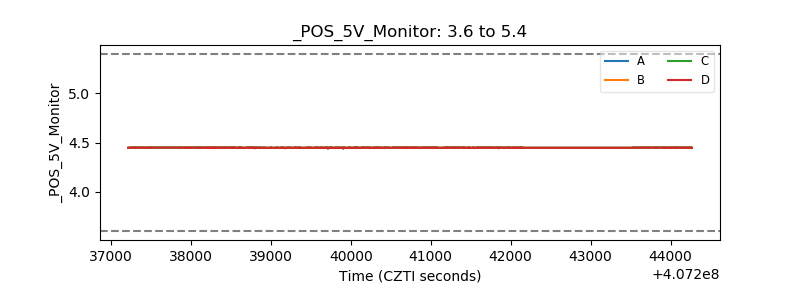 |
| _ROLL_ROT | 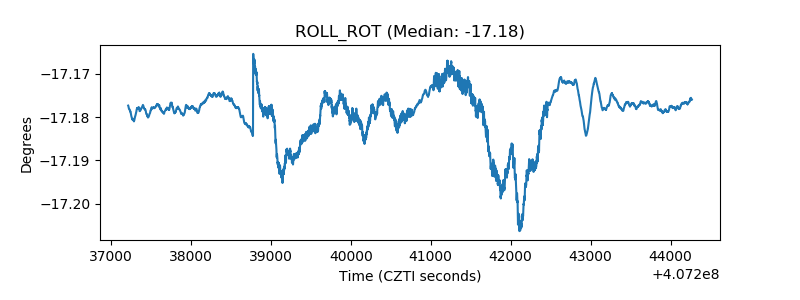 |
| _Roll_DEC | 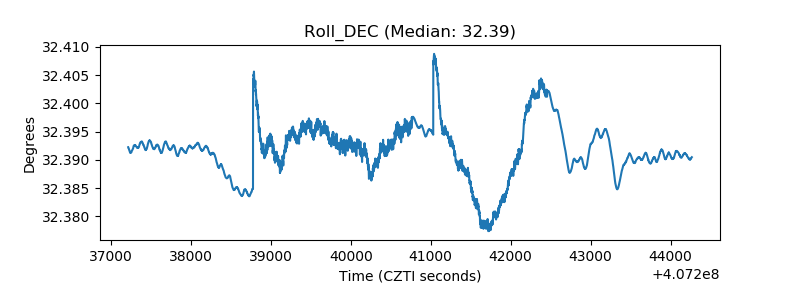 |
| _Roll_RA | 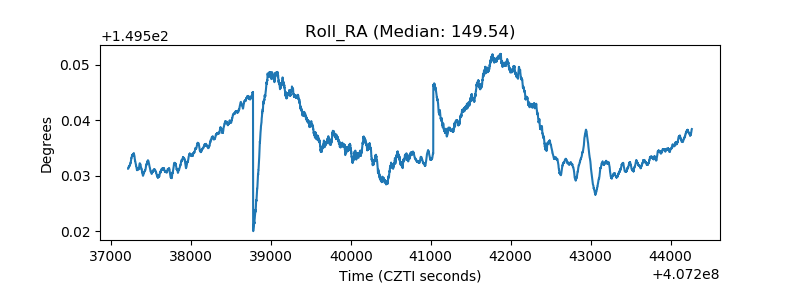 |
| Veto Counter | 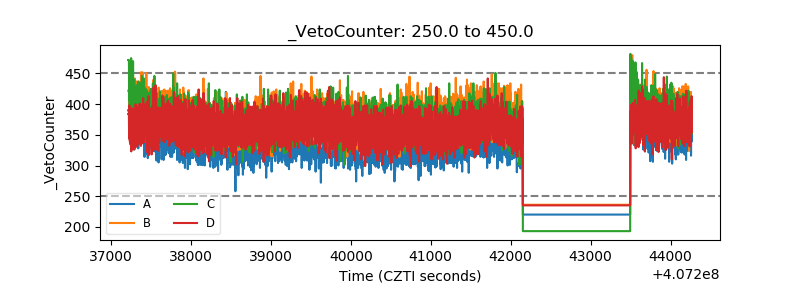 |