| Param | Original file | Final file |
|---|---|---|
| Filename | modeM0/AS1A12_054T01_9000005392_38743cztM0_level2.fits | modeM0/AS1A12_054T01_9000005392_38743cztM0_level2_quad_clean.evt |
| Size (bytes) | 341,072,640 | 84,623,040 |
| Size | 325.3 MB | 80.7 MB |
| Events in quadrant A | 2,632,281 | 575,896 |
| Events in quadrant B | 2,343,449 | 580,605 |
| Events in quadrant C | 2,614,021 | 547,072 |
| Events in quadrant D | 4,636,014 | 498,523 |
| Mode M9 | |||
|---|---|---|---|
| Quadrant | BADHDUFLAG | Total packets | Discarded packets |
| A | 0 | 15 | 0 |
| B | 0 | 15 | 0 |
| C | 0 | 15 | 0 |
| D | 0 | 16 | 0 |
| Mode SS | |||
|---|---|---|---|
| Quadrant | BADHDUFLAG | Total packets | Discarded packets |
| A | 0 | 106 | 0 |
| B | 0 | 106 | 0 |
| C | 0 | 106 | 0 |
| D | 0 | 106 | 0 |
| Mode M0 | |||
|---|---|---|---|
| Quadrant | BADHDUFLAG | Total packets | Discarded packets |
| A | 0 | 10876 | 3 |
| B | 0 | 10450 | 2 |
| C | 0 | 10916 | 2 |
| D | 0 | 17344 | 2 |
| Quadrant | Total seconds | Saturated seconds | Saturation percentage |
|---|---|---|---|
| A | 5135 | 8 | 0.155794% |
| B | 5135 | 6 | 0.116845% |
| C | 5135 | 52 | 1.012658% |
| D | 5135 | 254 | 4.946446% |
Noise dominated data is calculated using 1-second bins in cleaned event files. If a bin has >2000 counts, and if more than 50% of those come from <1% of pixels, then it is considered to be noise-dominated and hence unusable.
| Quadrant | # 1 sec bins | Bins with >0 counts | Bins with >2000 counts | High rate bins dominated by noise | Noise dominated (total time) | Noise dominated (detector-on time) | Marked lightcurve |
|---|---|---|---|---|---|---|---|
| A | 6448 | 5136 | 4 | 4 | 0.06% | 0.08% | 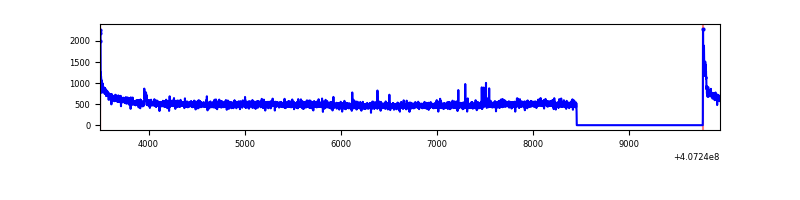 |
| B | 6448 | 5136 | 0 | 0 | 0.00% | 0.00% | 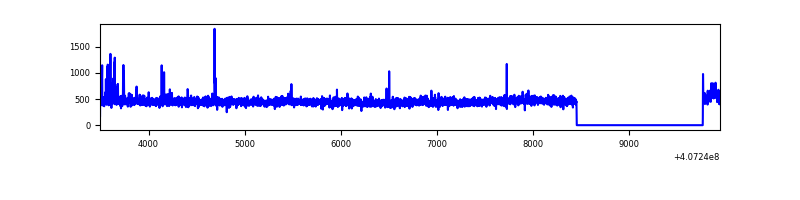 |
| C | 6448 | 5136 | 43 | 43 | 0.67% | 0.84% | 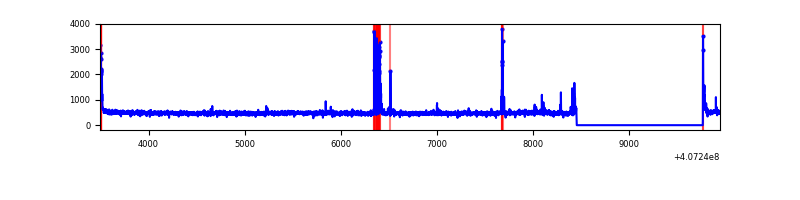 |
| D | 6448 | 5136 | 260 | 260 | 4.03% | 5.06% | 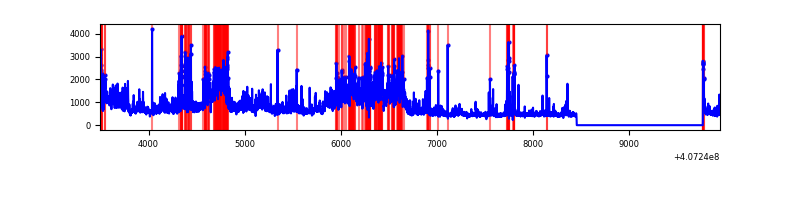 |
Top three noisy pixels from each quadrant. If the there are fewer than three noisy pixels in the level2.evt file, extra rows are filled as -1
| Pixel properties | Quadrant properties | ||||||
|---|---|---|---|---|---|---|---|
| Quadrant | DetID | PixID | Counts | Sigma | Mean | Median | Sigma |
| A | 10 | 83 | 368608 | 3113.23 | 577 | 565 | 118.2 |
| A | 15 | 223 | 18245 | 149.55 | 577 | 565 | 118.2 |
| A | 13 | 254 | 8063 | 63.42 | 577 | 565 | 118.2 |
| B | 4 | 171 | 21089 | 179.91 | 573 | 555 | 114.1 |
| B | 12 | 111 | 14381 | 121.14 | 573 | 555 | 114.1 |
| B | 0 | 230 | 13637 | 114.62 | 573 | 555 | 114.1 |
| C | 15 | 214 | 224725 | 1697.36 | 557 | 561 | 132.1 |
| C | 3 | 110 | 75739 | 569.24 | 557 | 561 | 132.1 |
| C | 0 | 10 | 66589 | 499.96 | 557 | 561 | 132.1 |
| D | 12 | 235 | 1502642 | 10963.16 | 550 | 536 | 137.0 |
| D | 2 | 16 | 396557 | 2890.37 | 550 | 536 | 137.0 |
| D | 12 | 227 | 202427 | 1473.51 | 550 | 536 | 137.0 |
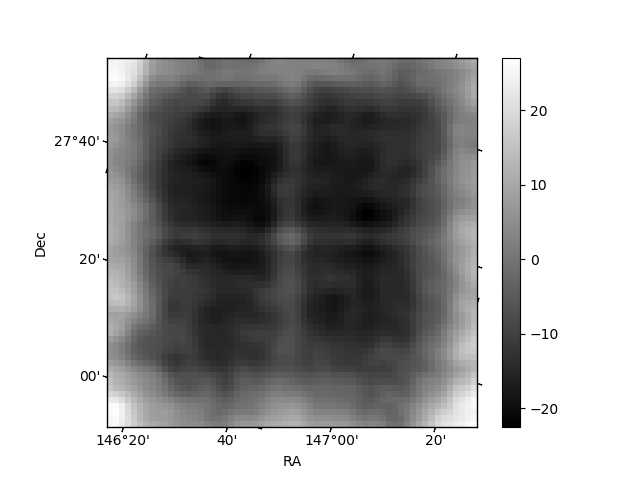
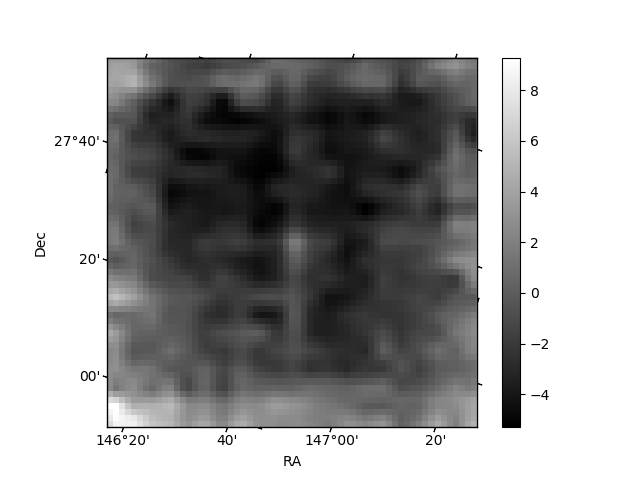
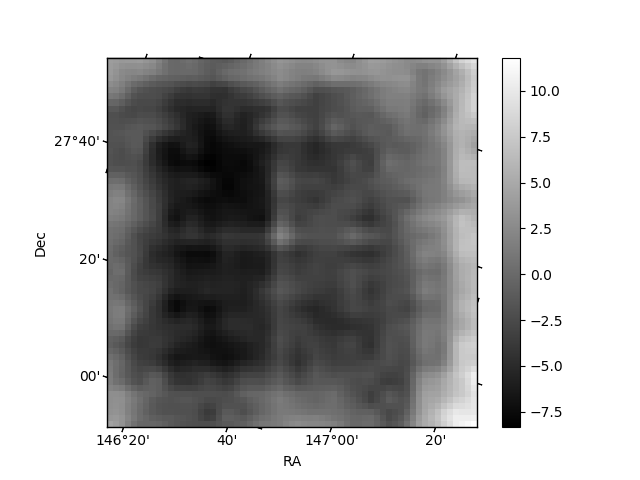
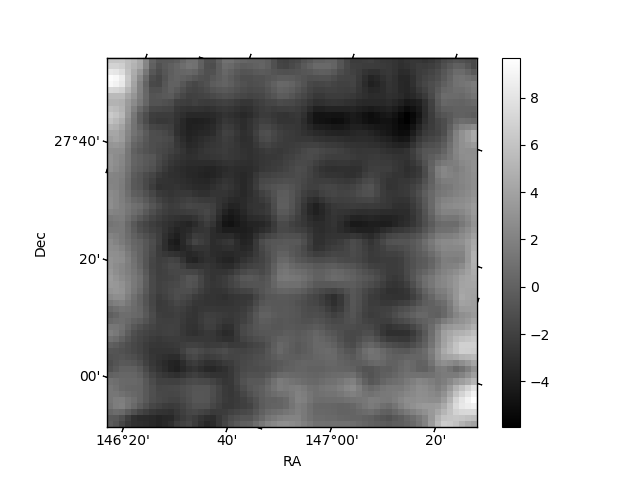
Histogram calculated using DETX and DETY for each event in the final _common_clean file
| Quadrant A | 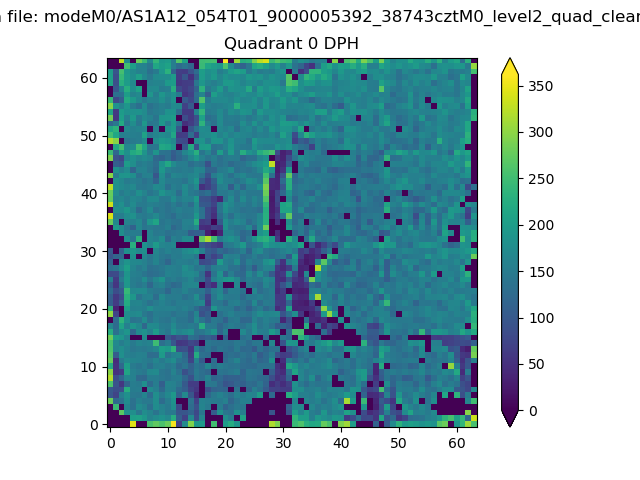 |
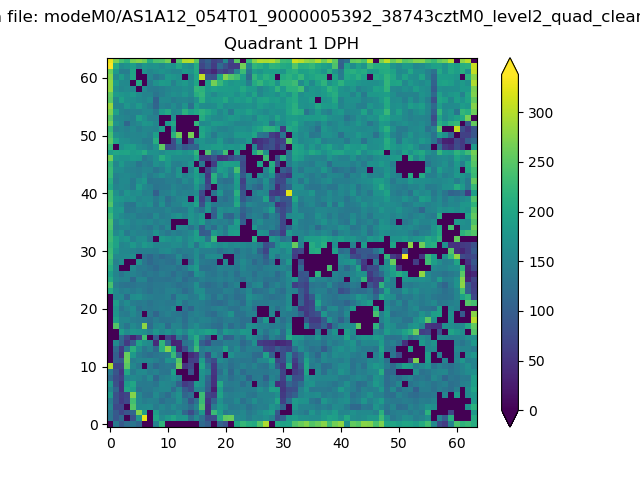 |
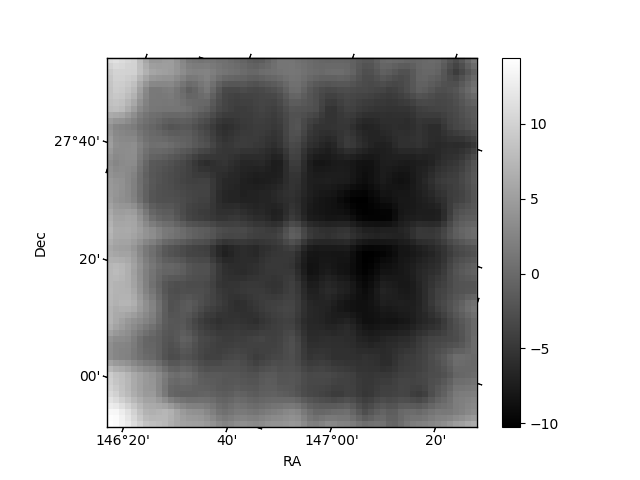
Quadrant B |
|---|---|---|---|
| Quadrant D | 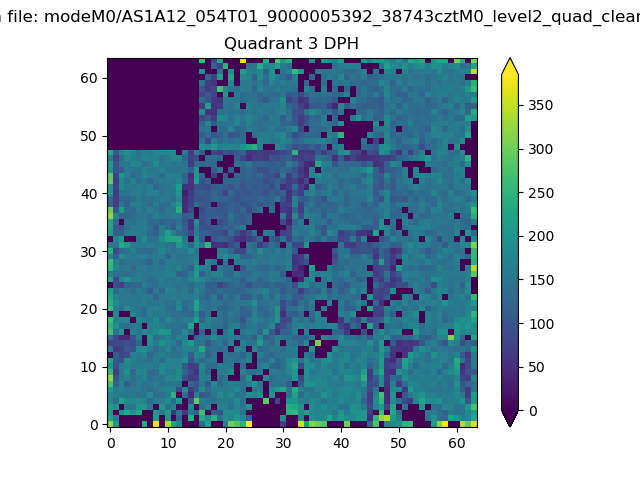 |
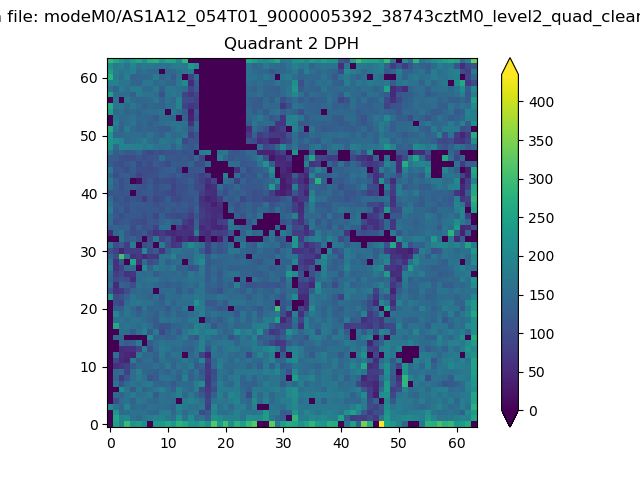 |
Quadrant C |
| Plot type | Count rate plots | Images |
|---|---|---|
| Comparison with Poisson distribution Blue bars denote a histogram of data divided into 1 sec bins. Red curve is a Poisson curve with rate = median count rate of data. |
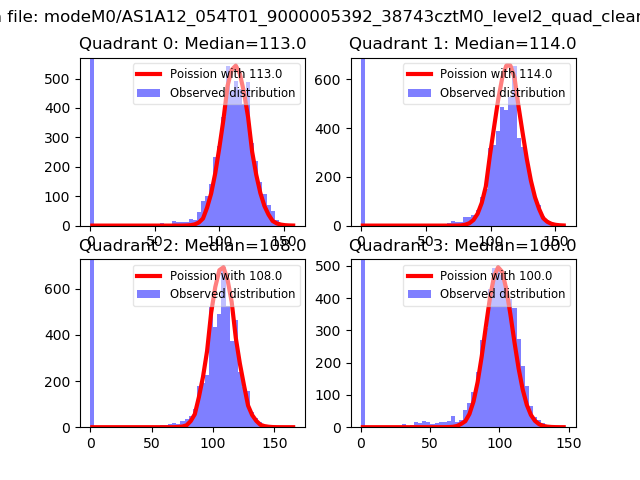 |
 |
| Quadrant-wise count rates Data is divided into 100 sec bins |
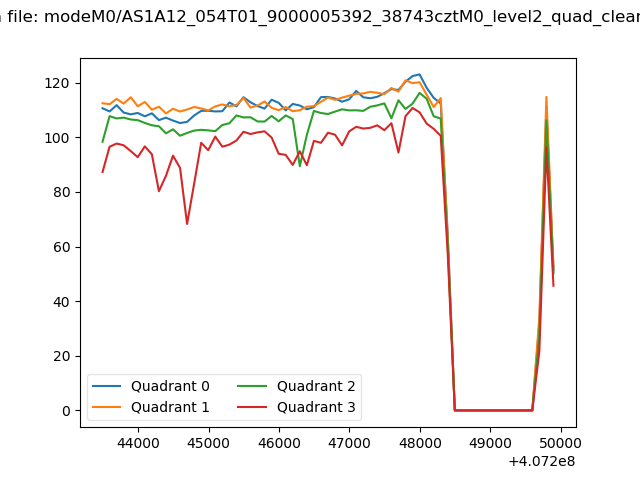 |
|
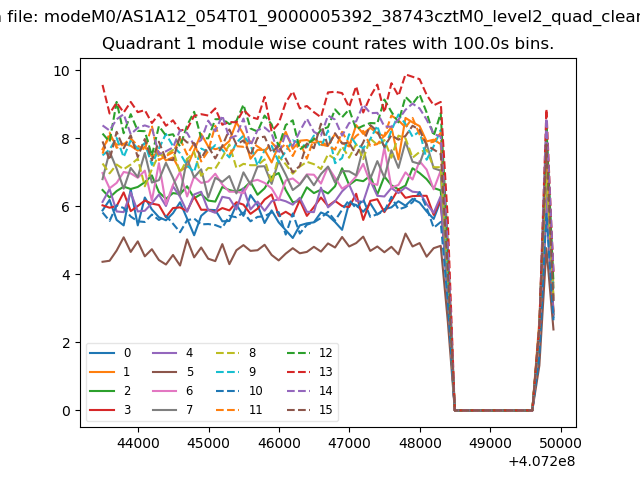
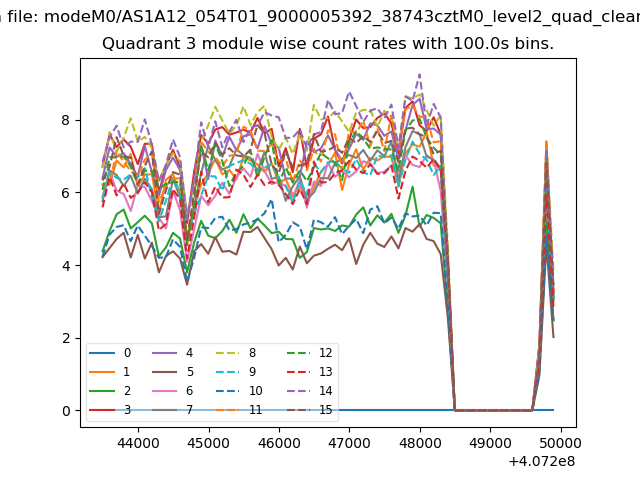
| Module-wise count rates for Quadrant A Data is divided into 100 sec bins |
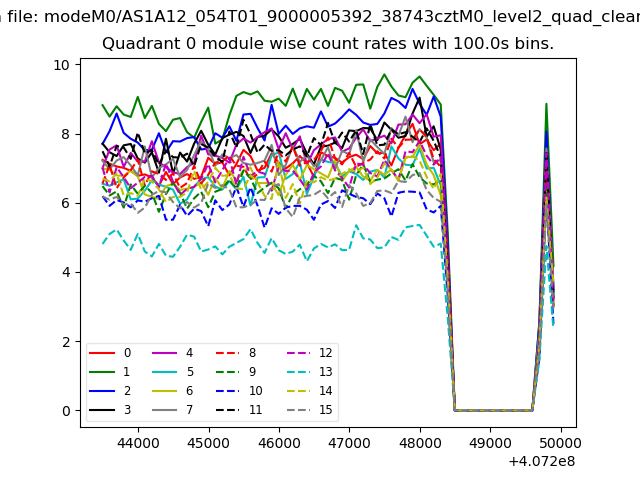 |
 |
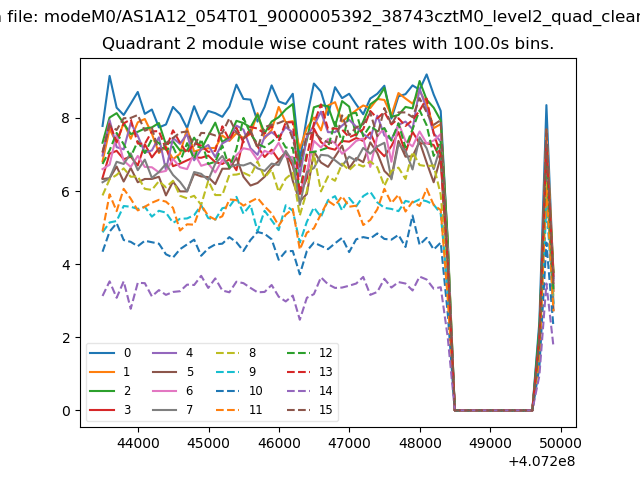
| Module-wise count rates for Quadrant B Data is divided into 100 sec bins |
 |
 |
| Module-wise count rates for Quadrant C Data is divided into 100 sec bins |
 |
 |
| Module-wise count rates for Quadrant D Data is divided into 100 sec bins |
 |
 |
| Parameter | Plot |
|---|---|
| CZT HV Monitor | 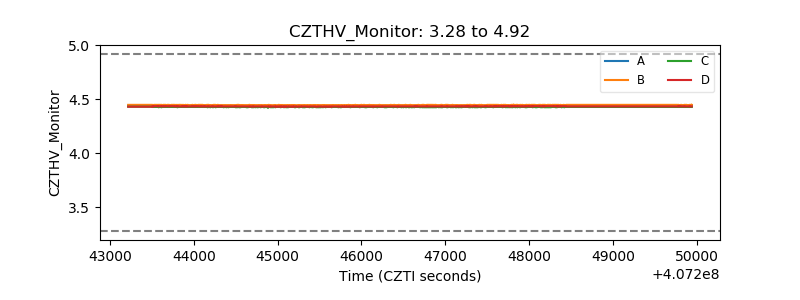 |
| D_VDD | 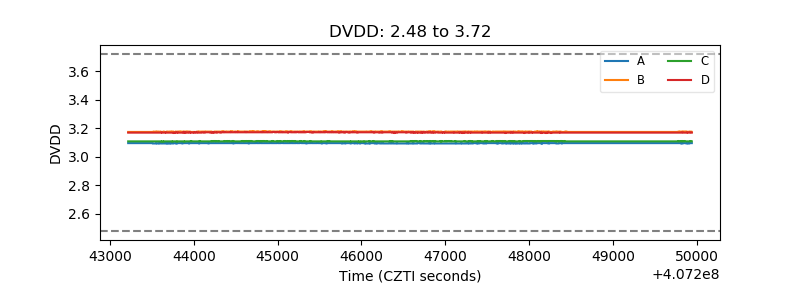 |
| Temperature 1 | 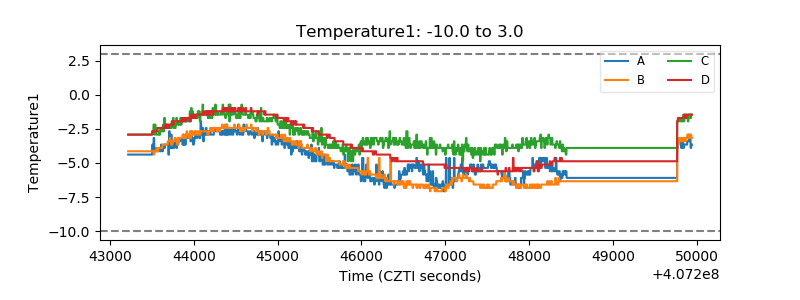 |
| Veto HV Monitor | 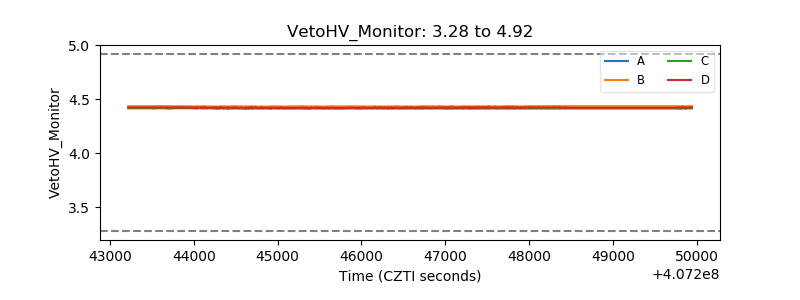 |
| Veto LLD | 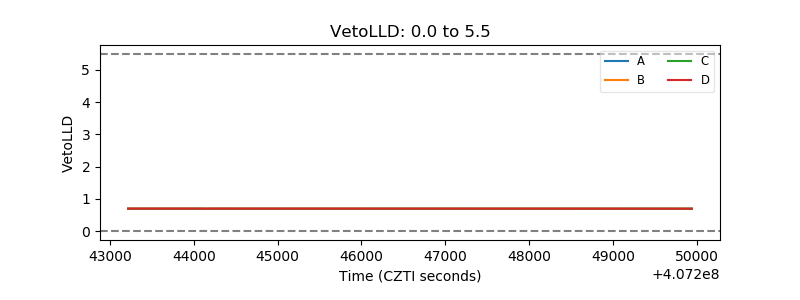 |
| Alpha Counter | 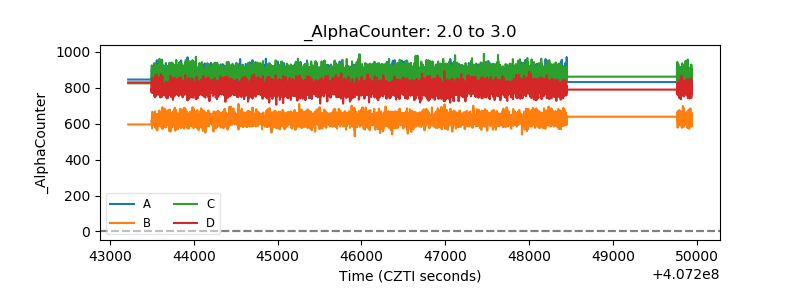 |
| _CPM_Rate | 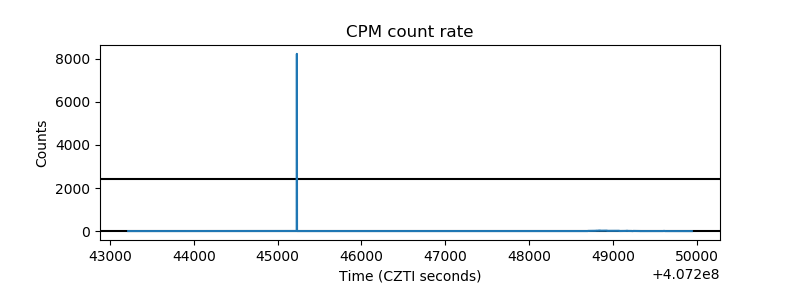 |
| CZT Counter | 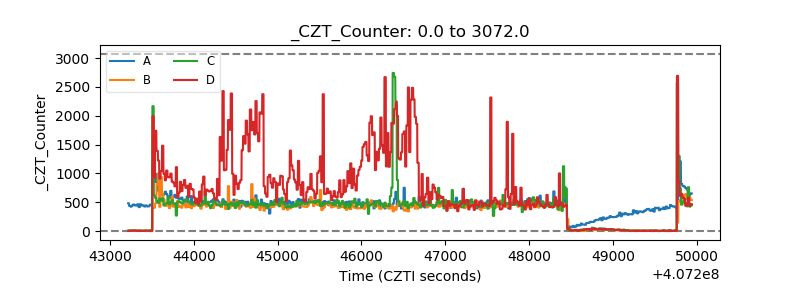 |
| +2.5 Volts monitor | 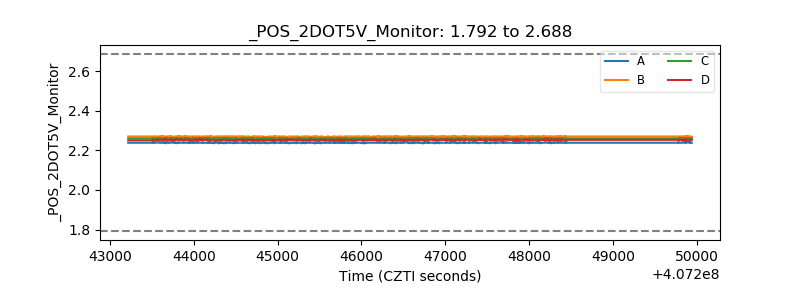 |
| +5 Volts monitor | 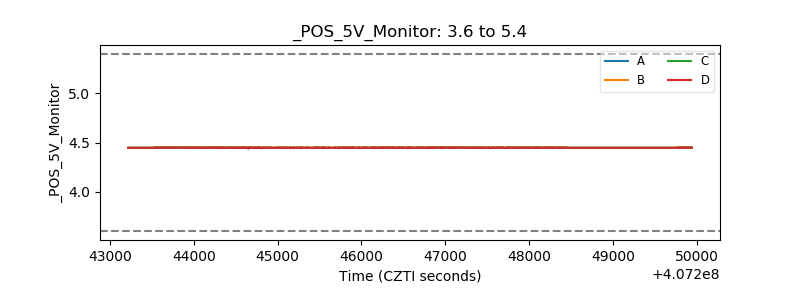 |
| _ROLL_ROT | 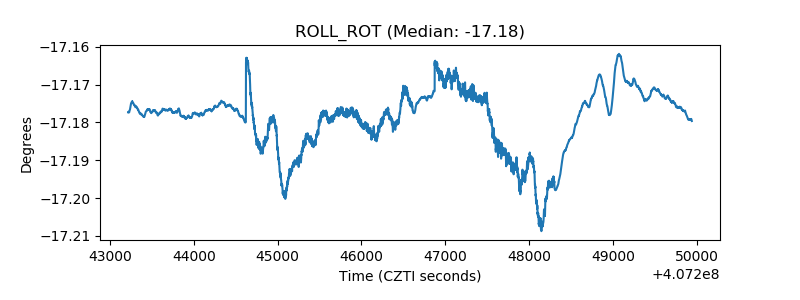 |
| _Roll_DEC | 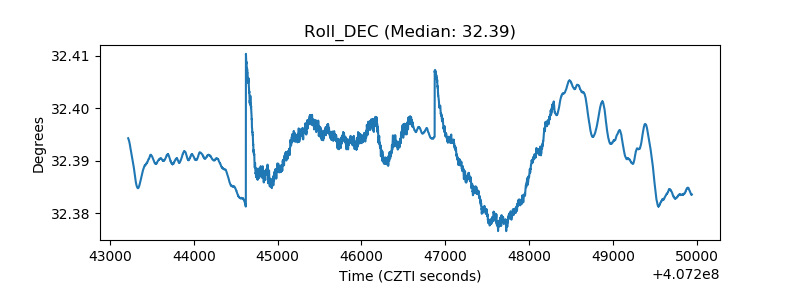 |
| _Roll_RA | 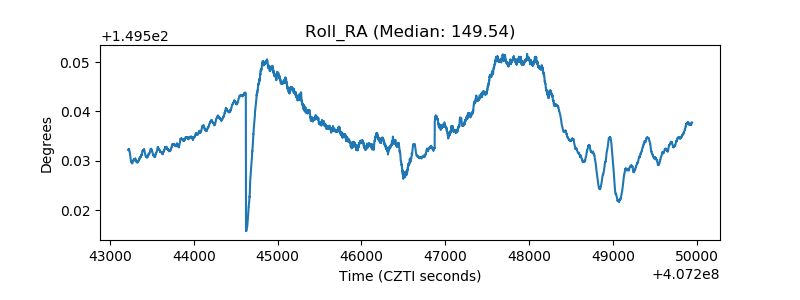 |
| Veto Counter |  |