| Param | Original file | Final file |
|---|---|---|
| Filename | modeM0/AS1A12_054T01_9000005392_38745cztM0_level2.fits | modeM0/AS1A12_054T01_9000005392_38745cztM0_level2_quad_clean.evt |
| Size (bytes) | 775,039,680 | 175,026,240 |
| Size | 739.1 MB | 166.9 MB |
| Events in quadrant A | 5,588,148 | 1,203,501 |
| Events in quadrant B | 5,186,050 | 1,218,725 |
| Events in quadrant C | 5,521,741 | 1,144,762 |
| Events in quadrant D | 11,559,037 | 985,871 |
| Mode M9 | |||
|---|---|---|---|
| Quadrant | BADHDUFLAG | Total packets | Discarded packets |
| A | 0 | 33 | 0 |
| B | 0 | 33 | 0 |
| C | 0 | 33 | 0 |
| D | 0 | 34 | 0 |
| Mode SS | |||
|---|---|---|---|
| Quadrant | BADHDUFLAG | Total packets | Discarded packets |
| A | 0 | 220 | 0 |
| B | 0 | 220 | 0 |
| C | 0 | 220 | 0 |
| D | 0 | 220 | 0 |
| Mode M0 | |||
|---|---|---|---|
| Quadrant | BADHDUFLAG | Total packets | Discarded packets |
| A | 0 | 23142 | 4 |
| B | 0 | 22622 | 3 |
| C | 0 | 23054 | 3 |
| D | 0 | 41907 | 3 |
| Quadrant | Total seconds | Saturated seconds | Saturation percentage |
|---|---|---|---|
| A | 10779 | 27 | 0.250487% |
| B | 10779 | 29 | 0.269042% |
| C | 10779 | 85 | 0.788570% |
| D | 10779 | 1146 | 10.631784% |
Noise dominated data is calculated using 1-second bins in cleaned event files. If a bin has >2000 counts, and if more than 50% of those come from <1% of pixels, then it is considered to be noise-dominated and hence unusable.
| Quadrant | # 1 sec bins | Bins with >0 counts | Bins with >2000 counts | High rate bins dominated by noise | Noise dominated (total time) | Noise dominated (detector-on time) | Marked lightcurve |
|---|---|---|---|---|---|---|---|
| A | 13616 | 10781 | 8 | 8 | 0.06% | 0.07% | 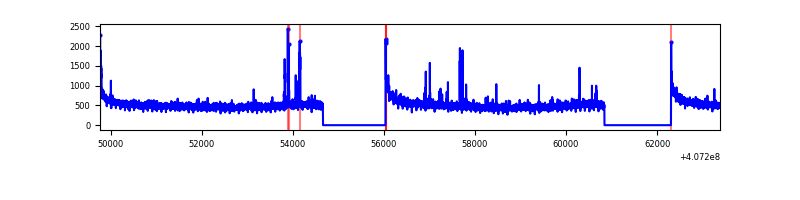 |
| B | 13616 | 10781 | 10 | 10 | 0.07% | 0.09% | 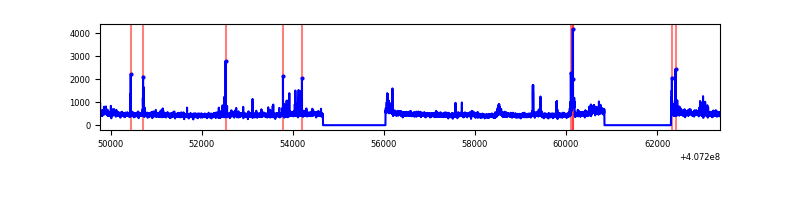 |
| C | 13616 | 10781 | 69 | 69 | 0.51% | 0.64% | 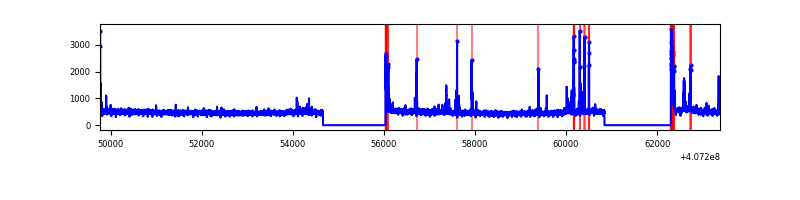 |
| D | 13616 | 10781 | 950 | 950 | 6.98% | 8.81% | 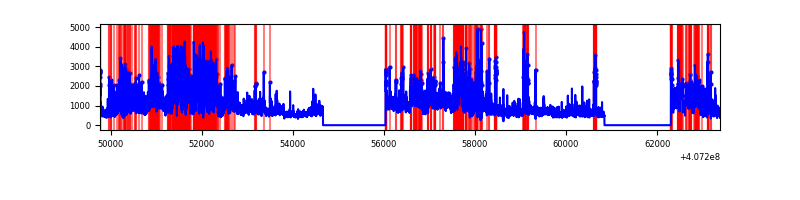 |
Top three noisy pixels from each quadrant. If the there are fewer than three noisy pixels in the level2.evt file, extra rows are filled as -1
| Pixel properties | Quadrant properties | ||||||
|---|---|---|---|---|---|---|---|
| Quadrant | DetID | PixID | Counts | Sigma | Mean | Median | Sigma |
| A | 10 | 83 | 733195 | 2969.86 | 1219 | 1196 | 246.5 |
| A | 9 | 143 | 34235 | 134.05 | 1219 | 1196 | 246.5 |
| A | 12 | 189 | 32658 | 127.65 | 1219 | 1196 | 246.5 |
| B | 5 | 184 | 187434 | 795.12 | 1205 | 1172 | 234.3 |
| B | 5 | 200 | 98686 | 416.27 | 1205 | 1172 | 234.3 |
| B | 4 | 171 | 52602 | 219.55 | 1205 | 1172 | 234.3 |
| C | 15 | 214 | 471176 | 1709.39 | 1181 | 1188 | 274.9 |
| C | 0 | 10 | 209394 | 757.27 | 1181 | 1188 | 274.9 |
| C | 15 | 208 | 155160 | 560.01 | 1181 | 1188 | 274.9 |
| D | 2 | 16 | 3125143 | 11089.34 | 1141 | 1106 | 281.7 |
| D | 12 | 235 | 2761070 | 9796.99 | 1141 | 1106 | 281.7 |
| D | 12 | 227 | 442080 | 1565.32 | 1141 | 1106 | 281.7 |
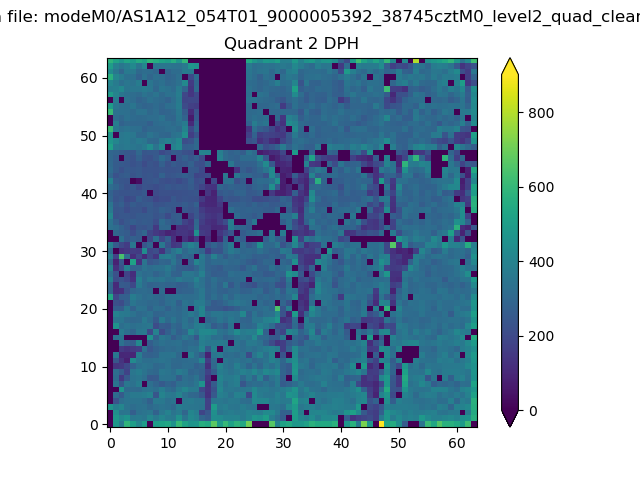
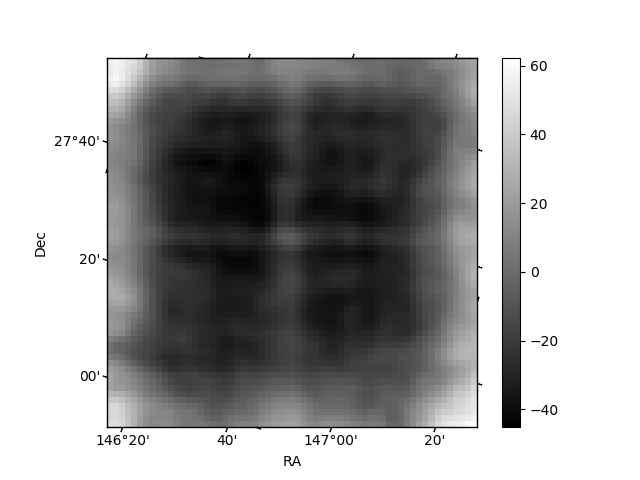
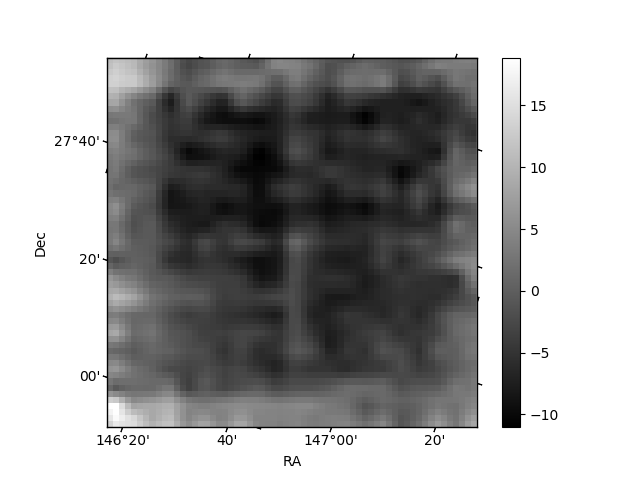
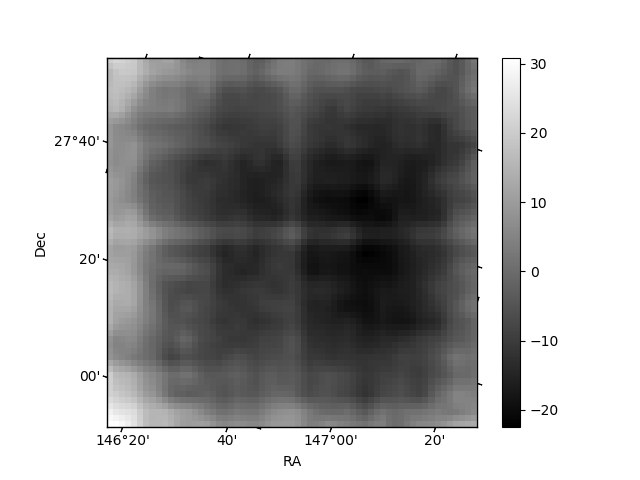
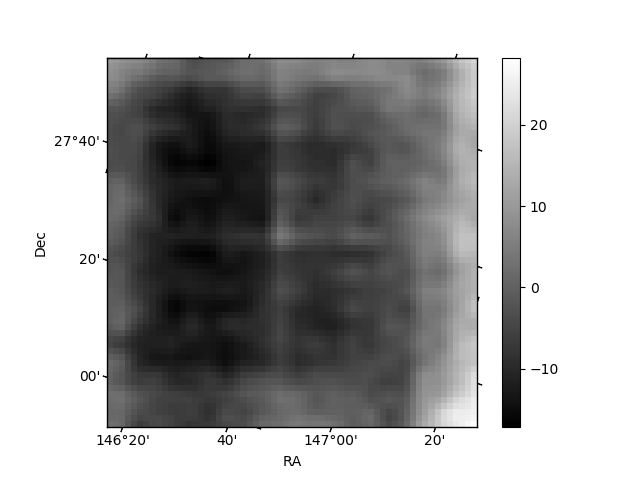
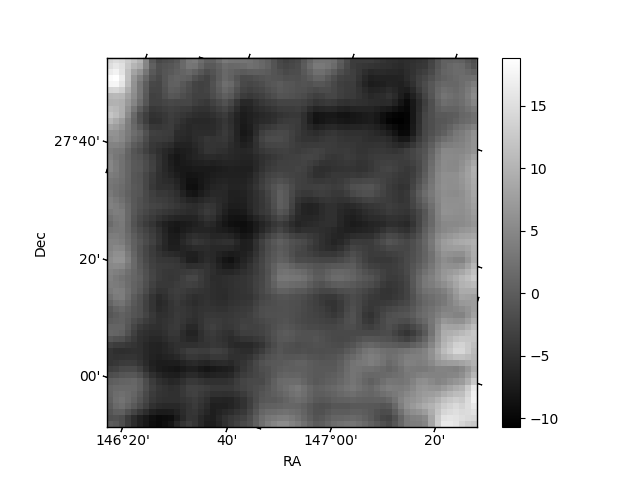
Histogram calculated using DETX and DETY for each event in the final _common_clean file
| Quadrant A | 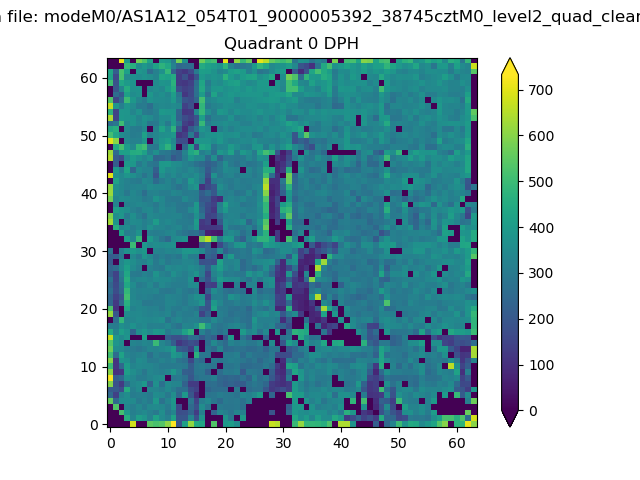 |
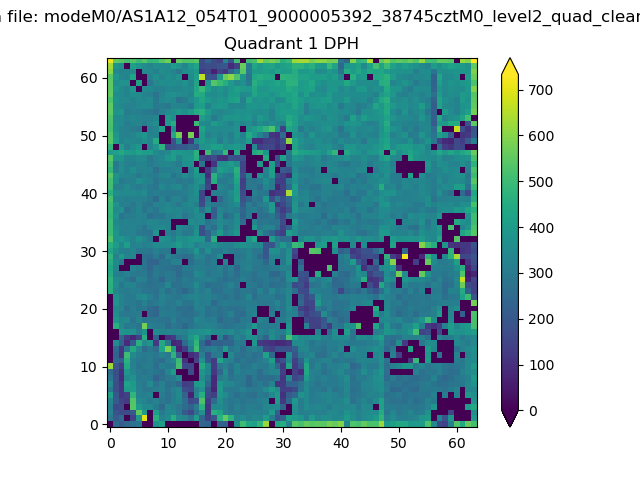 |
Quadrant B |
|---|---|---|---|
| Quadrant D | 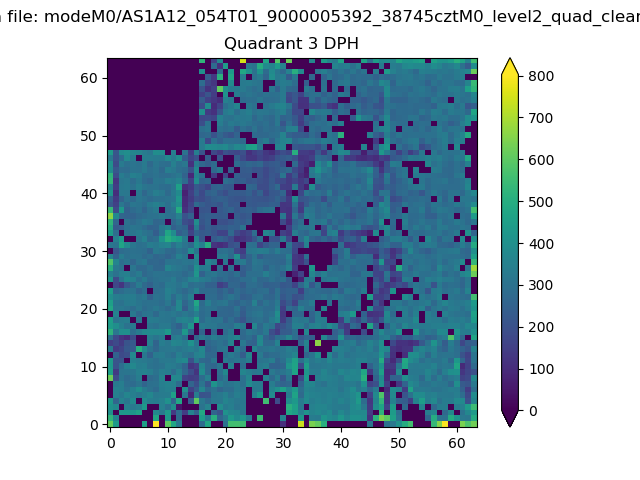 |
 |
Quadrant C |
| Plot type | Count rate plots | Images |
|---|---|---|
| Comparison with Poisson distribution Blue bars denote a histogram of data divided into 1 sec bins. Red curve is a Poisson curve with rate = median count rate of data. |
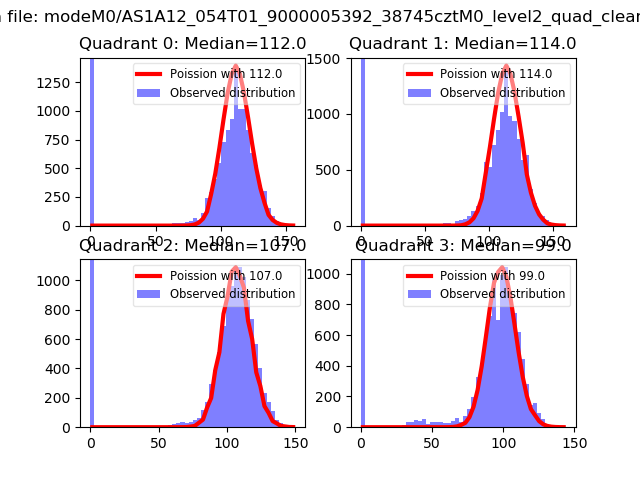 |
 |
| Quadrant-wise count rates Data is divided into 100 sec bins |
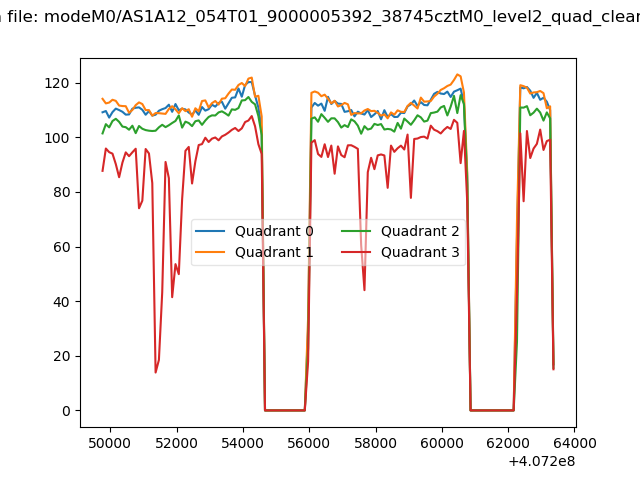 |
|
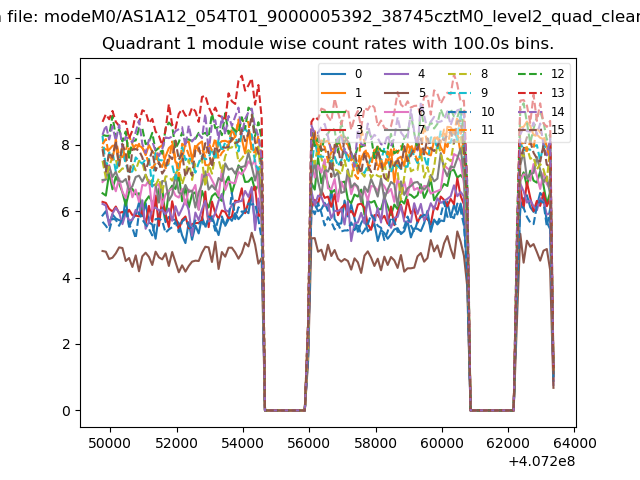
| Module-wise count rates for Quadrant A Data is divided into 100 sec bins |
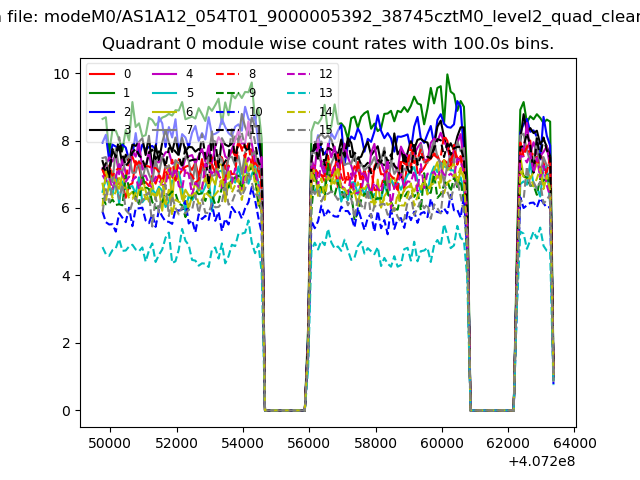 |
 |
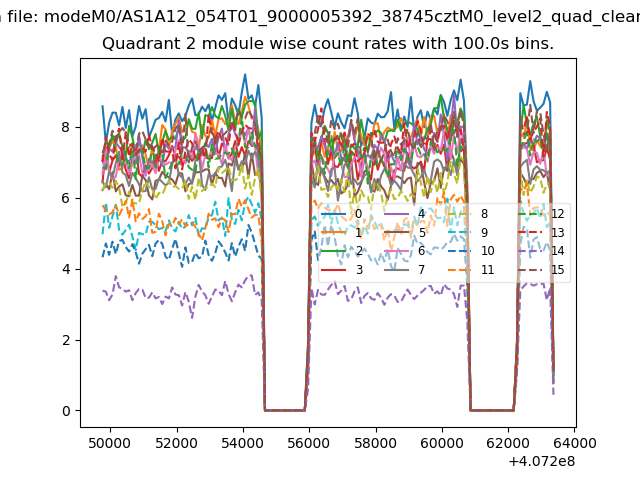
| Module-wise count rates for Quadrant B Data is divided into 100 sec bins |
 |
 |
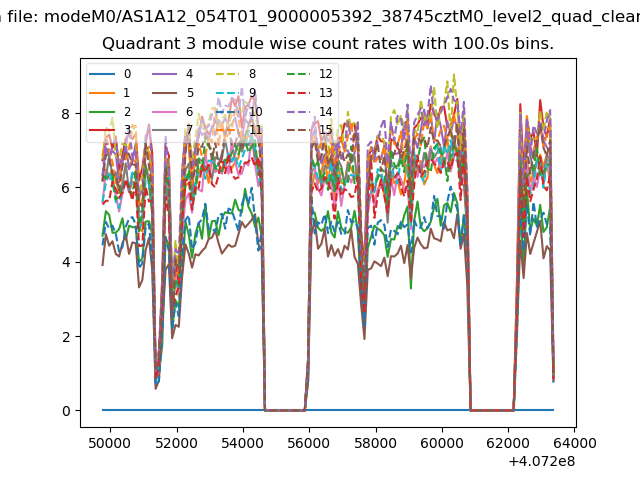
| Module-wise count rates for Quadrant C Data is divided into 100 sec bins |
 |
 |
| Module-wise count rates for Quadrant D Data is divided into 100 sec bins |
 |
 |
| Parameter | Plot |
|---|---|
| CZT HV Monitor | 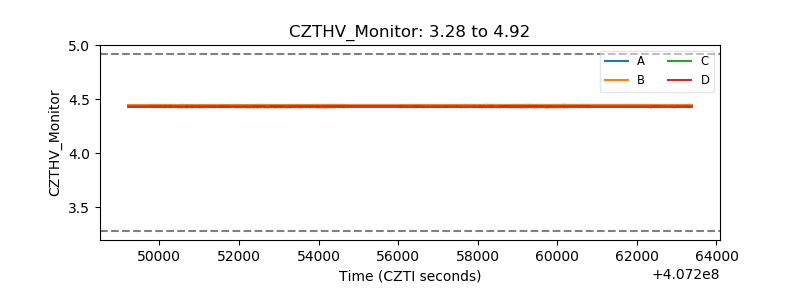 |
| D_VDD | 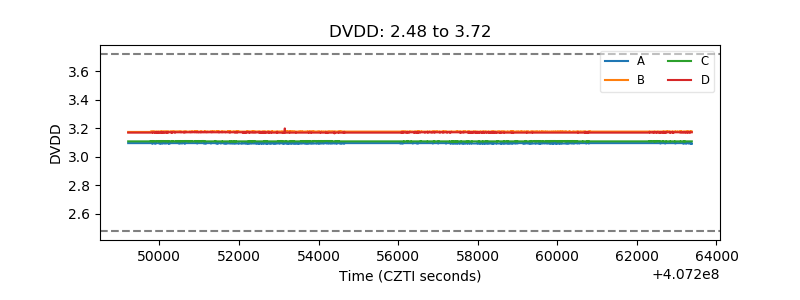 |
| Temperature 1 | 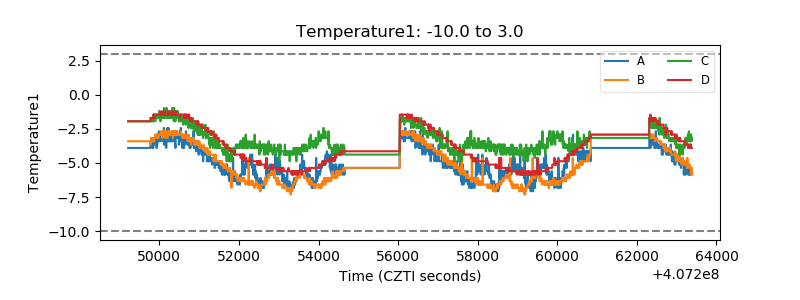 |
| Veto HV Monitor | 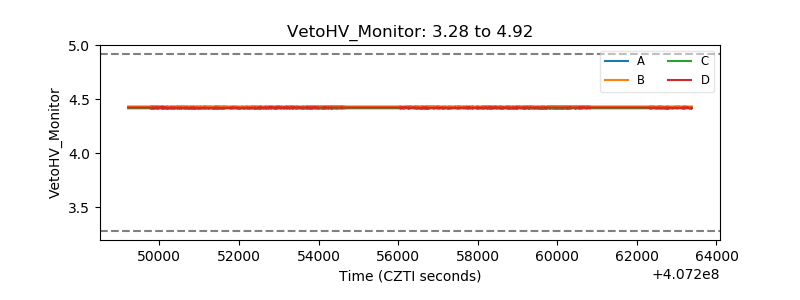 |
| Veto LLD | 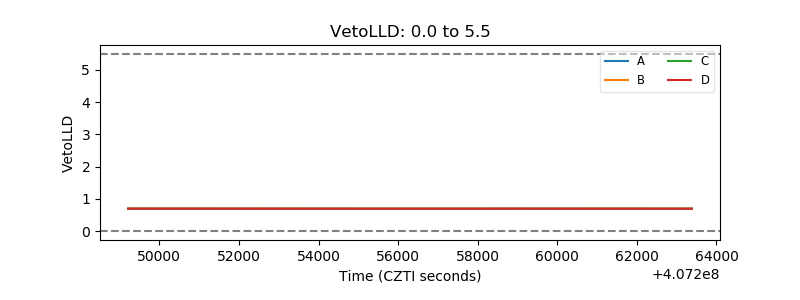 |
| Alpha Counter | 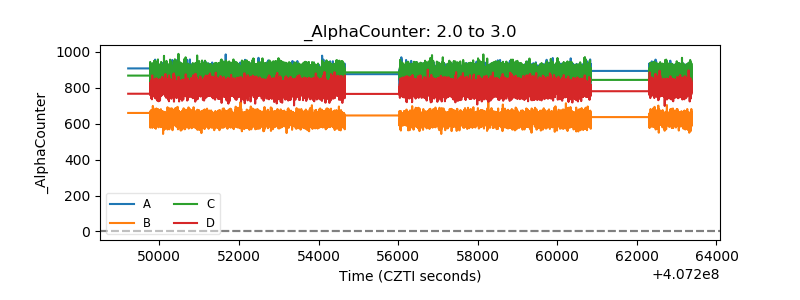 |
| _CPM_Rate | 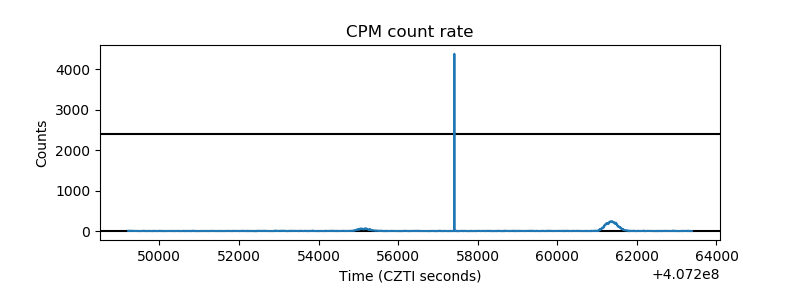 |
| CZT Counter | 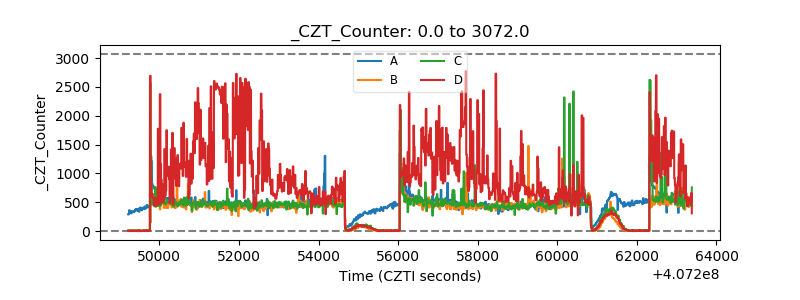 |
| +2.5 Volts monitor | 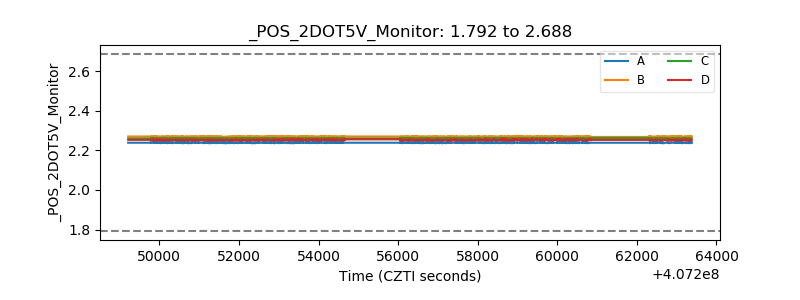 |
| +5 Volts monitor | 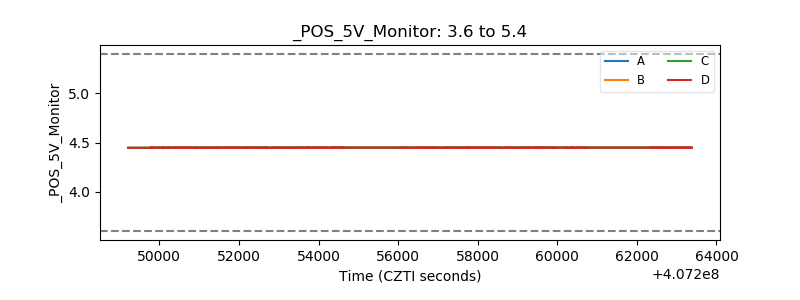 |
| _ROLL_ROT | 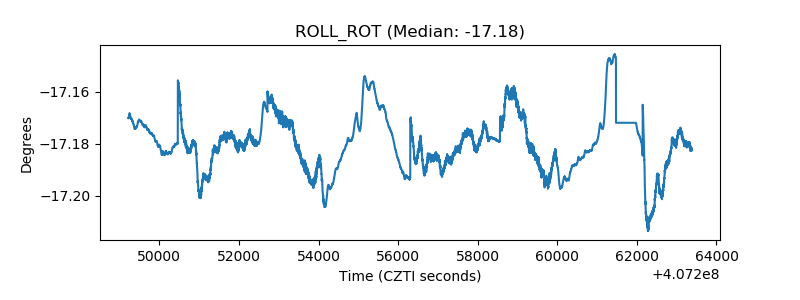 |
| _Roll_DEC | 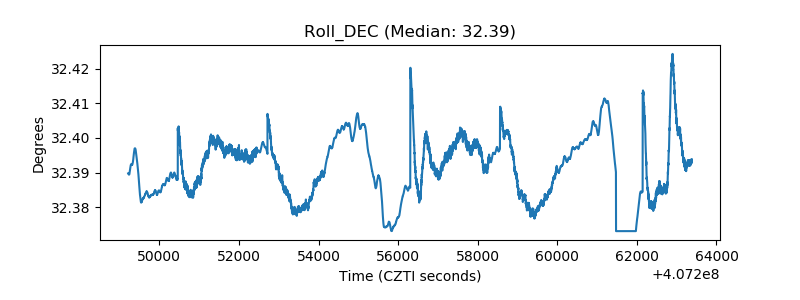 |
| _Roll_RA | 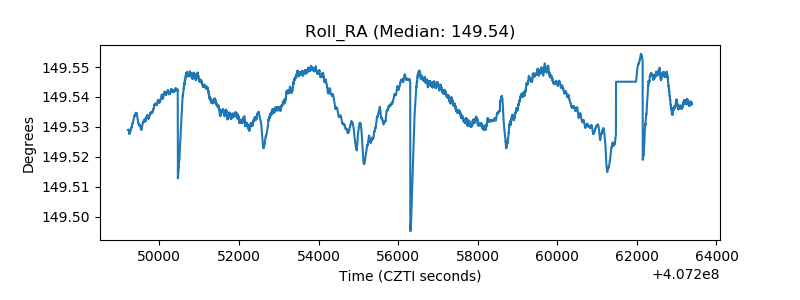 |
| Veto Counter | 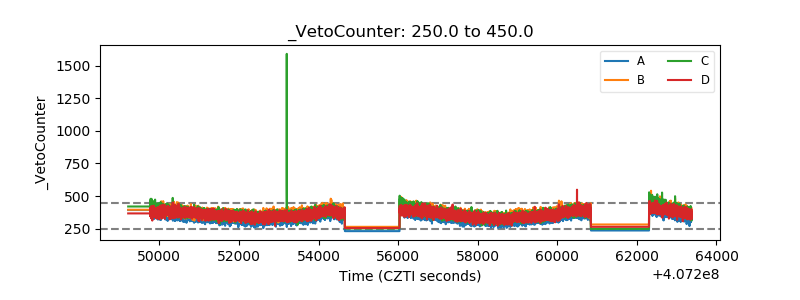 |