| Param | Original file | Final file |
|---|---|---|
| Filename | modeM0/AS1A12_054T01_9000005392_38746cztM0_level2.fits | modeM0/AS1A12_054T01_9000005392_38746cztM0_level2_quad_clean.evt |
| Size (bytes) | 390,312,000 | 94,089,600 |
| Size | 372.2 MB | 89.7 MB |
| Events in quadrant A | 2,931,264 | 641,787 |
| Events in quadrant B | 2,754,183 | 647,392 |
| Events in quadrant C | 2,962,108 | 613,213 |
| Events in quadrant D | 5,362,653 | 552,813 |
| Mode M9 | |||
|---|---|---|---|
| Quadrant | BADHDUFLAG | Total packets | Discarded packets |
| A | 0 | 28 | 0 |
| B | 0 | 28 | 0 |
| C | 0 | 28 | 0 |
| D | 0 | 29 | 0 |
| Mode SS | |||
|---|---|---|---|
| Quadrant | BADHDUFLAG | Total packets | Discarded packets |
| A | 0 | 114 | 0 |
| B | 0 | 114 | 0 |
| C | 0 | 114 | 0 |
| D | 0 | 114 | 0 |
| Mode M0 | |||
|---|---|---|---|
| Quadrant | BADHDUFLAG | Total packets | Discarded packets |
| A | 0 | 12282 | 3 |
| B | 0 | 11944 | 2 |
| C | 0 | 12339 | 2 |
| D | 0 | 19795 | 2 |
| Quadrant | Total seconds | Saturated seconds | Saturation percentage |
|---|---|---|---|
| A | 5632 | 20 | 0.355114% |
| B | 5632 | 33 | 0.585938% |
| C | 5632 | 60 | 1.065341% |
| D | 5632 | 450 | 7.990057% |
Noise dominated data is calculated using 1-second bins in cleaned event files. If a bin has >2000 counts, and if more than 50% of those come from <1% of pixels, then it is considered to be noise-dominated and hence unusable.
| Quadrant | # 1 sec bins | Bins with >0 counts | Bins with >2000 counts | High rate bins dominated by noise | Noise dominated (total time) | Noise dominated (detector-on time) | Marked lightcurve |
|---|---|---|---|---|---|---|---|
| A | 7185 | 5633 | 5 | 5 | 0.07% | 0.09% | 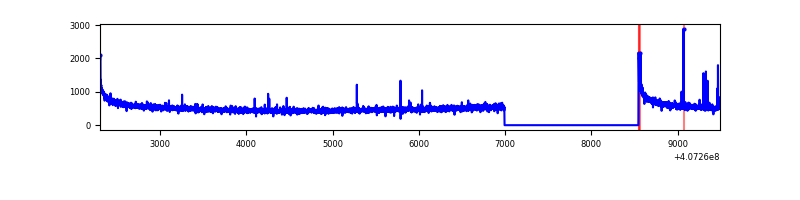 |
| B | 7185 | 5633 | 10 | 10 | 0.14% | 0.18% | 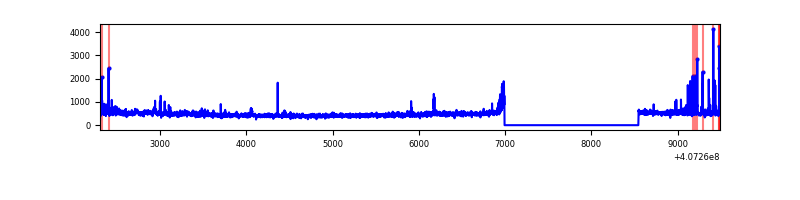 |
| C | 7185 | 5633 | 42 | 42 | 0.58% | 0.75% | 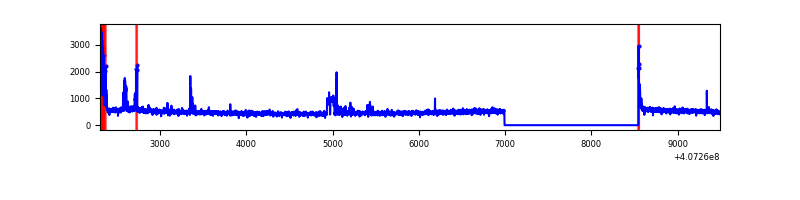 |
| D | 7185 | 5633 | 370 | 370 | 5.15% | 6.57% | 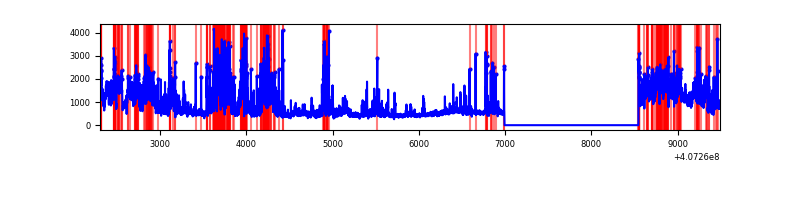 |
Top three noisy pixels from each quadrant. If the there are fewer than three noisy pixels in the level2.evt file, extra rows are filled as -1
| Pixel properties | Quadrant properties | ||||||
|---|---|---|---|---|---|---|---|
| Quadrant | DetID | PixID | Counts | Sigma | Mean | Median | Sigma |
| A | 10 | 83 | 417923 | 3193.33 | 640 | 626 | 130.7 |
| A | 13 | 248 | 15540 | 114.13 | 640 | 626 | 130.7 |
| A | 9 | 143 | 13635 | 99.55 | 640 | 626 | 130.7 |
| B | 4 | 171 | 120602 | 956.68 | 634 | 615 | 125.4 |
| B | 5 | 184 | 65659 | 518.61 | 634 | 615 | 125.4 |
| B | 5 | 200 | 43506 | 341.98 | 634 | 615 | 125.4 |
| C | 15 | 214 | 250684 | 1720.17 | 620 | 623 | 145.4 |
| C | 0 | 10 | 144881 | 992.35 | 620 | 623 | 145.4 |
| C | 15 | 208 | 104330 | 713.4 | 620 | 623 | 145.4 |
| D | 12 | 235 | 1336785 | 8940.22 | 610 | 592 | 149.5 |
| D | 2 | 16 | 783741 | 5239.9 | 610 | 592 | 149.5 |
| D | 2 | 249 | 202066 | 1348.03 | 610 | 592 | 149.5 |
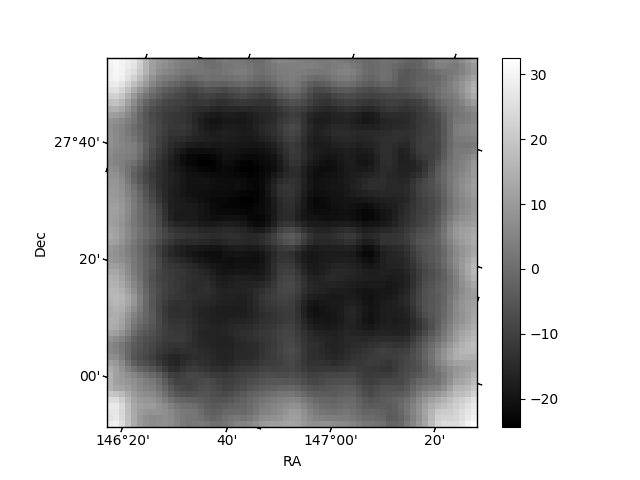
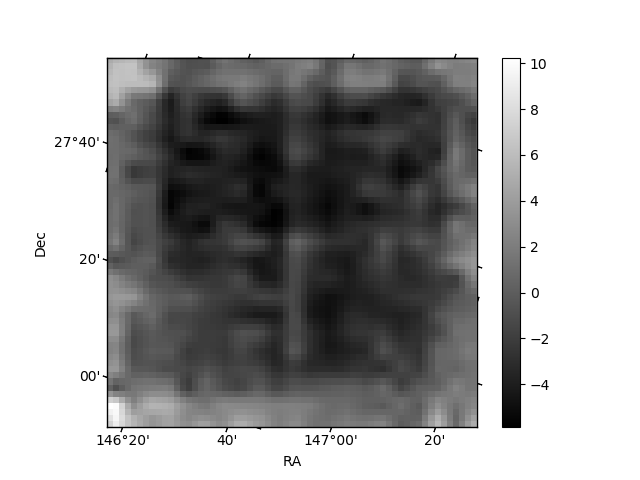
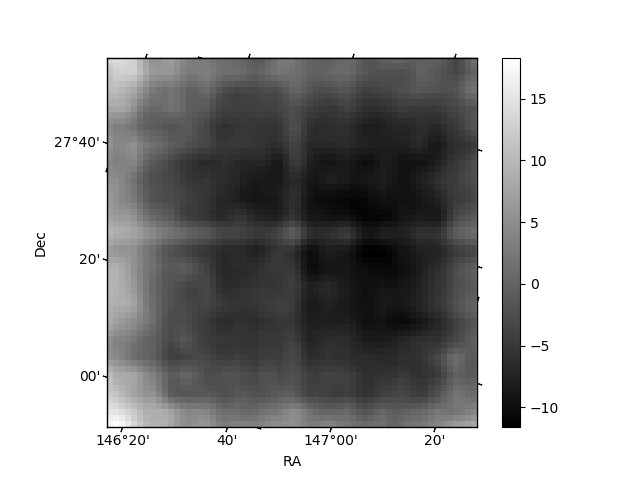
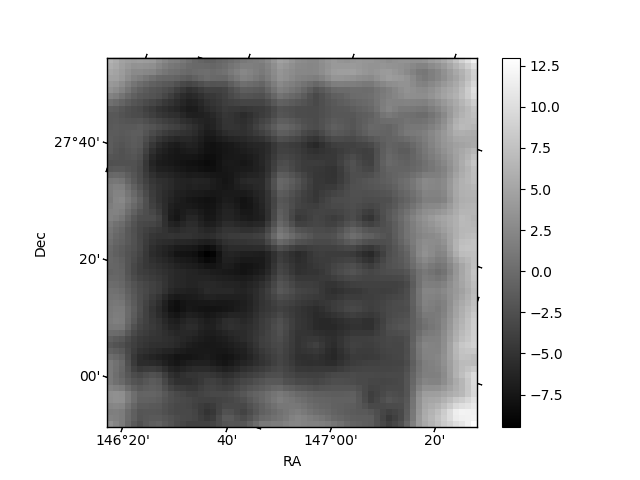
Histogram calculated using DETX and DETY for each event in the final _common_clean file
| Quadrant A | 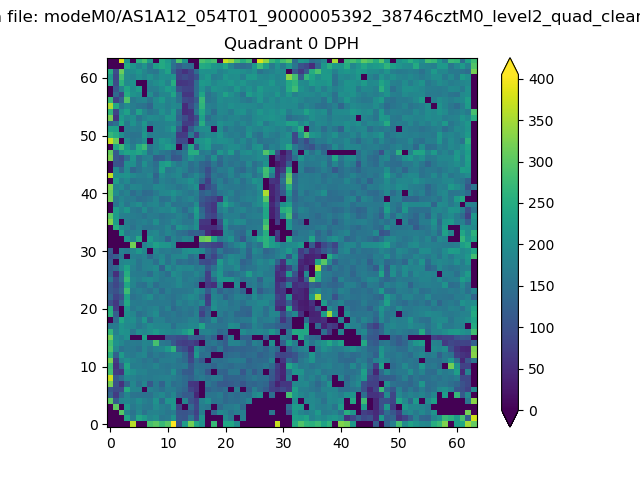 |
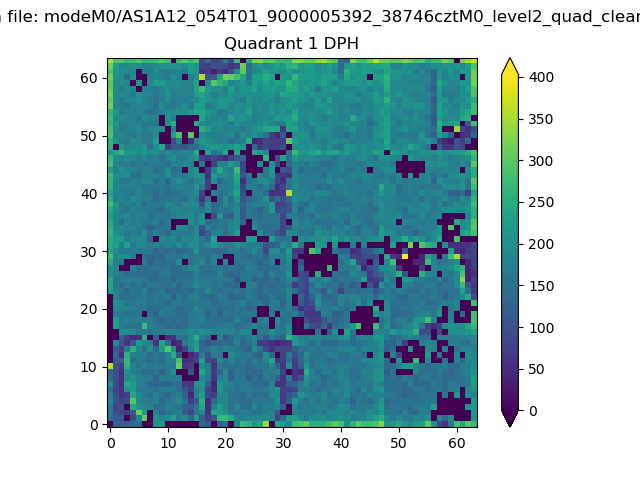 |
Quadrant B |
|---|---|---|---|
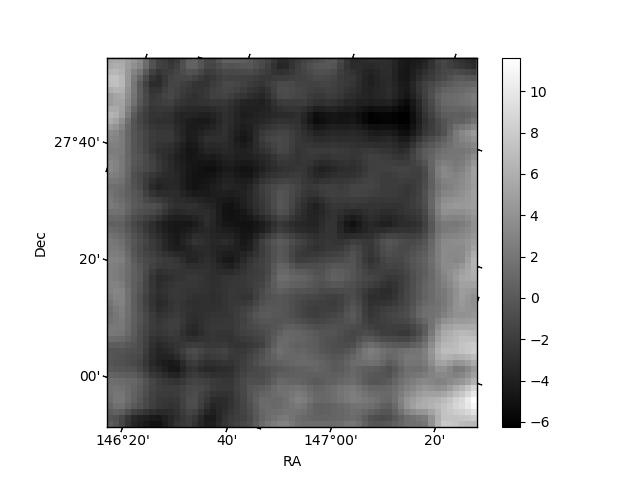
| Quadrant D | 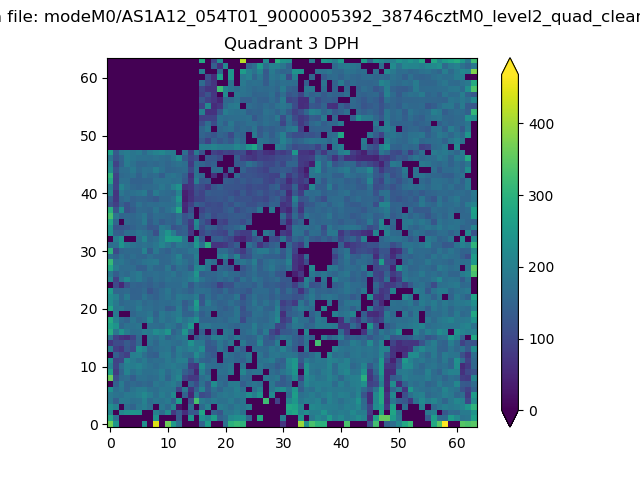 |
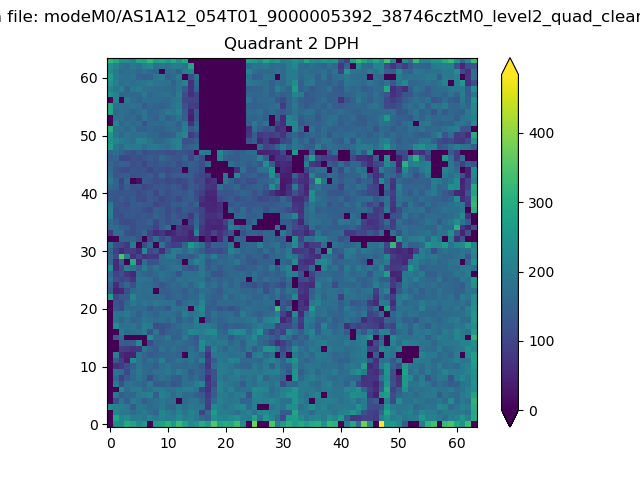 |
Quadrant C |
| Plot type | Count rate plots | Images |
|---|---|---|
| Comparison with Poisson distribution Blue bars denote a histogram of data divided into 1 sec bins. Red curve is a Poisson curve with rate = median count rate of data. |
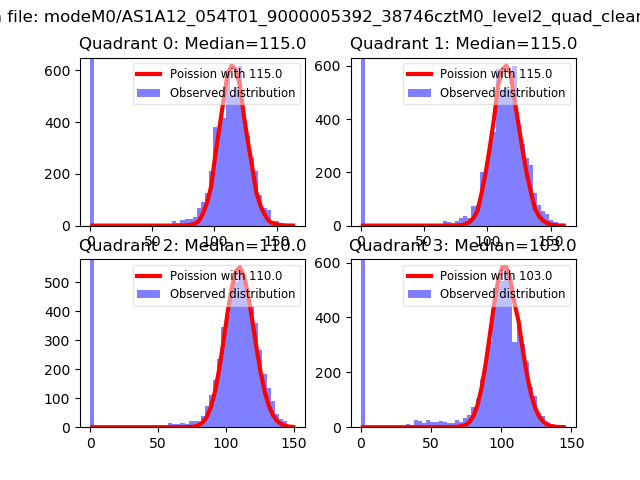 |
 |
| Quadrant-wise count rates Data is divided into 100 sec bins |
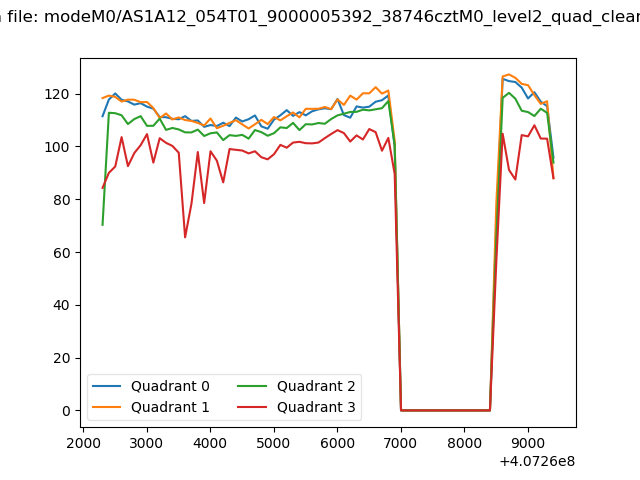 |
|
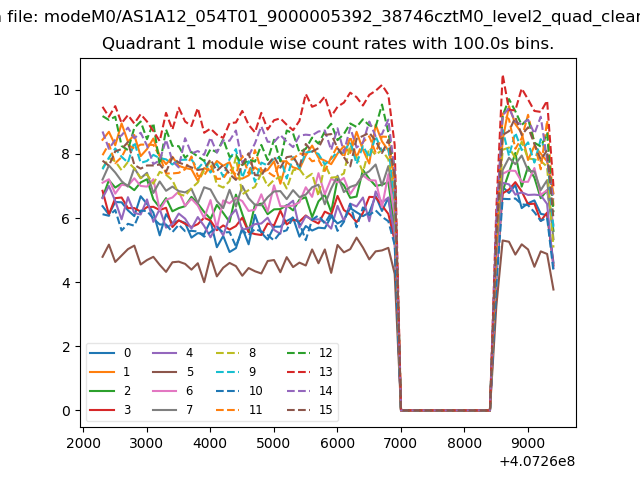
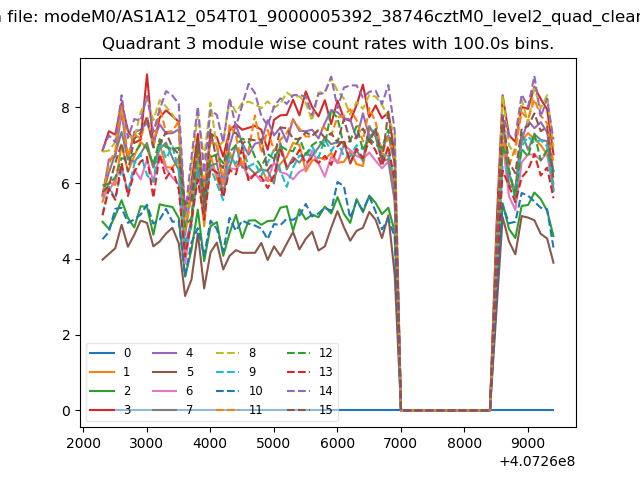
| Module-wise count rates for Quadrant A Data is divided into 100 sec bins |
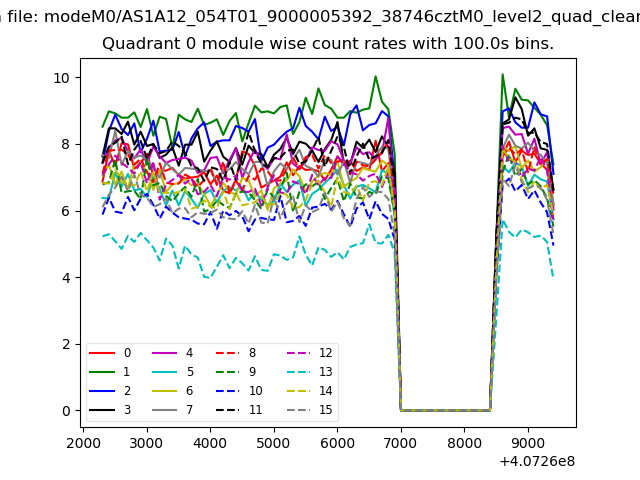 |
 |
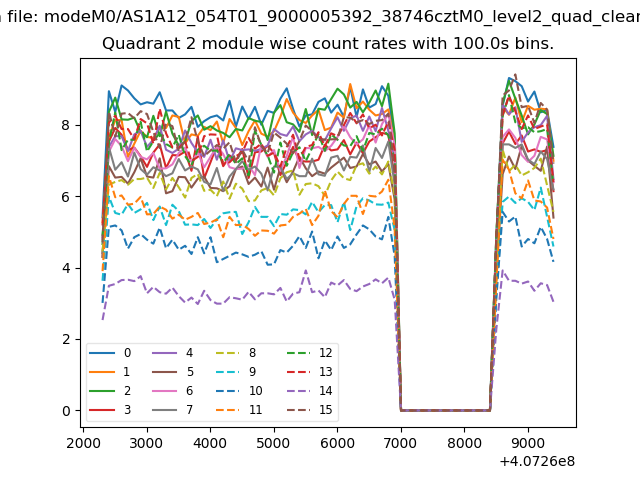
| Module-wise count rates for Quadrant B Data is divided into 100 sec bins |
 |
 |
| Module-wise count rates for Quadrant C Data is divided into 100 sec bins |
 |
 |
| Module-wise count rates for Quadrant D Data is divided into 100 sec bins |
 |
 |
| Parameter | Plot |
|---|---|
| CZT HV Monitor | 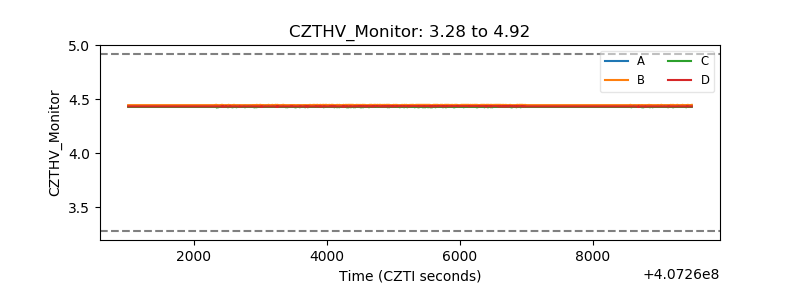 |
| D_VDD | 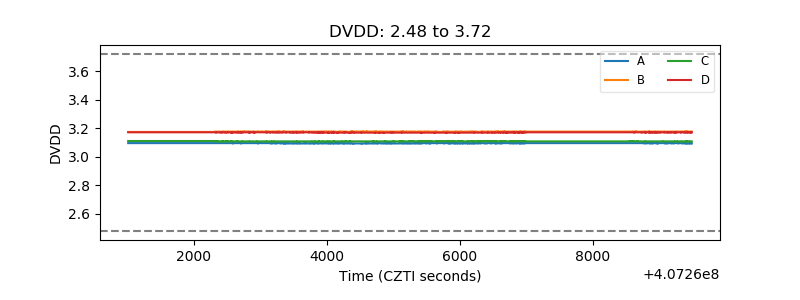 |
| Temperature 1 | 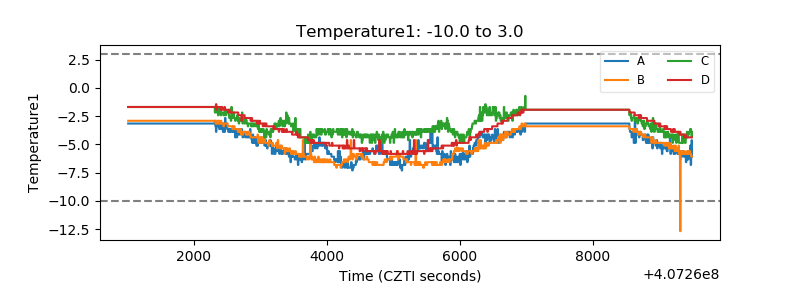 |
| Veto HV Monitor | 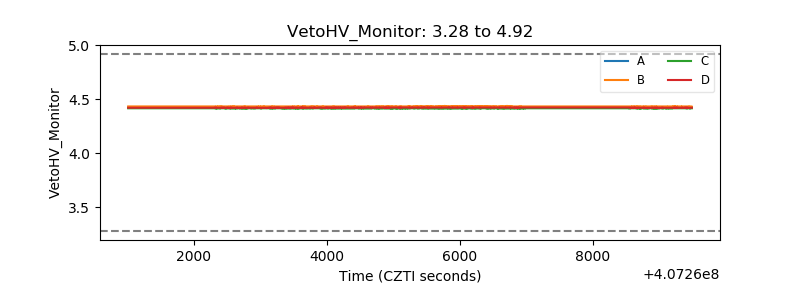 |
| Veto LLD | 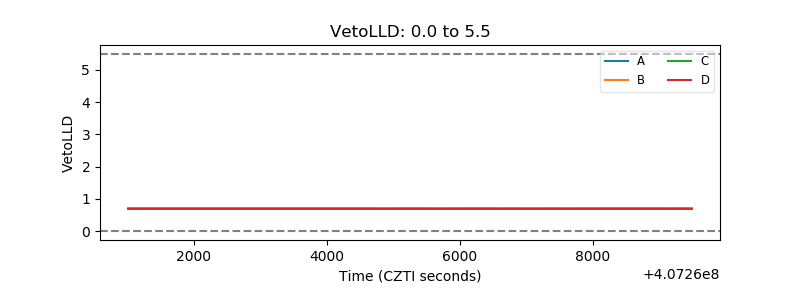 |
| Alpha Counter | 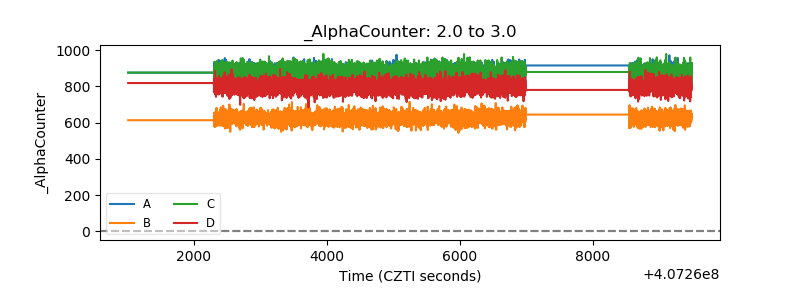 |
| _CPM_Rate | 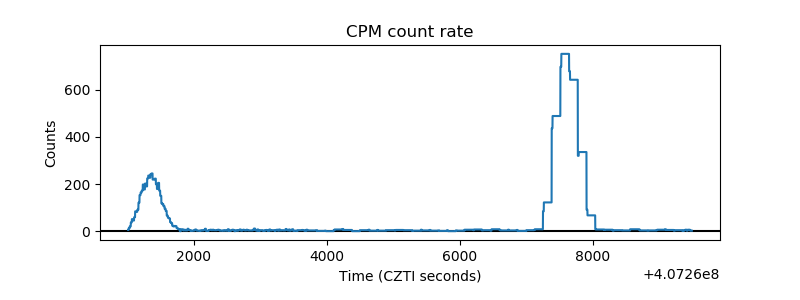 |
| CZT Counter | 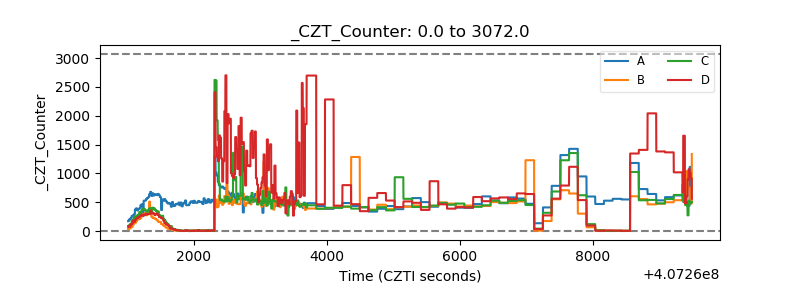 |
| +2.5 Volts monitor | 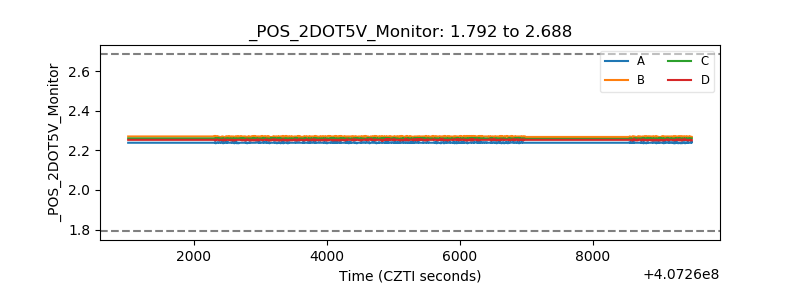 |
| +5 Volts monitor | 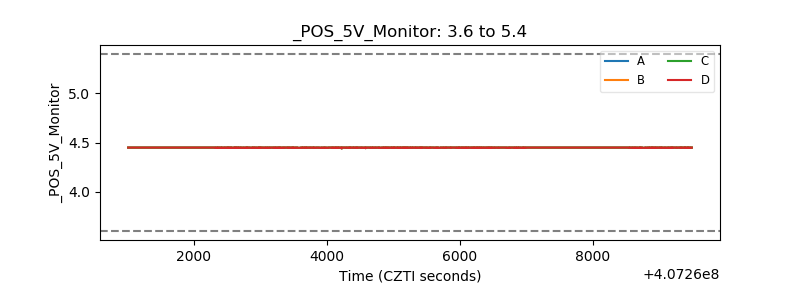 |
| _ROLL_ROT | 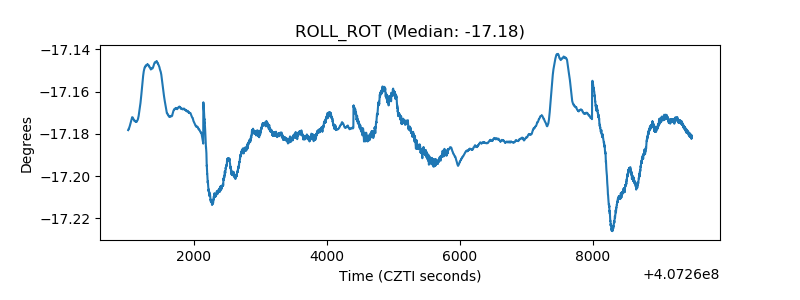 |
| _Roll_DEC | 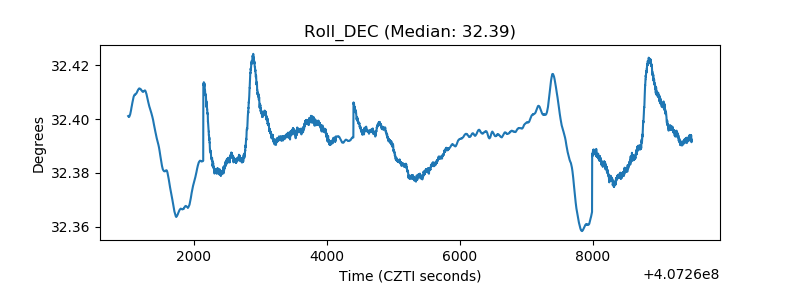 |
| _Roll_RA | 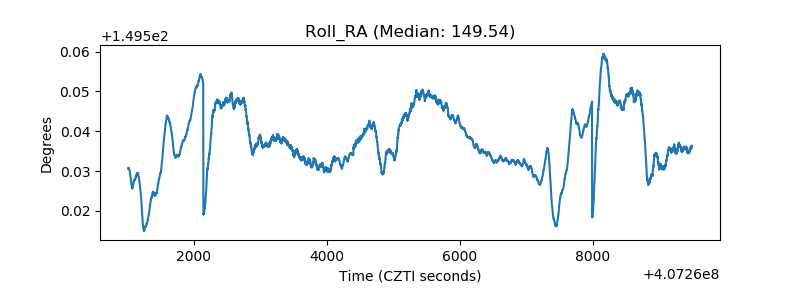 |
| Veto Counter |  |