| Param | Original file | Final file |
|---|---|---|
| Filename | modeM0/AS1A12_054T01_9000005392_38747cztM0_level2.fits | modeM0/AS1A12_054T01_9000005392_38747cztM0_level2_quad_clean.evt |
| Size (bytes) | 387,443,520 | 93,718,080 |
| Size | 369.5 MB | 89.4 MB |
| Events in quadrant A | 3,139,366 | 633,213 |
| Events in quadrant B | 2,935,905 | 647,505 |
| Events in quadrant C | 2,883,468 | 619,161 |
| Events in quadrant D | 4,955,142 | 553,074 |
| Mode M9 | |||
|---|---|---|---|
| Quadrant | BADHDUFLAG | Total packets | Discarded packets |
| A | 0 | 32 | 0 |
| B | 0 | 32 | 0 |
| C | 0 | 32 | 0 |
| D | 0 | 33 | 0 |
| Mode SS | |||
|---|---|---|---|
| Quadrant | BADHDUFLAG | Total packets | Discarded packets |
| A | 0 | 110 | 0 |
| B | 0 | 110 | 0 |
| C | 0 | 110 | 0 |
| D | 0 | 110 | 0 |
| Mode M0 | |||
|---|---|---|---|
| Quadrant | BADHDUFLAG | Total packets | Discarded packets |
| A | 0 | 12824 | 2 |
| B | 0 | 12319 | 1 |
| C | 0 | 11967 | 1 |
| D | 0 | 18476 | 1 |
| Quadrant | Total seconds | Saturated seconds | Saturation percentage |
|---|---|---|---|
| A | 5505 | 74 | 1.344233% |
| B | 5505 | 42 | 0.762943% |
| C | 5505 | 30 | 0.544959% |
| D | 5505 | 359 | 6.521344% |
Noise dominated data is calculated using 1-second bins in cleaned event files. If a bin has >2000 counts, and if more than 50% of those come from <1% of pixels, then it is considered to be noise-dominated and hence unusable.
| Quadrant | # 1 sec bins | Bins with >0 counts | Bins with >2000 counts | High rate bins dominated by noise | Noise dominated (total time) | Noise dominated (detector-on time) | Marked lightcurve |
|---|---|---|---|---|---|---|---|
| A | 7208 | 5506 | 54 | 54 | 0.75% | 0.98% | 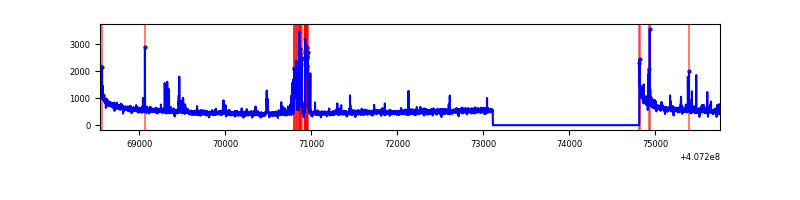 |
| B | 7208 | 5506 | 20 | 20 | 0.28% | 0.36% | 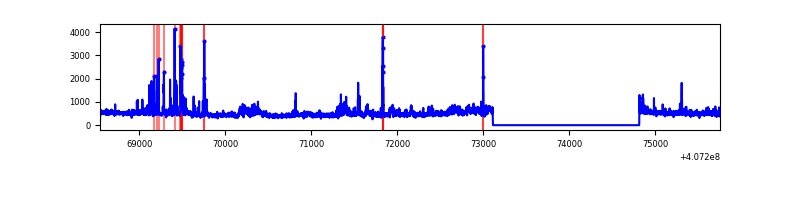 |
| C | 7208 | 5506 | 20 | 20 | 0.28% | 0.36% | 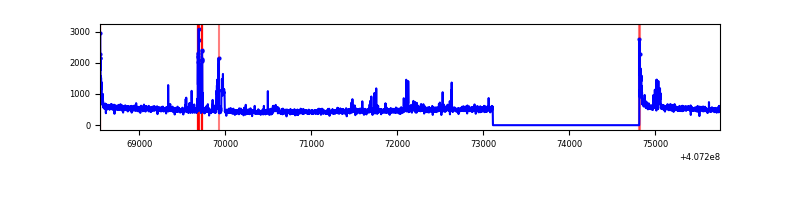 |
| D | 7208 | 5506 | 280 | 280 | 3.88% | 5.09% | 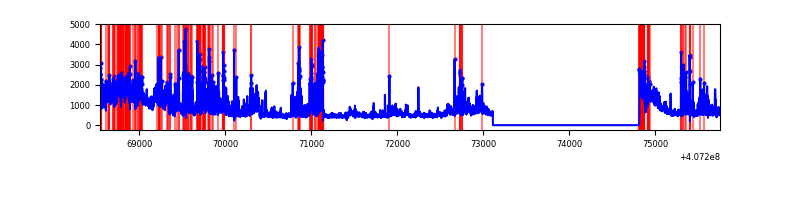 |
Top three noisy pixels from each quadrant. If the there are fewer than three noisy pixels in the level2.evt file, extra rows are filled as -1
| Pixel properties | Quadrant properties | ||||||
|---|---|---|---|---|---|---|---|
| Quadrant | DetID | PixID | Counts | Sigma | Mean | Median | Sigma |
| A | 10 | 83 | 406524 | 3188.85 | 623 | 610 | 127.3 |
| A | 9 | 254 | 201096 | 1575.01 | 623 | 610 | 127.3 |
| A | 13 | 248 | 65728 | 511.57 | 623 | 610 | 127.3 |
| B | 5 | 200 | 207288 | 1706.96 | 621 | 603 | 121.1 |
| B | 4 | 171 | 194121 | 1598.22 | 621 | 603 | 121.1 |
| B | 5 | 184 | 32377 | 262.41 | 621 | 603 | 121.1 |
| C | 15 | 214 | 245031 | 1701.95 | 612 | 618 | 143.6 |
| C | 15 | 208 | 91194 | 630.72 | 612 | 618 | 143.6 |
| C | 0 | 10 | 57613 | 396.88 | 612 | 618 | 143.6 |
| D | 12 | 235 | 1312050 | 8920.77 | 597 | 581 | 147.0 |
| D | 2 | 16 | 419021 | 2846.28 | 597 | 581 | 147.0 |
| D | 10 | 118 | 371128 | 2520.51 | 597 | 581 | 147.0 |
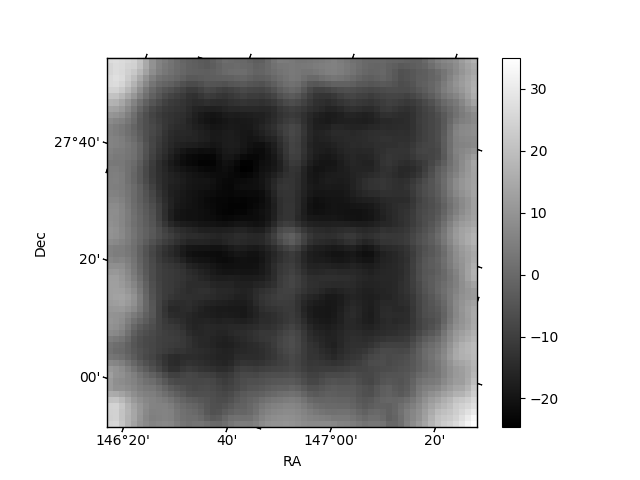
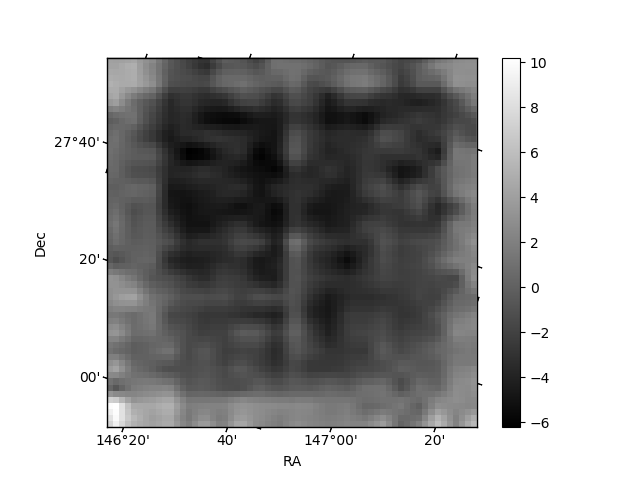
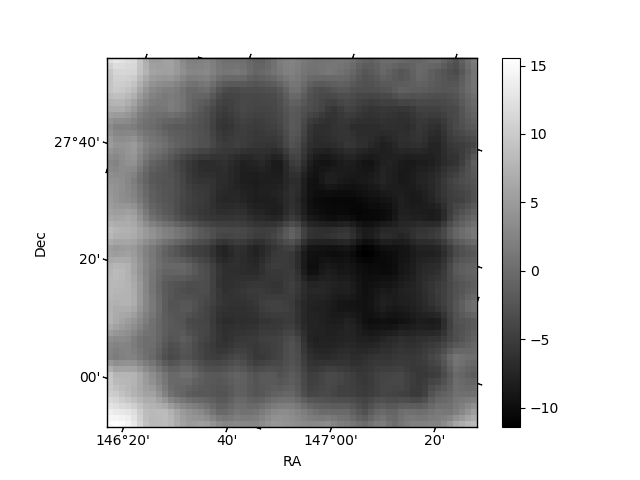
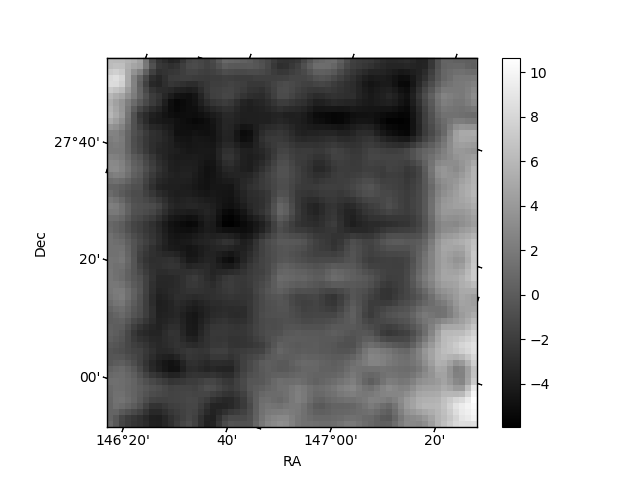
Histogram calculated using DETX and DETY for each event in the final _common_clean file
| Quadrant A | 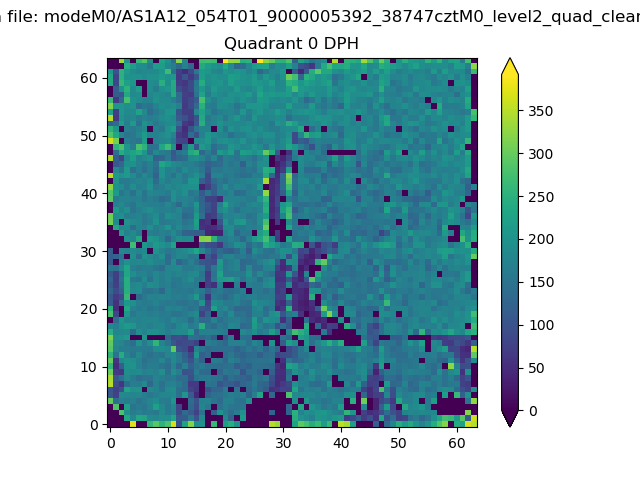 |
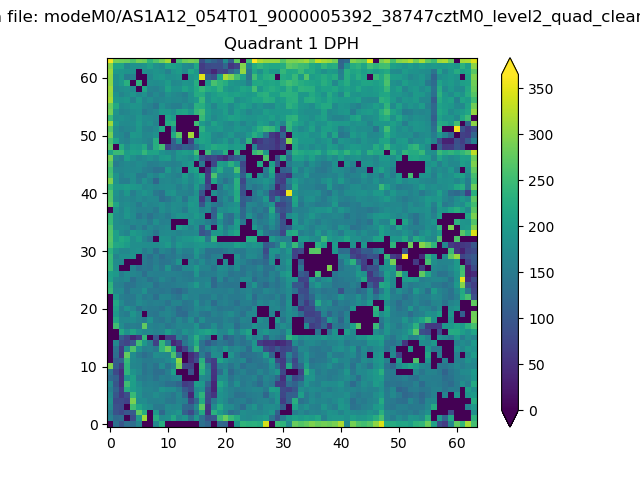 |
Quadrant B |
|---|---|---|---|
| Quadrant D | 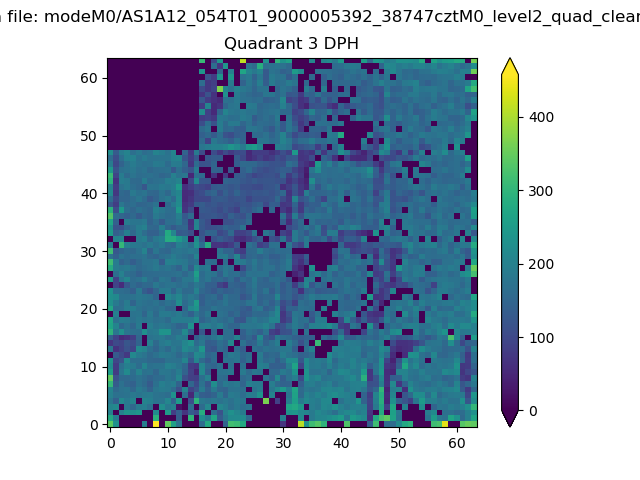 |
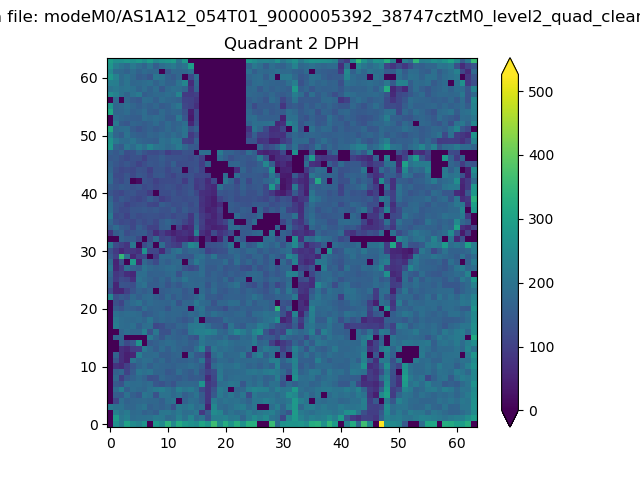 |
Quadrant C |
| Plot type | Count rate plots | Images |
|---|---|---|
| Comparison with Poisson distribution Blue bars denote a histogram of data divided into 1 sec bins. Red curve is a Poisson curve with rate = median count rate of data. |
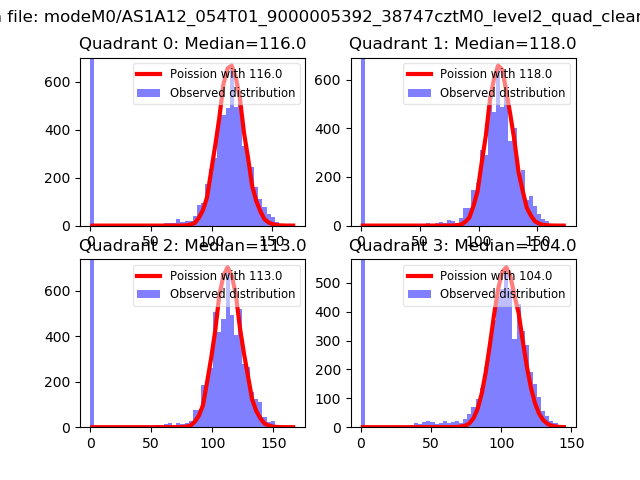 |
 |
| Quadrant-wise count rates Data is divided into 100 sec bins |
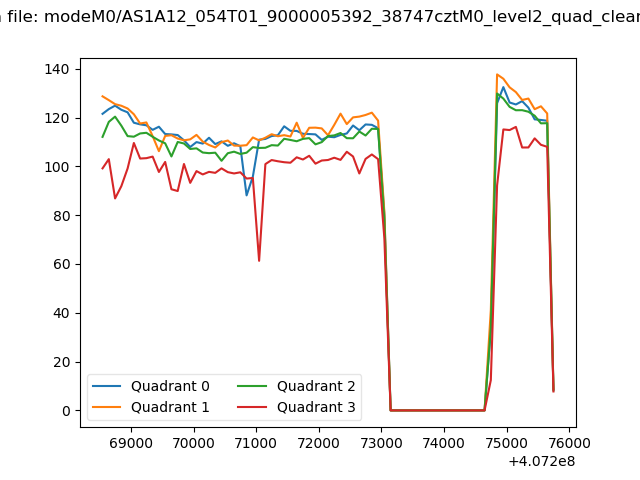 |
|
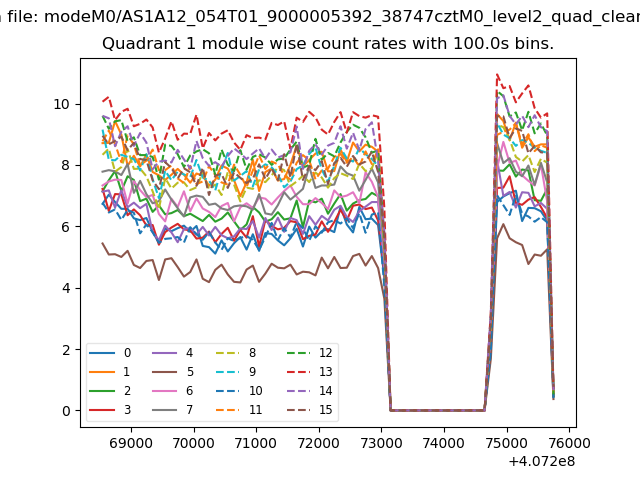
| Module-wise count rates for Quadrant A Data is divided into 100 sec bins |
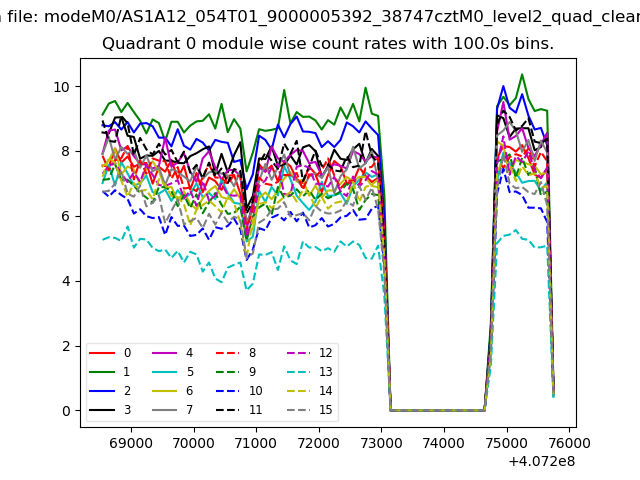 |
 |
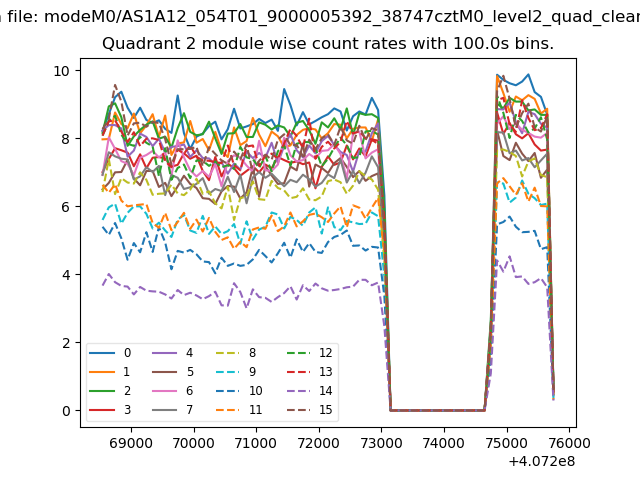
| Module-wise count rates for Quadrant B Data is divided into 100 sec bins |
 |
 |
| Module-wise count rates for Quadrant C Data is divided into 100 sec bins |
 |
 |
| Module-wise count rates for Quadrant D Data is divided into 100 sec bins |
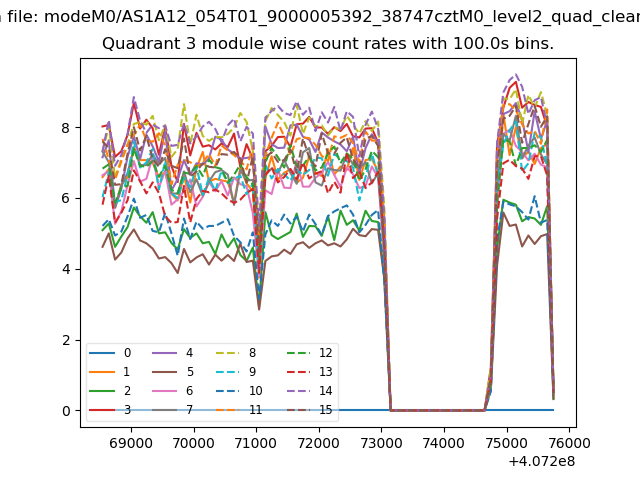 |
 |
| Parameter | Plot |
|---|---|
| CZT HV Monitor | 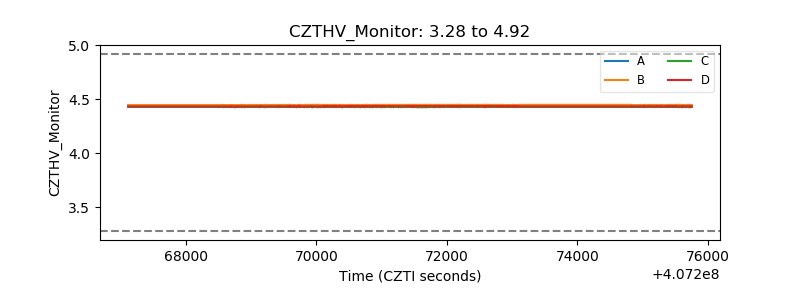 |
| D_VDD | 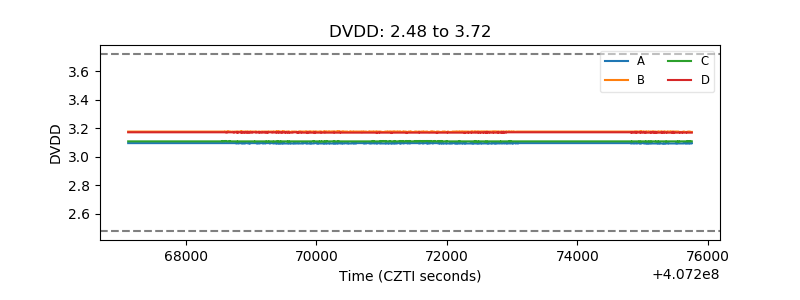 |
| Temperature 1 | 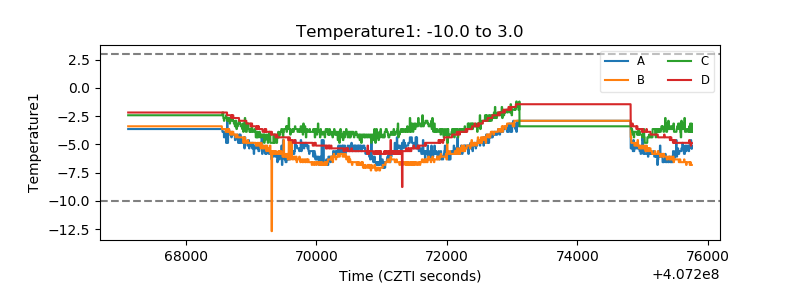 |
| Veto HV Monitor | 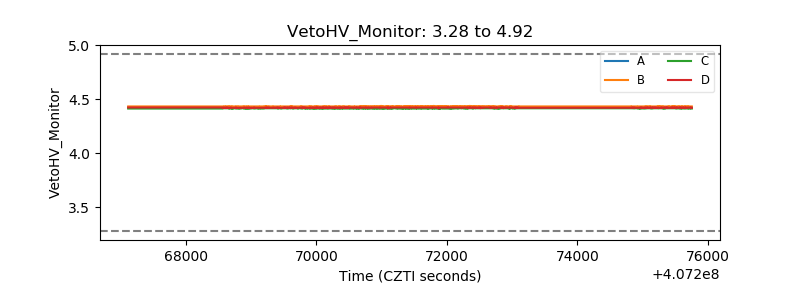 |
| Veto LLD | 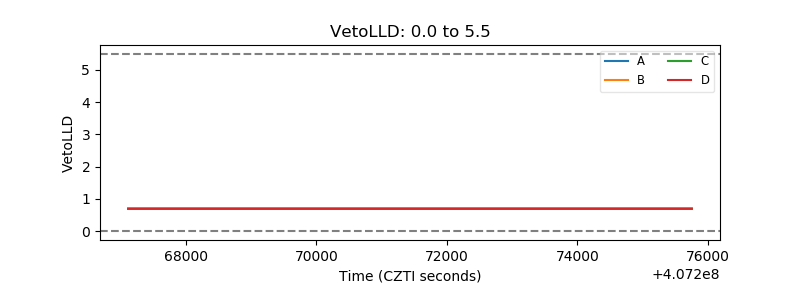 |
| Alpha Counter | 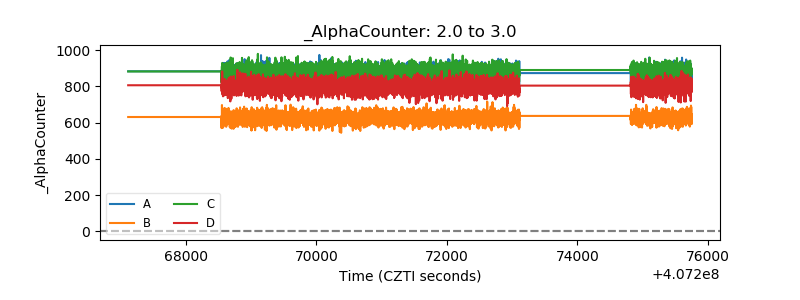 |
| _CPM_Rate | 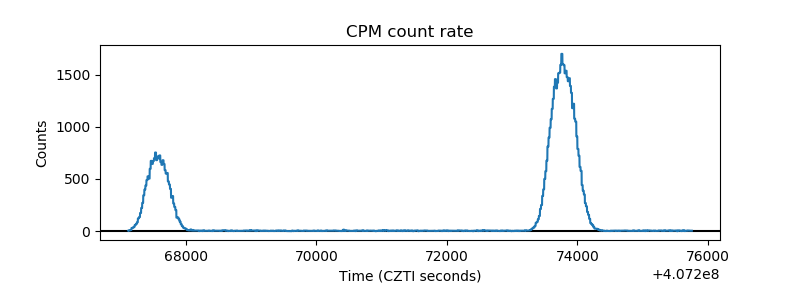 |
| CZT Counter | 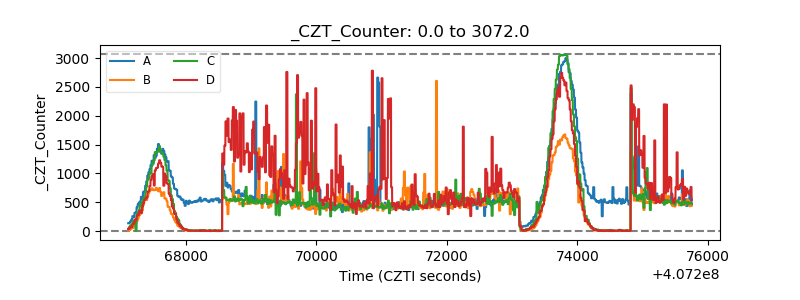 |
| +2.5 Volts monitor | 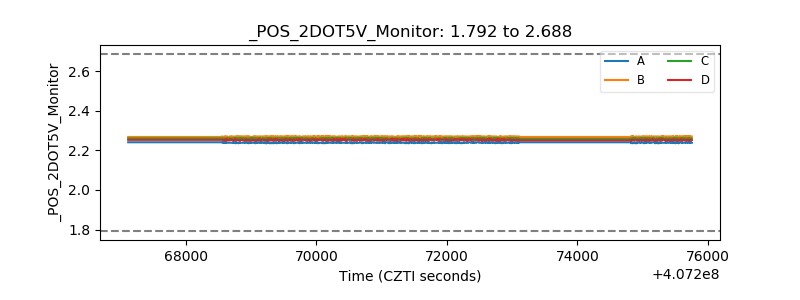 |
| +5 Volts monitor | 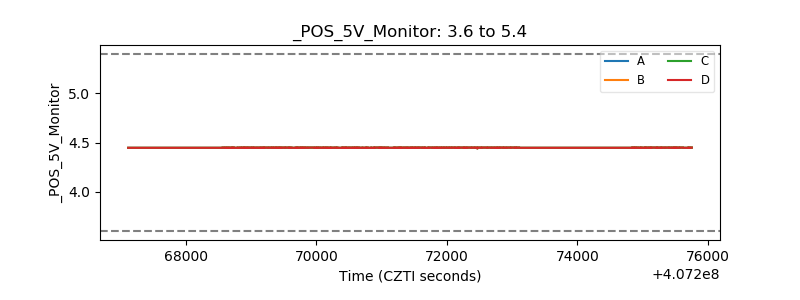 |
| _ROLL_ROT | 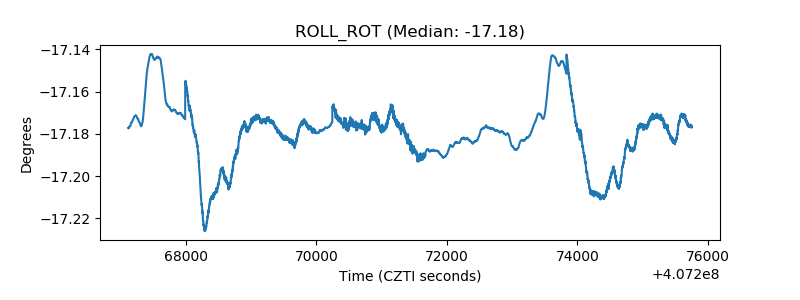 |
| _Roll_DEC | 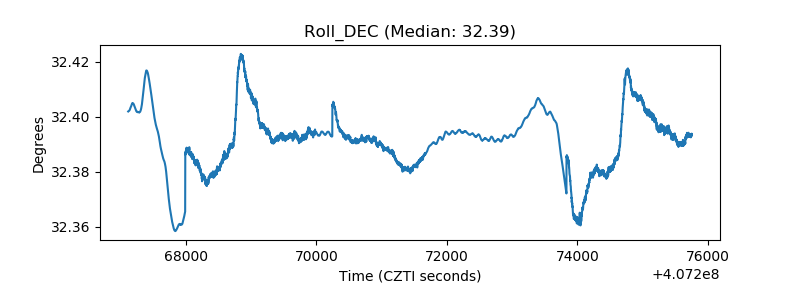 |
| _Roll_RA | 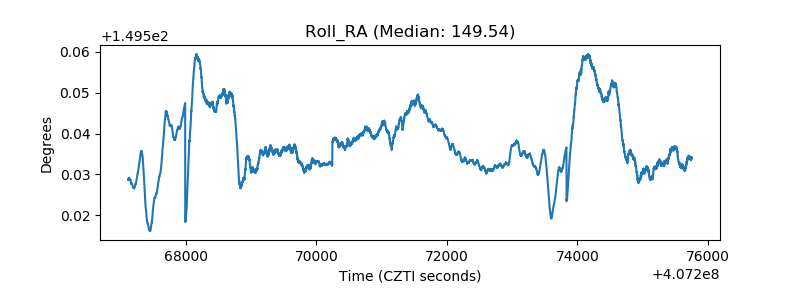 |
| Veto Counter | 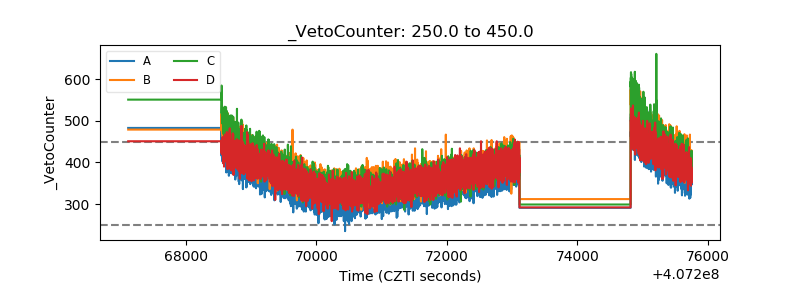 |