| Param | Original file | Final file |
|---|---|---|
| Filename | modeM0/AS1A12_054T01_9000005392_38750cztM0_level2.fits | modeM0/AS1A12_054T01_9000005392_38750cztM0_level2_quad_clean.evt |
| Size (bytes) | 314,009,280 | 90,688,320 |
| Size | 299.5 MB | 86.5 MB |
| Events in quadrant A | 2,761,440 | 615,714 |
| Events in quadrant B | 2,491,507 | 638,141 |
| Events in quadrant C | 2,606,751 | 599,071 |
| Events in quadrant D | 3,374,126 | 542,536 |
| Mode M9 | |||
|---|---|---|---|
| Quadrant | BADHDUFLAG | Total packets | Discarded packets |
| A | 0 | 30 | 0 |
| B | 0 | 30 | 0 |
| C | 0 | 30 | 0 |
| D | 0 | 31 | 0 |
| Mode SS | |||
|---|---|---|---|
| Quadrant | BADHDUFLAG | Total packets | Discarded packets |
| A | 0 | 102 | 0 |
| B | 0 | 102 | 0 |
| C | 0 | 102 | 0 |
| D | 0 | 102 | 0 |
| Mode M0 | |||
|---|---|---|---|
| Quadrant | BADHDUFLAG | Total packets | Discarded packets |
| A | 0 | 11308 | 3 |
| B | 0 | 10626 | 2 |
| C | 0 | 10771 | 2 |
| D | 0 | 13394 | 2 |
| Quadrant | Total seconds | Saturated seconds | Saturation percentage |
|---|---|---|---|
| A | 5003 | 37 | 0.739556% |
| B | 5003 | 24 | 0.479712% |
| C | 5003 | 27 | 0.539676% |
| D | 5003 | 119 | 2.378573% |
Noise dominated data is calculated using 1-second bins in cleaned event files. If a bin has >2000 counts, and if more than 50% of those come from <1% of pixels, then it is considered to be noise-dominated and hence unusable.
| Quadrant | # 1 sec bins | Bins with >0 counts | Bins with >2000 counts | High rate bins dominated by noise | Noise dominated (total time) | Noise dominated (detector-on time) | Marked lightcurve |
|---|---|---|---|---|---|---|---|
| A | 6976 | 5004 | 24 | 24 | 0.34% | 0.48% | 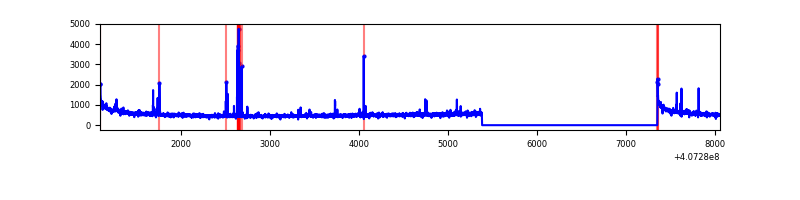 |
| B | 6976 | 5004 | 12 | 12 | 0.17% | 0.24% | 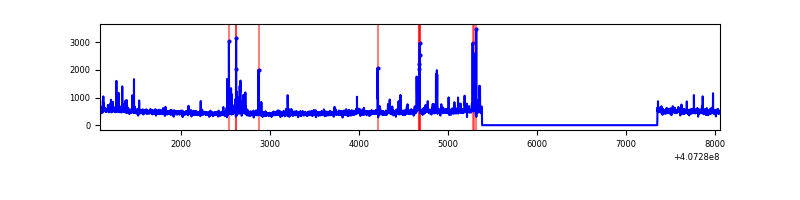 |
| C | 6976 | 5004 | 24 | 24 | 0.34% | 0.48% | 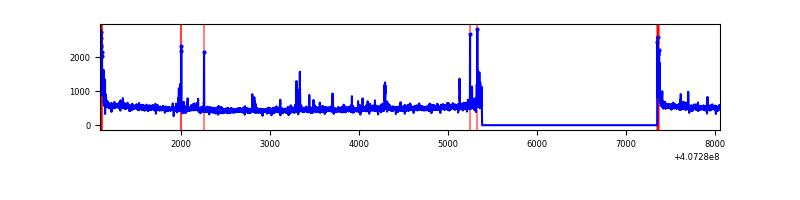 |
| D | 6976 | 5004 | 88 | 88 | 1.26% | 1.76% | 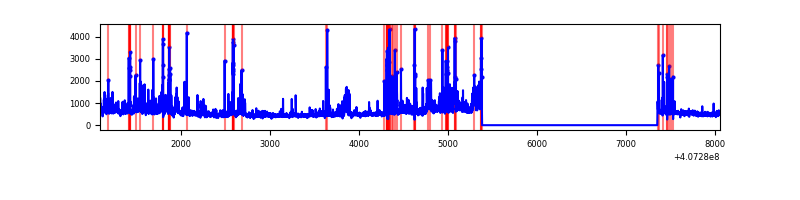 |
Top three noisy pixels from each quadrant. If the there are fewer than three noisy pixels in the level2.evt file, extra rows are filled as -1
| Pixel properties | Quadrant properties | ||||||
|---|---|---|---|---|---|---|---|
| Quadrant | DetID | PixID | Counts | Sigma | Mean | Median | Sigma |
| A | 10 | 83 | 379921 | 3252.58 | 578 | 568 | 116.6 |
| A | 9 | 143 | 110041 | 938.62 | 578 | 568 | 116.6 |
| A | 13 | 248 | 28673 | 240.97 | 578 | 568 | 116.6 |
| B | 4 | 171 | 75106 | 668.61 | 580 | 565 | 111.5 |
| B | 5 | 184 | 53263 | 472.68 | 580 | 565 | 111.5 |
| B | 5 | 172 | 38258 | 338.09 | 580 | 565 | 111.5 |
| C | 15 | 214 | 220889 | 1686.22 | 564 | 570 | 130.7 |
| C | 14 | 254 | 95665 | 727.81 | 564 | 570 | 130.7 |
| C | 0 | 10 | 85810 | 652.39 | 564 | 570 | 130.7 |
| D | 2 | 16 | 423340 | 3140.68 | 552 | 538 | 134.6 |
| D | 10 | 118 | 186437 | 1380.91 | 552 | 538 | 134.6 |
| D | 12 | 227 | 172491 | 1277.31 | 552 | 538 | 134.6 |
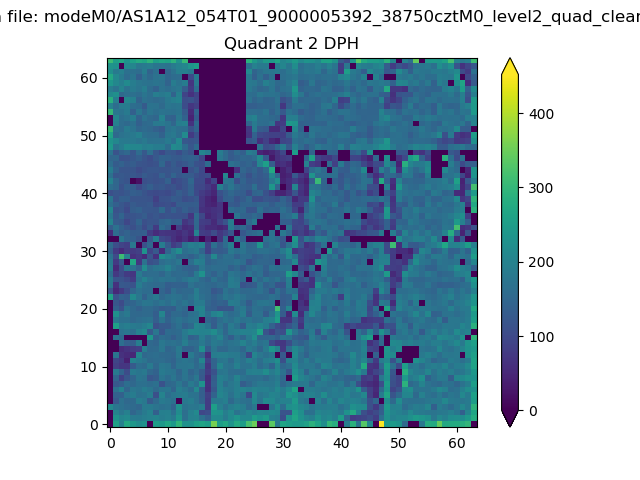
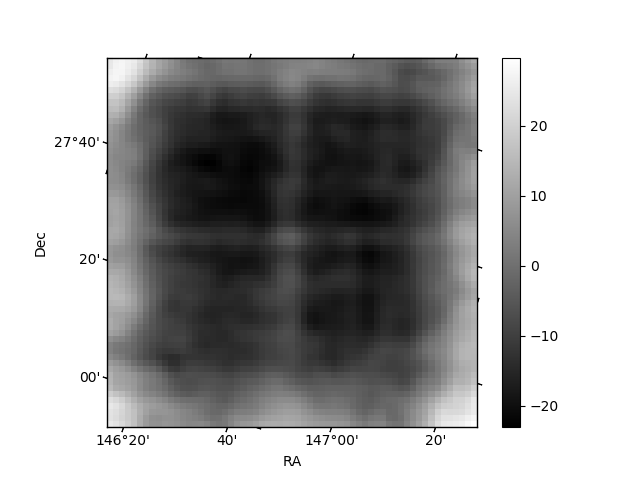
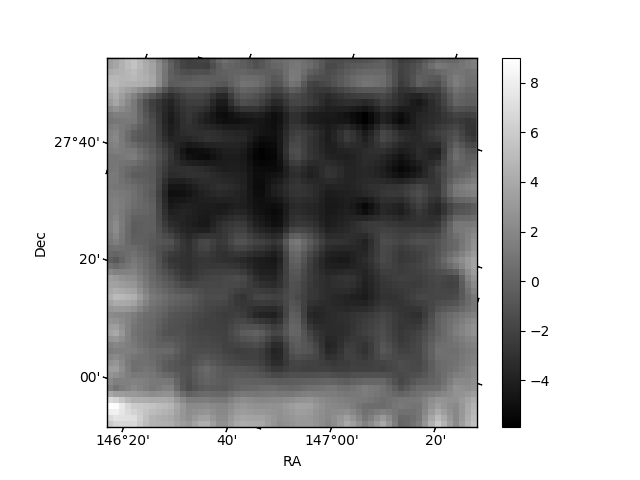
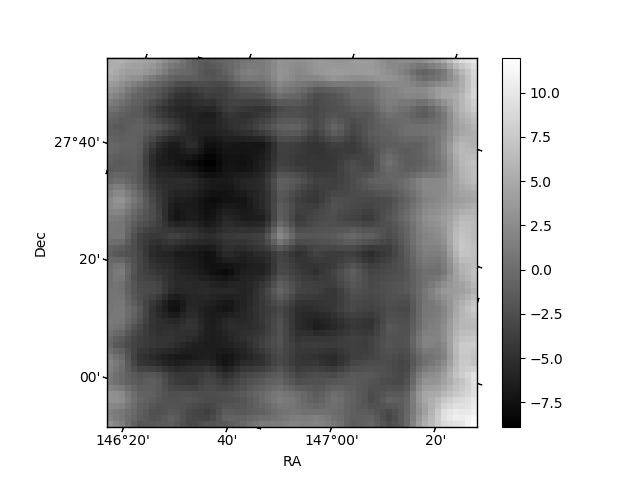
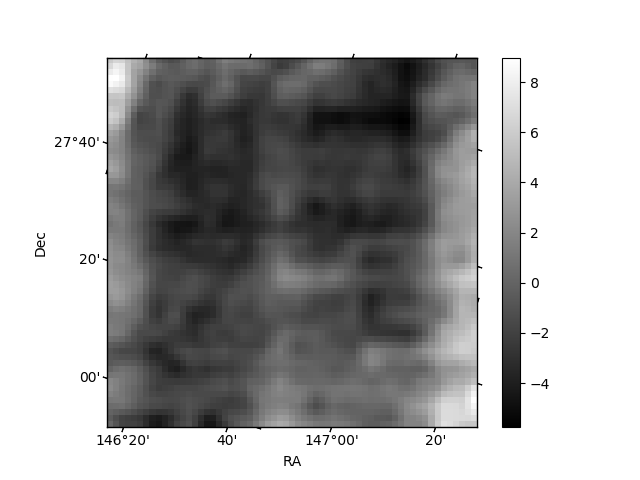
Histogram calculated using DETX and DETY for each event in the final _common_clean file
| Quadrant A | 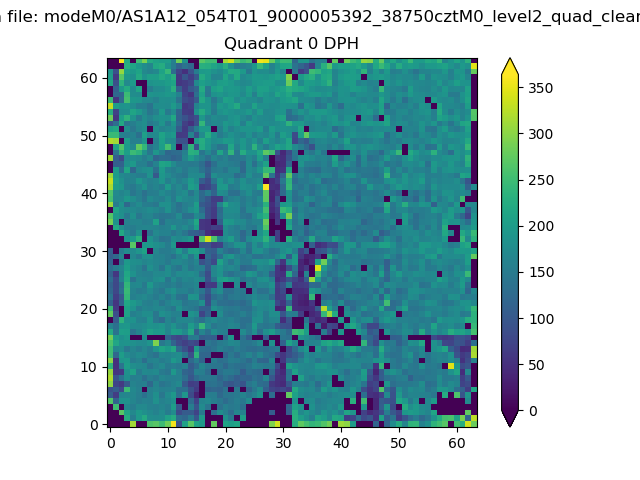 |
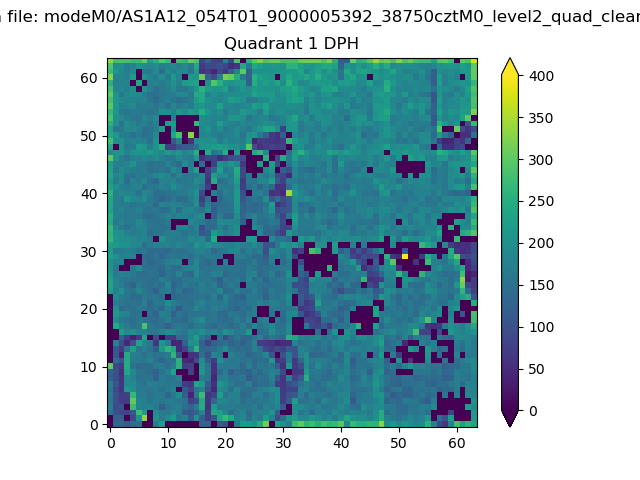 |
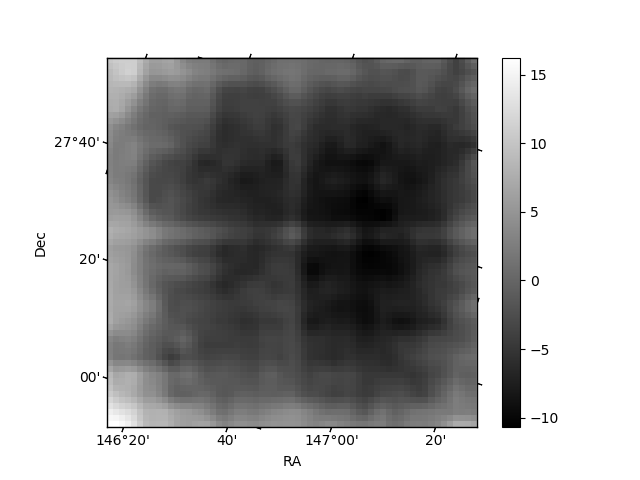
Quadrant B |
|---|---|---|---|
| Quadrant D | 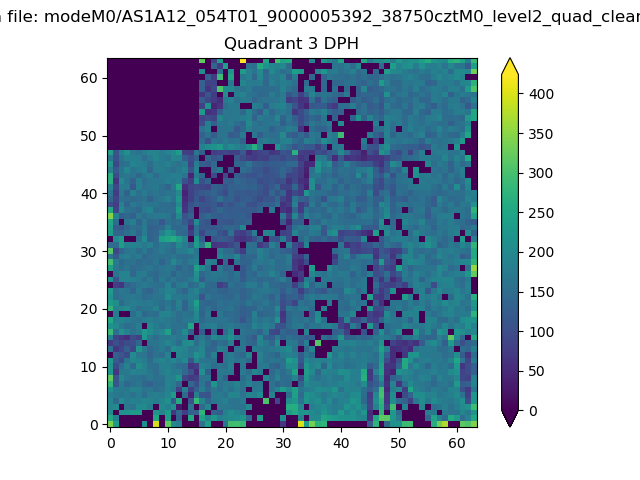 |
 |
Quadrant C |
| Plot type | Count rate plots | Images |
|---|---|---|
| Comparison with Poisson distribution Blue bars denote a histogram of data divided into 1 sec bins. Red curve is a Poisson curve with rate = median count rate of data. |
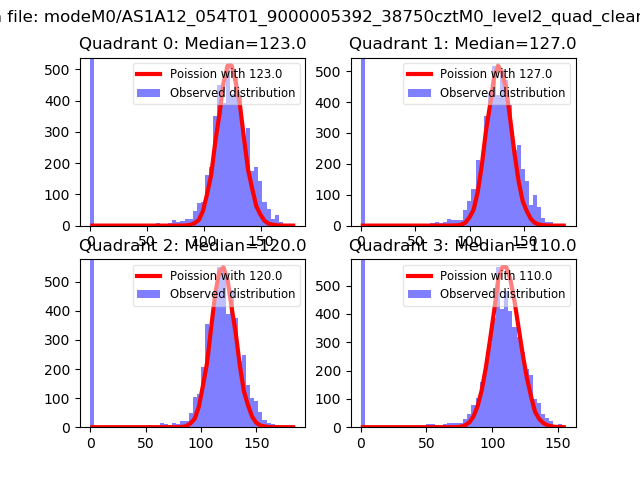 |
 |
| Quadrant-wise count rates Data is divided into 100 sec bins |
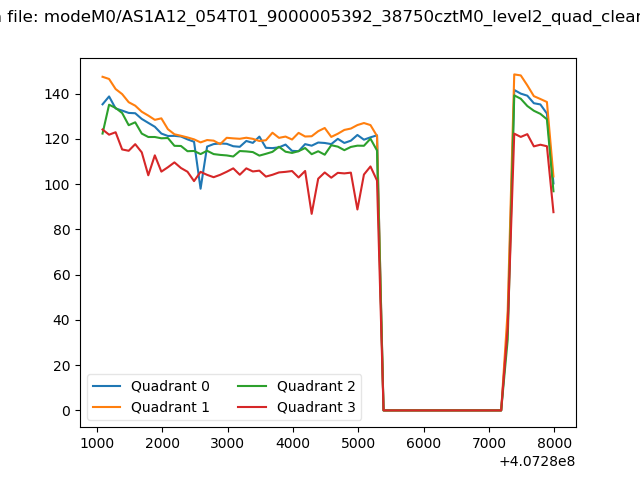 |
|
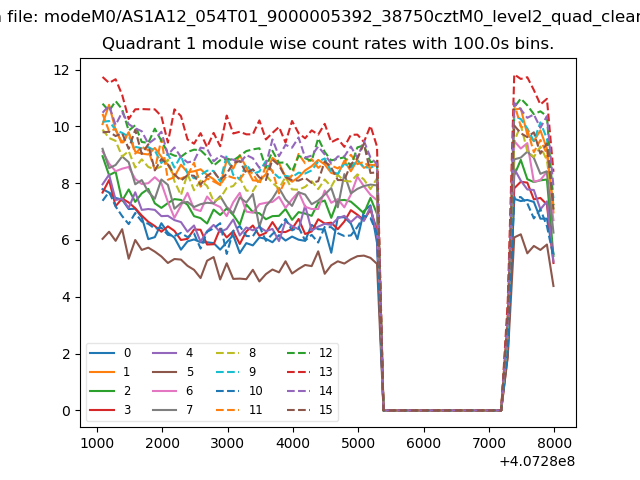
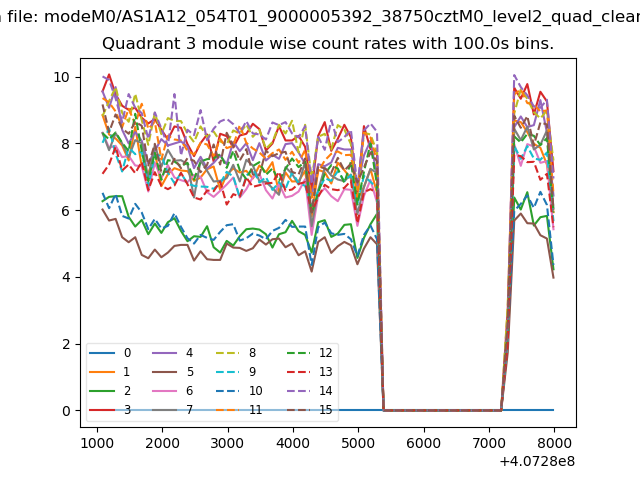
| Module-wise count rates for Quadrant A Data is divided into 100 sec bins |
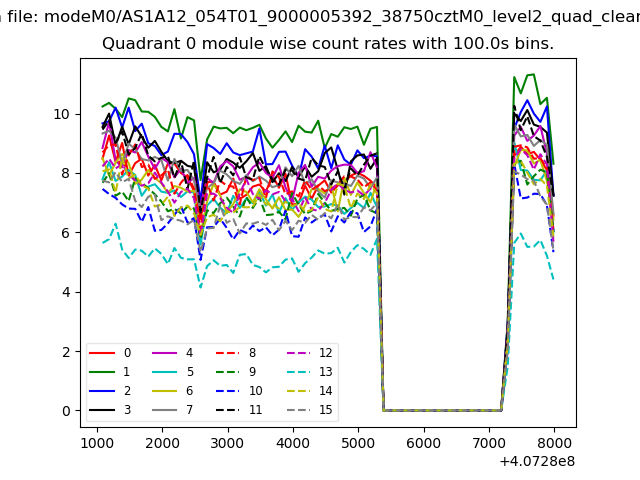 |
 |
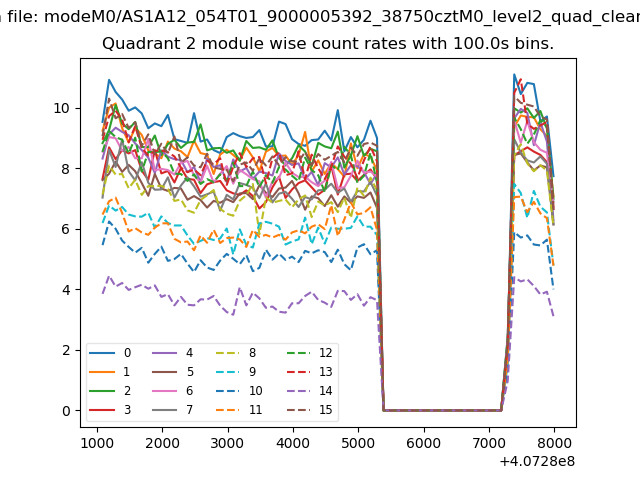
| Module-wise count rates for Quadrant B Data is divided into 100 sec bins |
 |
 |
| Module-wise count rates for Quadrant C Data is divided into 100 sec bins |
 |
 |
| Module-wise count rates for Quadrant D Data is divided into 100 sec bins |
 |
 |
| Parameter | Plot |
|---|---|
| CZT HV Monitor | 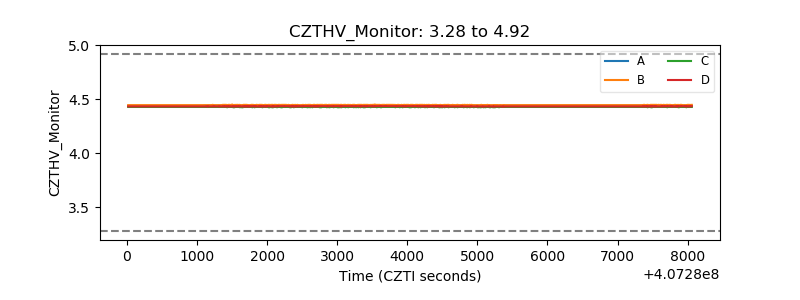 |
| D_VDD | 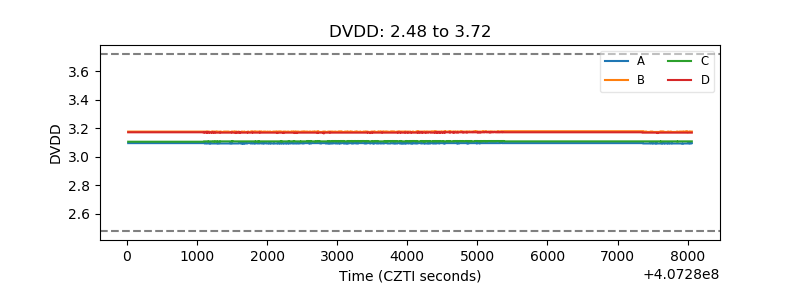 |
| Temperature 1 | 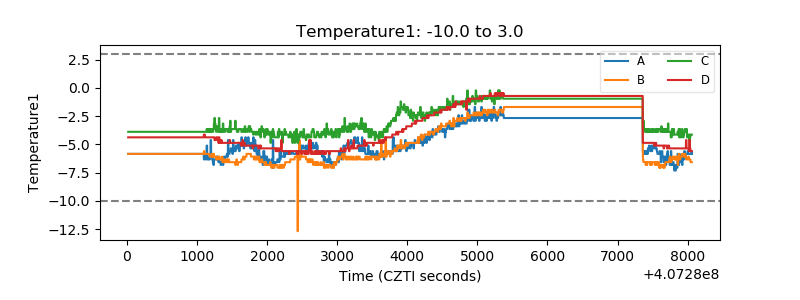 |
| Veto HV Monitor | 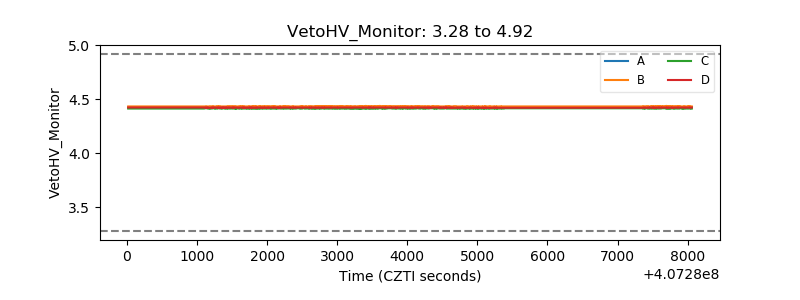 |
| Veto LLD | 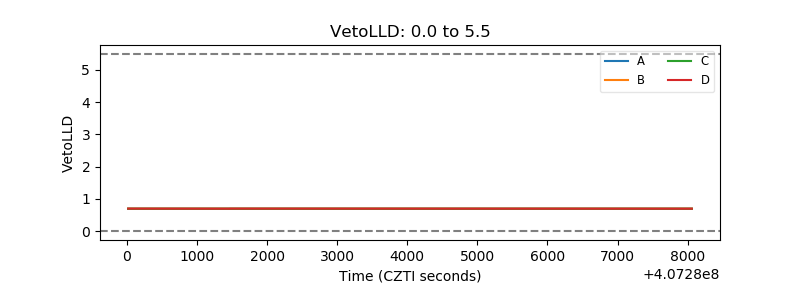 |
| Alpha Counter | 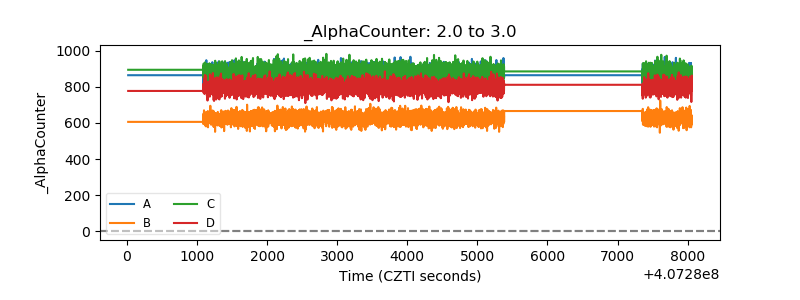 |
| _CPM_Rate | 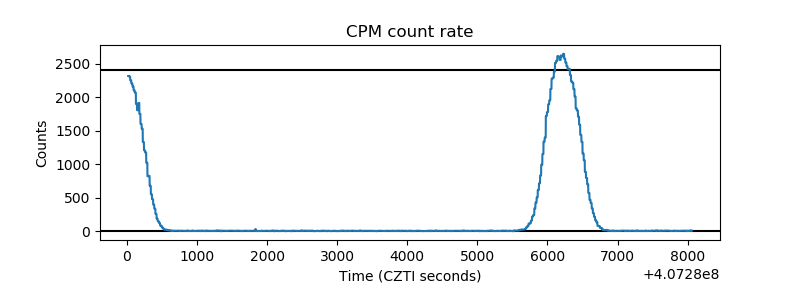 |
| CZT Counter | 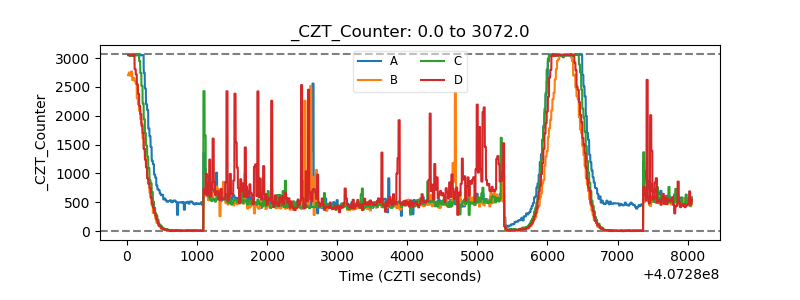 |
| +2.5 Volts monitor | 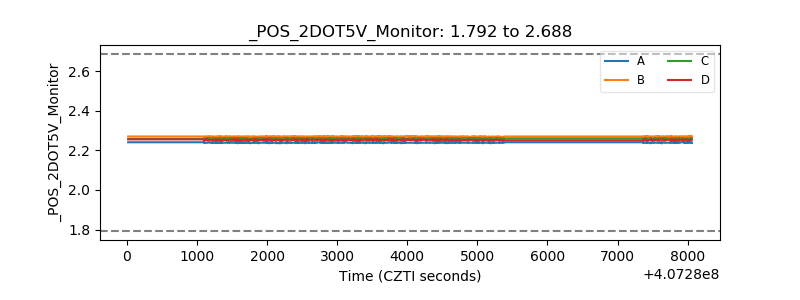 |
| +5 Volts monitor | 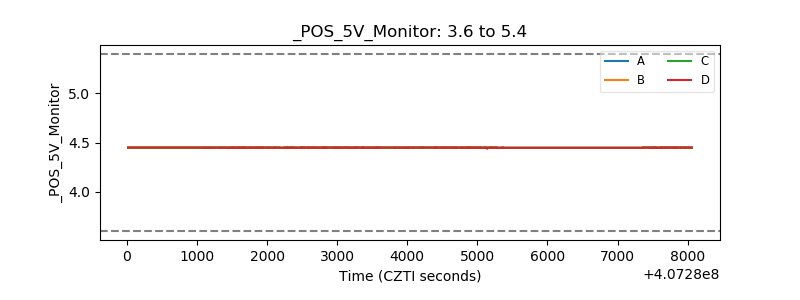 |
| _ROLL_ROT | 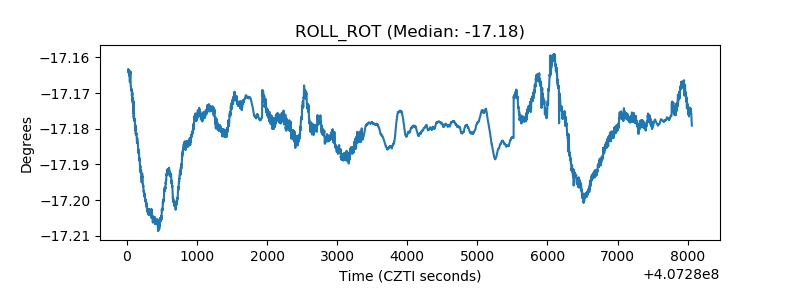 |
| _Roll_DEC | 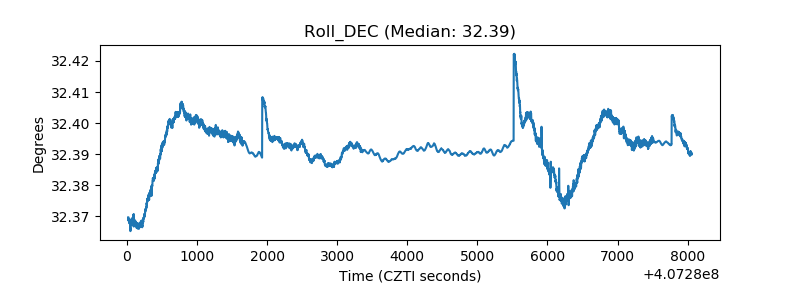 |
| _Roll_RA | 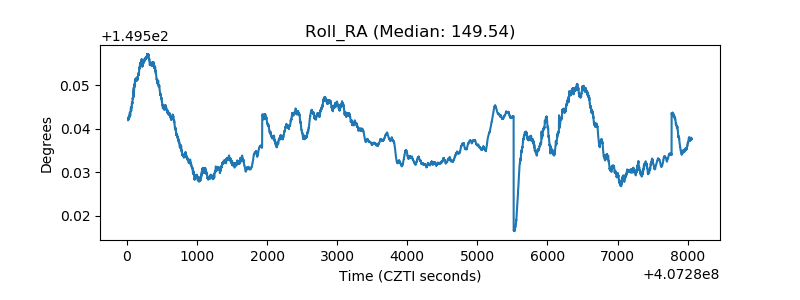 |
| Veto Counter | 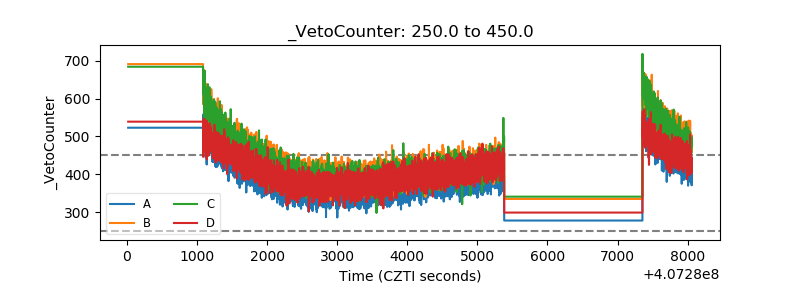 |