| Param | Original file | Final file |
|---|---|---|
| Filename | modeM0/AS1A12_054T01_9000005392_38751cztM0_level2.fits | modeM0/AS1A12_054T01_9000005392_38751cztM0_level2_quad_clean.evt |
| Size (bytes) | 332,596,800 | 97,263,360 |
| Size | 317.2 MB | 92.8 MB |
| Events in quadrant A | 2,843,094 | 665,791 |
| Events in quadrant B | 2,549,872 | 687,736 |
| Events in quadrant C | 3,279,758 | 634,373 |
| Events in quadrant D | 3,226,651 | 587,440 |
| Mode M9 | |||
|---|---|---|---|
| Quadrant | BADHDUFLAG | Total packets | Discarded packets |
| A | 0 | 31 | 0 |
| B | 0 | 31 | 0 |
| C | 0 | 31 | 0 |
| D | 0 | 32 | 0 |
| Mode SS | |||
|---|---|---|---|
| Quadrant | BADHDUFLAG | Total packets | Discarded packets |
| A | 0 | 106 | 0 |
| B | 0 | 106 | 0 |
| C | 0 | 106 | 0 |
| D | 0 | 106 | 0 |
| Mode M0 | |||
|---|---|---|---|
| Quadrant | BADHDUFLAG | Total packets | Discarded packets |
| A | 0 | 11673 | 3 |
| B | 0 | 10967 | 2 |
| C | 0 | 12969 | 2 |
| D | 0 | 13099 | 2 |
| Quadrant | Total seconds | Saturated seconds | Saturation percentage |
|---|---|---|---|
| A | 5293 | 14 | 0.264500% |
| B | 5293 | 25 | 0.472322% |
| C | 5293 | 144 | 2.720574% |
| D | 5293 | 70 | 1.322501% |
Noise dominated data is calculated using 1-second bins in cleaned event files. If a bin has >2000 counts, and if more than 50% of those come from <1% of pixels, then it is considered to be noise-dominated and hence unusable.
| Quadrant | # 1 sec bins | Bins with >0 counts | Bins with >2000 counts | High rate bins dominated by noise | Noise dominated (total time) | Noise dominated (detector-on time) | Marked lightcurve |
|---|---|---|---|---|---|---|---|
| A | 7356 | 5294 | 6 | 6 | 0.08% | 0.11% | 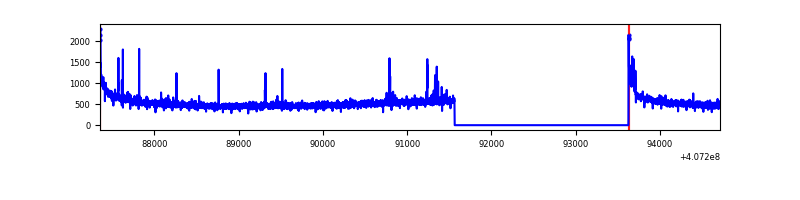 |
| B | 7356 | 5294 | 16 | 16 | 0.22% | 0.30% | 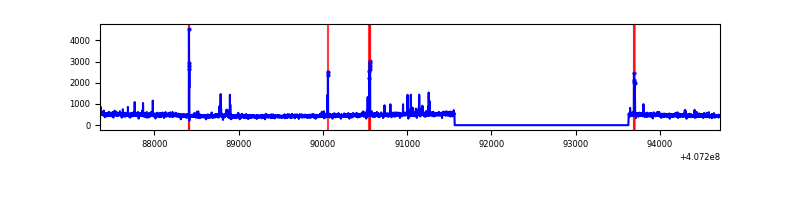 |
| C | 7356 | 5294 | 133 | 133 | 1.81% | 2.51% | 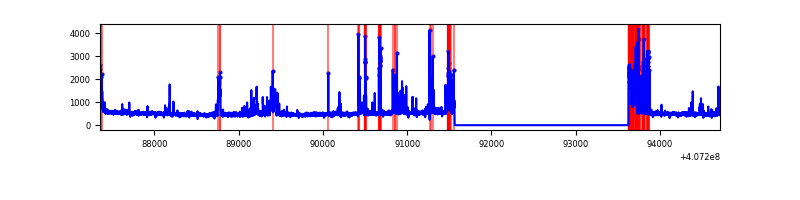 |
| D | 7356 | 5294 | 56 | 56 | 0.76% | 1.06% | 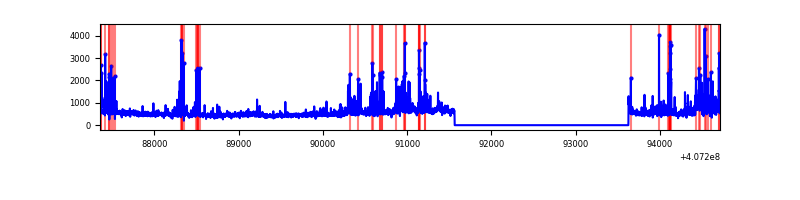 |
Top three noisy pixels from each quadrant. If the there are fewer than three noisy pixels in the level2.evt file, extra rows are filled as -1
| Pixel properties | Quadrant properties | ||||||
|---|---|---|---|---|---|---|---|
| Quadrant | DetID | PixID | Counts | Sigma | Mean | Median | Sigma |
| A | 10 | 83 | 393253 | 3152.92 | 614 | 603 | 124.5 |
| A | 13 | 248 | 48419 | 383.96 | 614 | 603 | 124.5 |
| A | 9 | 143 | 24503 | 191.91 | 614 | 603 | 124.5 |
| B | 5 | 172 | 41893 | 354.67 | 615 | 600 | 116.4 |
| B | 5 | 184 | 34881 | 294.45 | 615 | 600 | 116.4 |
| B | 4 | 171 | 25197 | 211.27 | 615 | 600 | 116.4 |
| C | 14 | 254 | 418251 | 3029.67 | 592 | 595 | 137.9 |
| C | 15 | 214 | 231375 | 1674.07 | 592 | 595 | 137.9 |
| C | 15 | 208 | 213303 | 1542.98 | 592 | 595 | 137.9 |
| D | 2 | 16 | 304940 | 2137.95 | 588 | 573 | 142.4 |
| D | 5 | 222 | 164032 | 1148.18 | 588 | 573 | 142.4 |
| D | 10 | 118 | 145445 | 1017.62 | 588 | 573 | 142.4 |
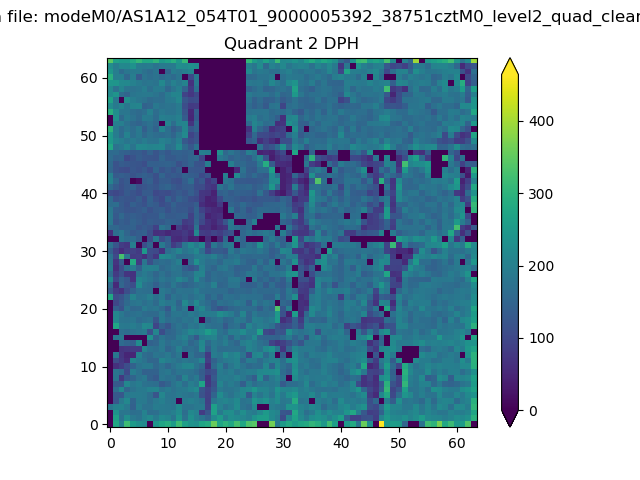
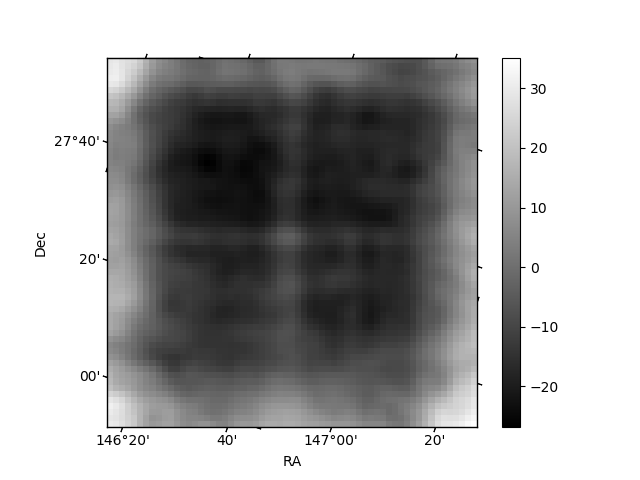
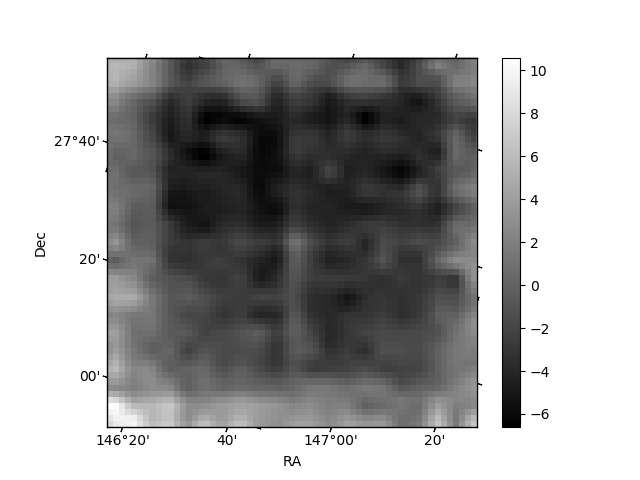
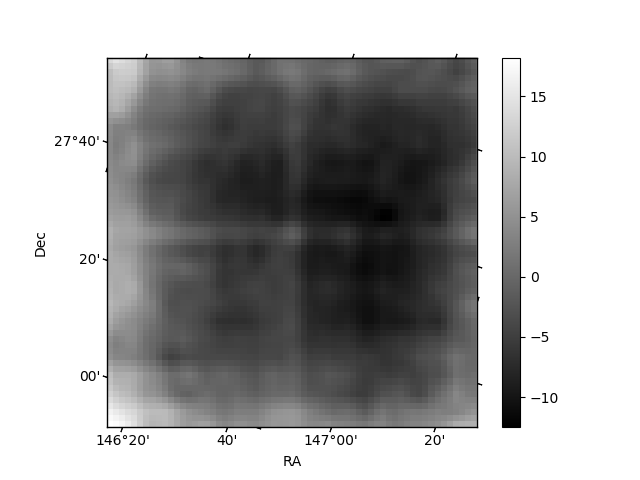
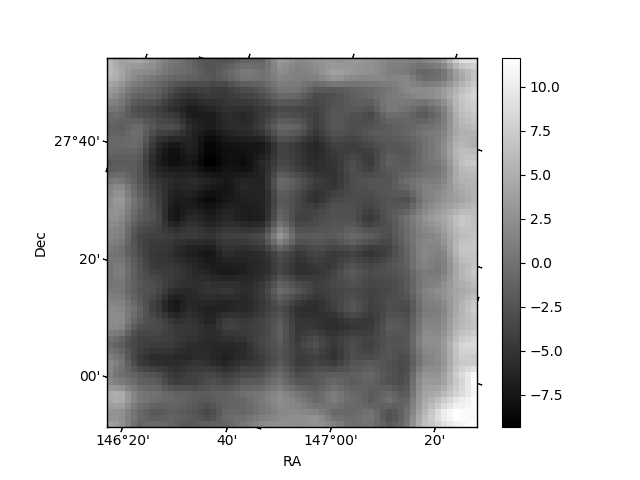
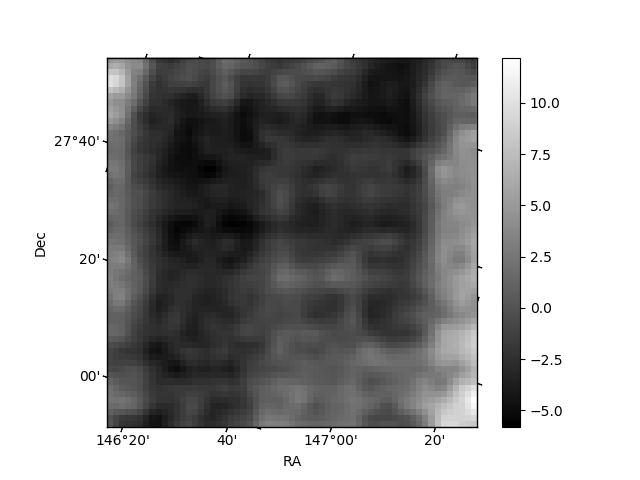
Histogram calculated using DETX and DETY for each event in the final _common_clean file
| Quadrant A | 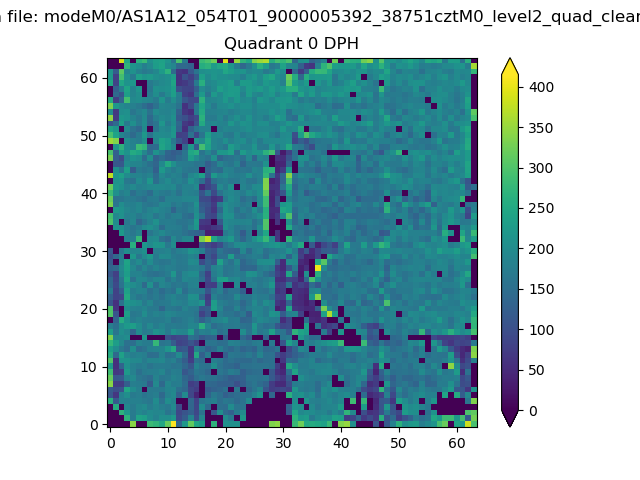 |
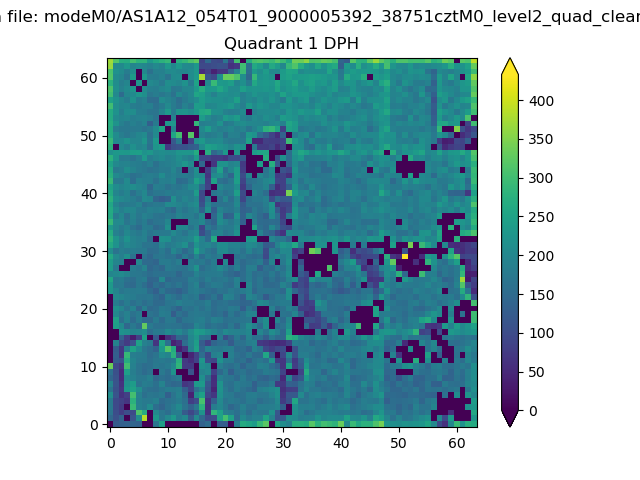 |
Quadrant B |
|---|---|---|---|
| Quadrant D | 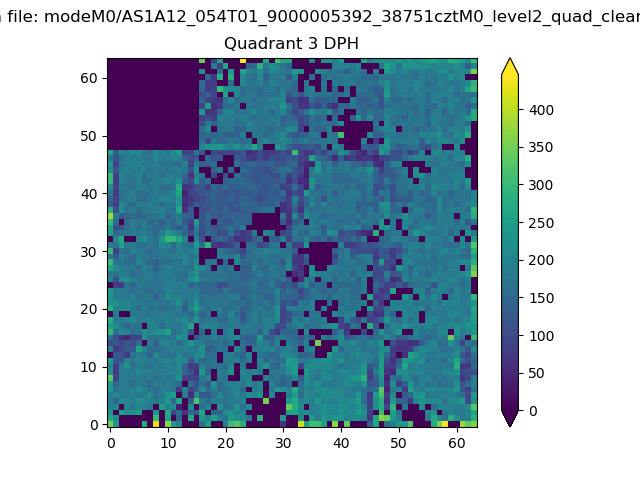 |
 |
Quadrant C |
| Plot type | Count rate plots | Images |
|---|---|---|
| Comparison with Poisson distribution Blue bars denote a histogram of data divided into 1 sec bins. Red curve is a Poisson curve with rate = median count rate of data. |
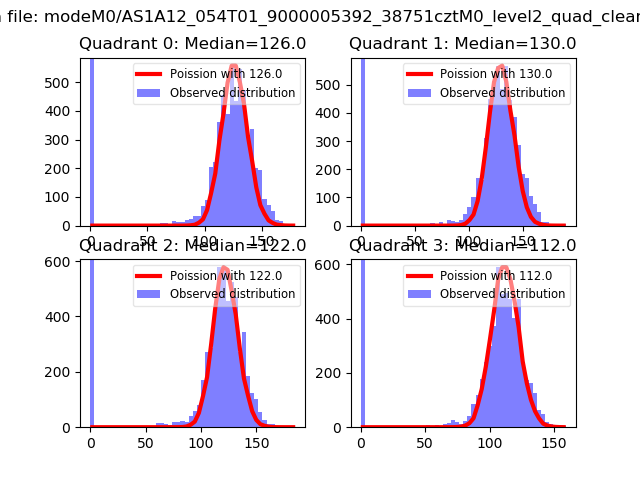 |
 |
| Quadrant-wise count rates Data is divided into 100 sec bins |
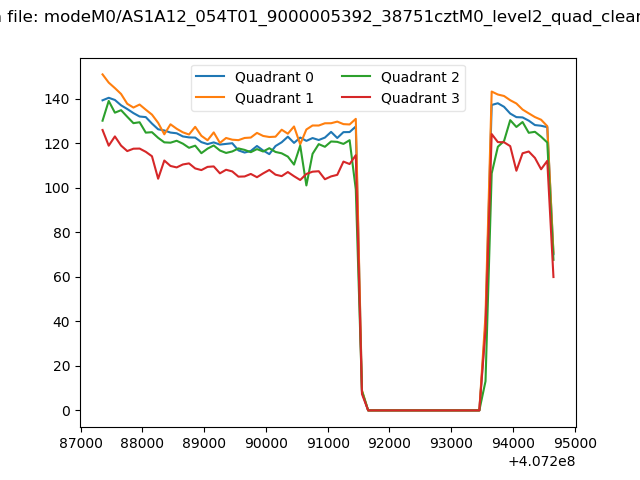 |
|
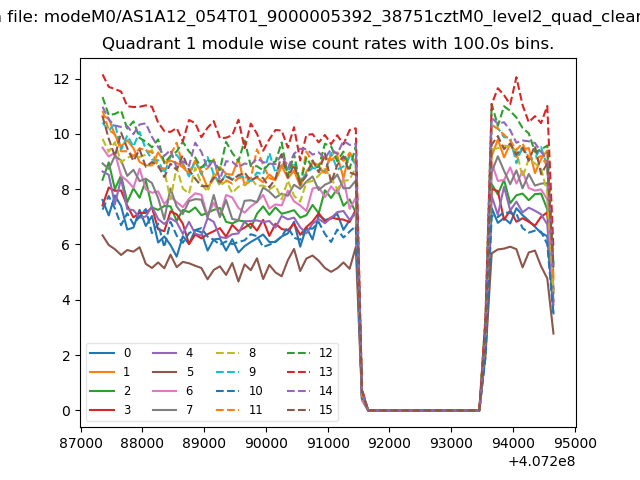
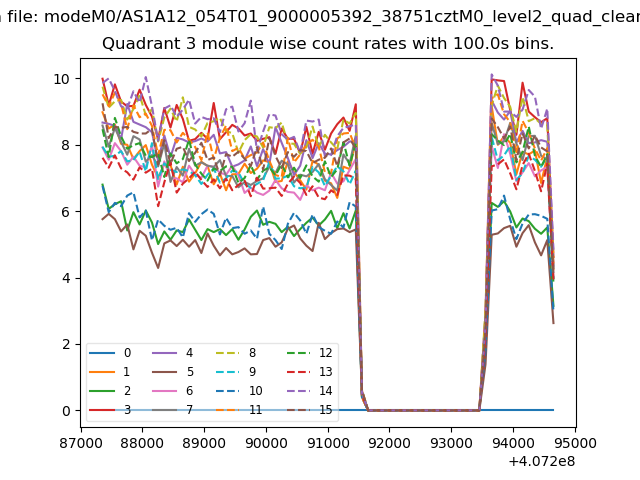
| Module-wise count rates for Quadrant A Data is divided into 100 sec bins |
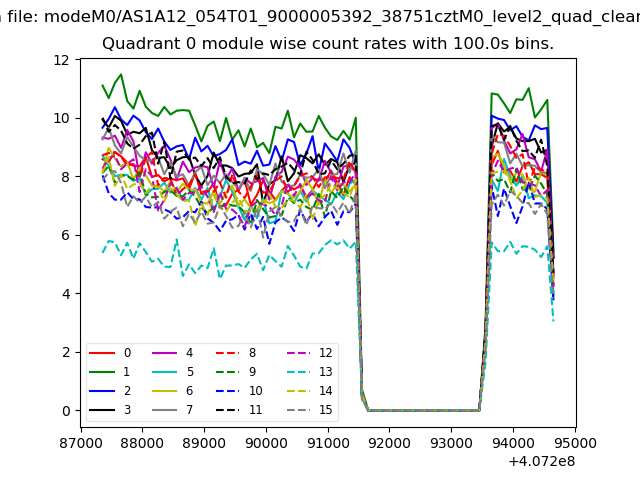 |
 |
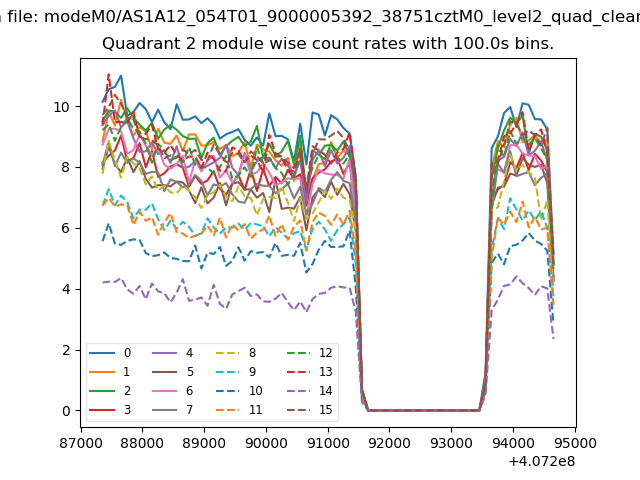
| Module-wise count rates for Quadrant B Data is divided into 100 sec bins |
 |
 |
| Module-wise count rates for Quadrant C Data is divided into 100 sec bins |
 |
 |
| Module-wise count rates for Quadrant D Data is divided into 100 sec bins |
 |
 |
| Parameter | Plot |
|---|---|
| CZT HV Monitor | 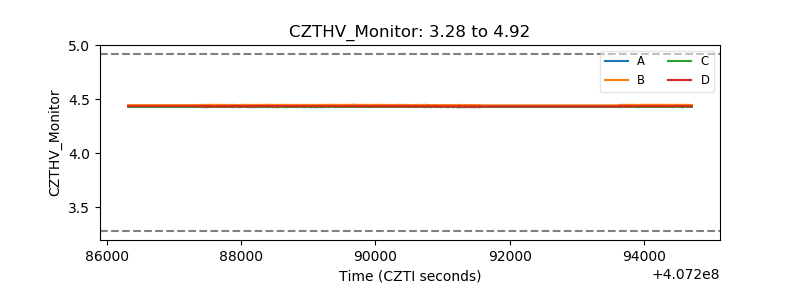 |
| D_VDD | 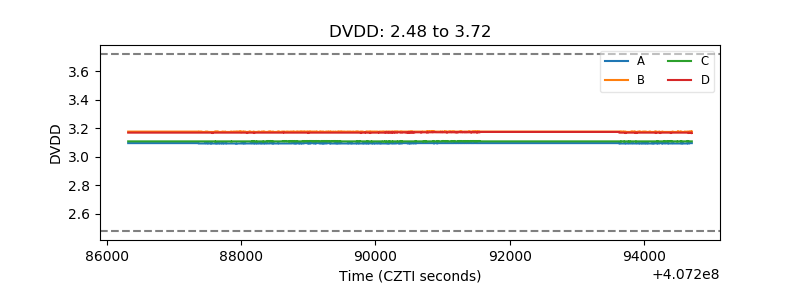 |
| Temperature 1 | 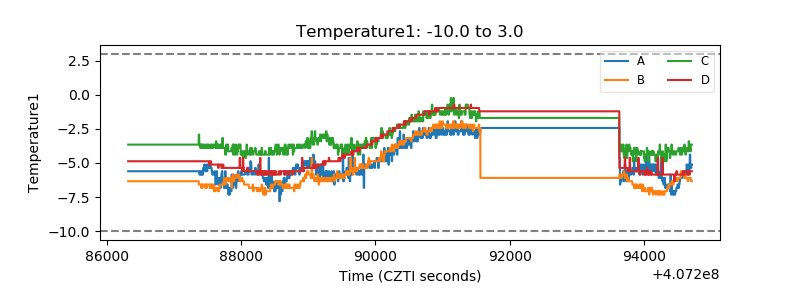 |
| Veto HV Monitor | 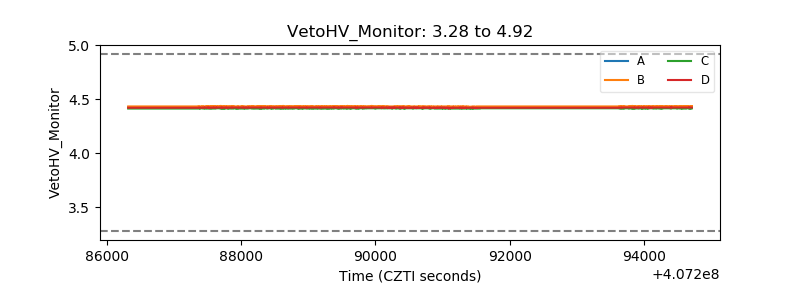 |
| Veto LLD | 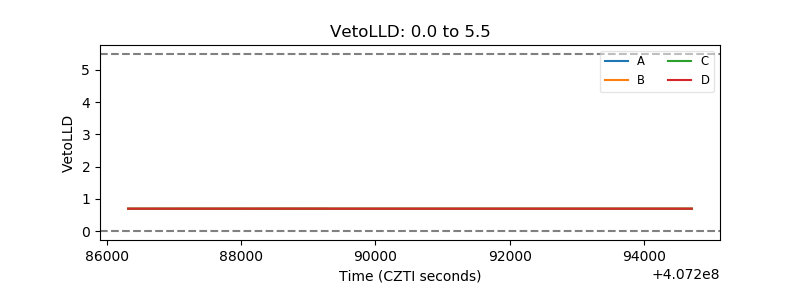 |
| Alpha Counter | 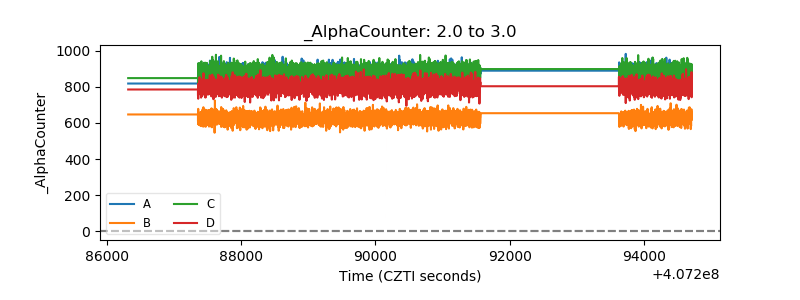 |
| _CPM_Rate | 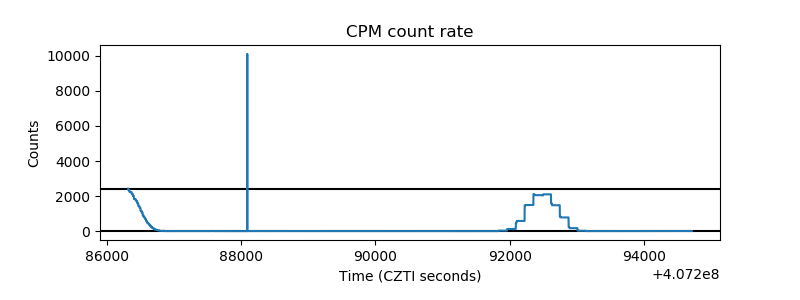 |
| CZT Counter | 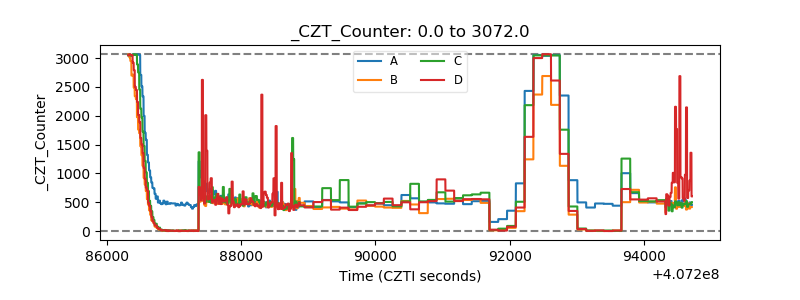 |
| +2.5 Volts monitor | 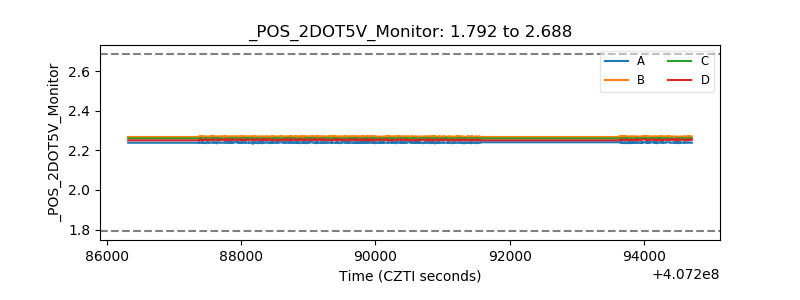 |
| +5 Volts monitor | 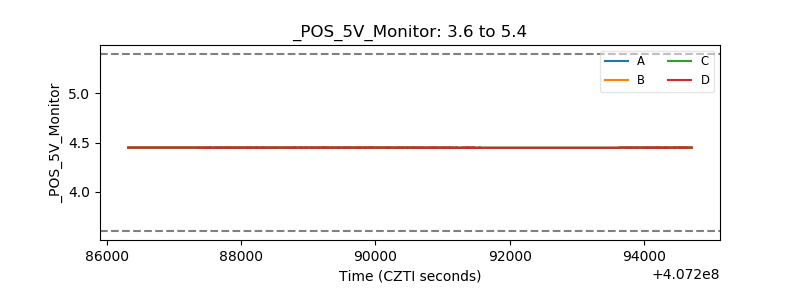 |
| _ROLL_ROT | 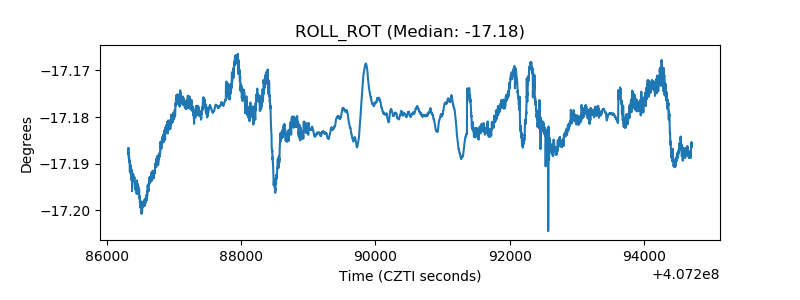 |
| _Roll_DEC | 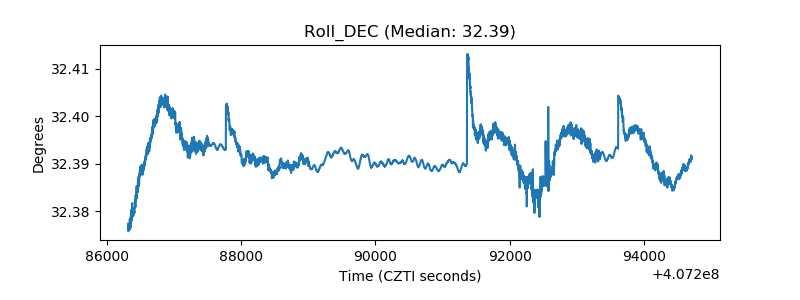 |
| _Roll_RA | 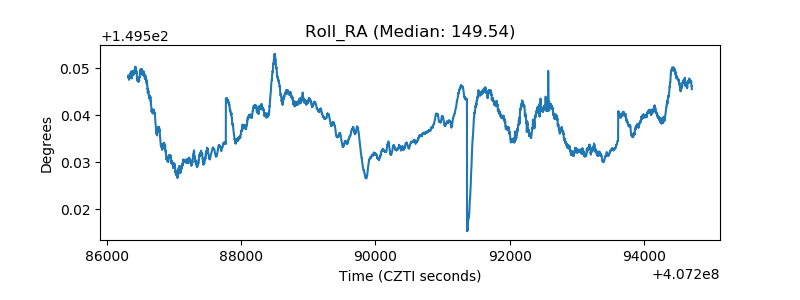 |
| Veto Counter | 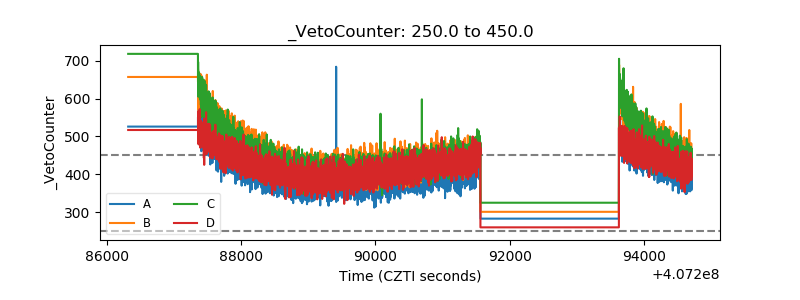 |