| Param | Original file | Final file |
|---|---|---|
| Filename | modeM0/AS1A12_054T01_9000005392_38752cztM0_level2.fits | modeM0/AS1A12_054T01_9000005392_38752cztM0_level2_quad_clean.evt |
| Size (bytes) | 359,455,680 | 95,258,880 |
| Size | 342.8 MB | 90.8 MB |
| Events in quadrant A | 2,813,562 | 651,951 |
| Events in quadrant B | 2,570,950 | 672,112 |
| Events in quadrant C | 2,921,584 | 625,599 |
| Events in quadrant D | 4,589,449 | 565,597 |
| Mode M9 | |||
|---|---|---|---|
| Quadrant | BADHDUFLAG | Total packets | Discarded packets |
| A | 0 | 35 | 0 |
| B | 0 | 35 | 0 |
| C | 0 | 35 | 0 |
| D | 0 | 36 | 0 |
| Mode SS | |||
|---|---|---|---|
| Quadrant | BADHDUFLAG | Total packets | Discarded packets |
| A | 0 | 108 | 0 |
| B | 0 | 108 | 0 |
| C | 0 | 108 | 0 |
| D | 0 | 108 | 0 |
| Mode M0 | |||
|---|---|---|---|
| Quadrant | BADHDUFLAG | Total packets | Discarded packets |
| A | 0 | 11529 | 3 |
| B | 0 | 11133 | 2 |
| C | 0 | 11862 | 2 |
| D | 0 | 17321 | 2 |
| Quadrant | Total seconds | Saturated seconds | Saturation percentage |
|---|---|---|---|
| A | 5273 | 14 | 0.265504% |
| B | 5273 | 45 | 0.853404% |
| C | 5273 | 89 | 1.687844% |
| D | 5273 | 183 | 3.470510% |
Noise dominated data is calculated using 1-second bins in cleaned event files. If a bin has >2000 counts, and if more than 50% of those come from <1% of pixels, then it is considered to be noise-dominated and hence unusable.
| Quadrant | # 1 sec bins | Bins with >0 counts | Bins with >2000 counts | High rate bins dominated by noise | Noise dominated (total time) | Noise dominated (detector-on time) | Marked lightcurve |
|---|---|---|---|---|---|---|---|
| A | 7396 | 5274 | 8 | 8 | 0.11% | 0.15% | 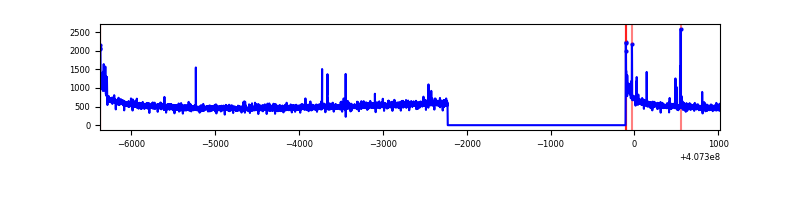 |
| B | 7396 | 5274 | 22 | 22 | 0.30% | 0.42% | 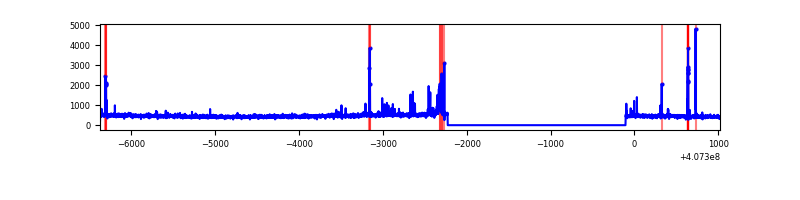 |
| C | 7396 | 5274 | 83 | 83 | 1.12% | 1.57% | 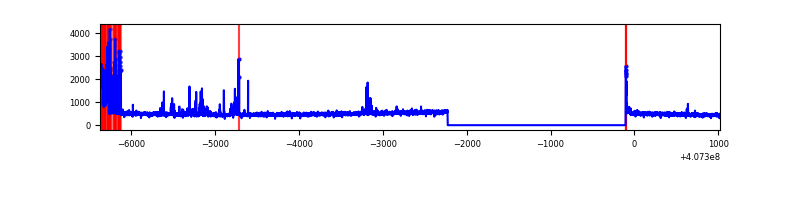 |
| D | 7396 | 5274 | 149 | 149 | 2.01% | 2.83% | 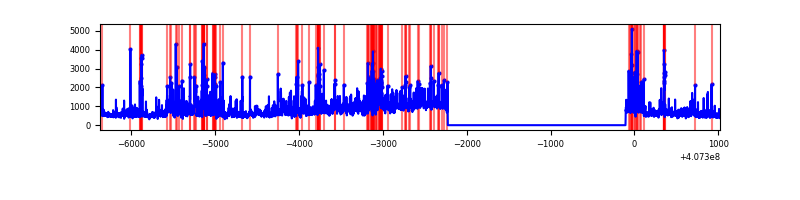 |
Top three noisy pixels from each quadrant. If the there are fewer than three noisy pixels in the level2.evt file, extra rows are filled as -1
| Pixel properties | Quadrant properties | ||||||
|---|---|---|---|---|---|---|---|
| Quadrant | DetID | PixID | Counts | Sigma | Mean | Median | Sigma |
| A | 10 | 83 | 398025 | 3237.48 | 609 | 600 | 122.8 |
| A | 13 | 248 | 31790 | 254.08 | 609 | 600 | 122.8 |
| A | 9 | 143 | 27149 | 216.27 | 609 | 600 | 122.8 |
| B | 15 | 85 | 58195 | 498.82 | 607 | 592 | 115.5 |
| B | 5 | 184 | 46086 | 393.96 | 607 | 592 | 115.5 |
| B | 5 | 172 | 34637 | 294.82 | 607 | 592 | 115.5 |
| C | 14 | 254 | 279303 | 2030.81 | 587 | 591 | 137.2 |
| C | 15 | 214 | 233048 | 1693.78 | 587 | 591 | 137.2 |
| C | 0 | 10 | 93912 | 679.98 | 587 | 591 | 137.2 |
| D | 2 | 16 | 1590507 | 11182.97 | 578 | 563 | 142.2 |
| D | 10 | 118 | 195048 | 1367.92 | 578 | 563 | 142.2 |
| D | 2 | 249 | 184135 | 1291.16 | 578 | 563 | 142.2 |
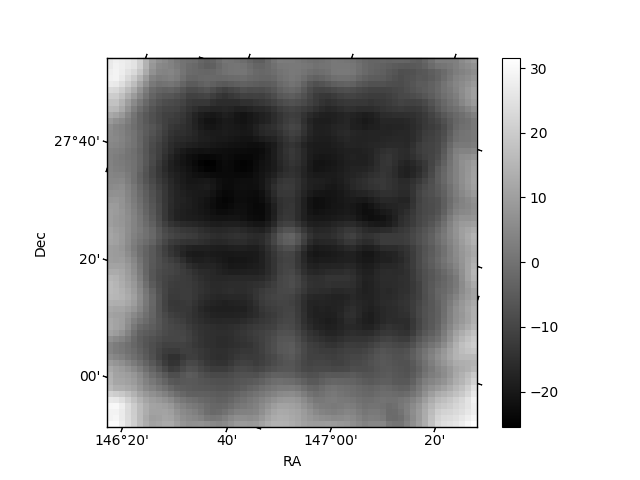
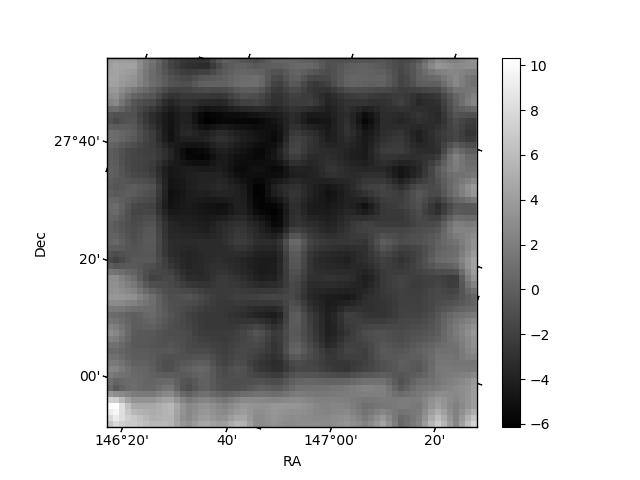
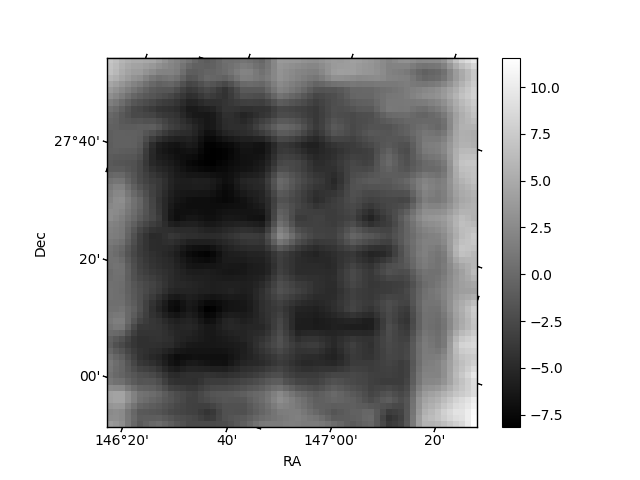
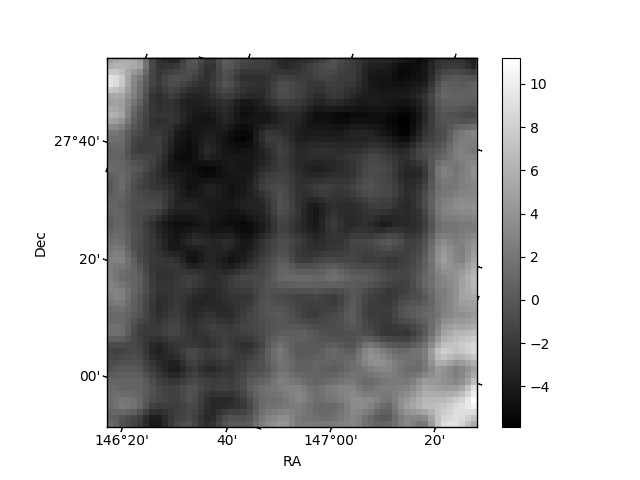
Histogram calculated using DETX and DETY for each event in the final _common_clean file
| Quadrant A | 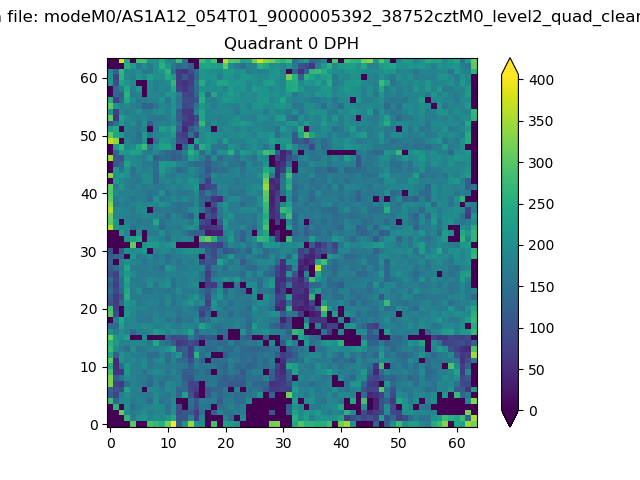 |
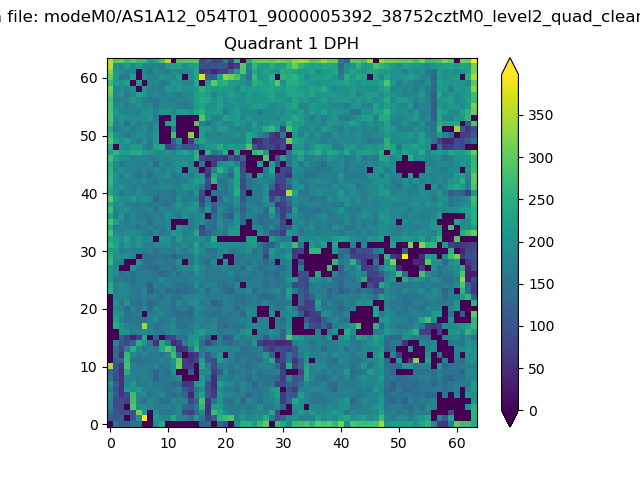 |
Quadrant B |
|---|---|---|---|
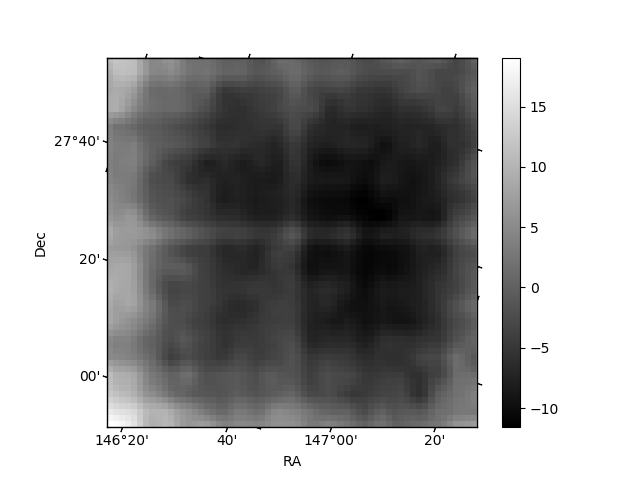
| Quadrant D | 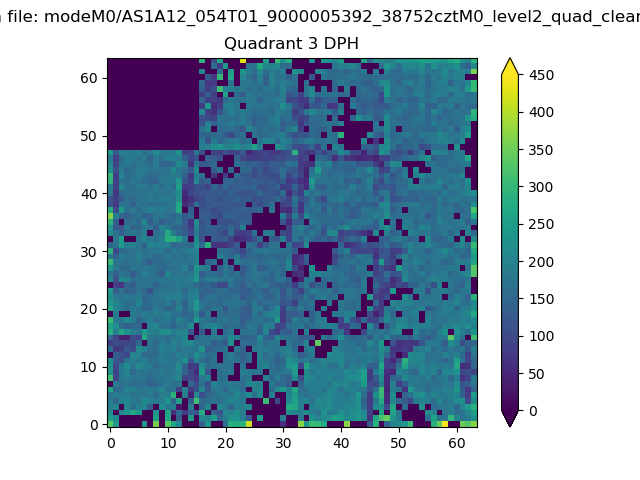 |
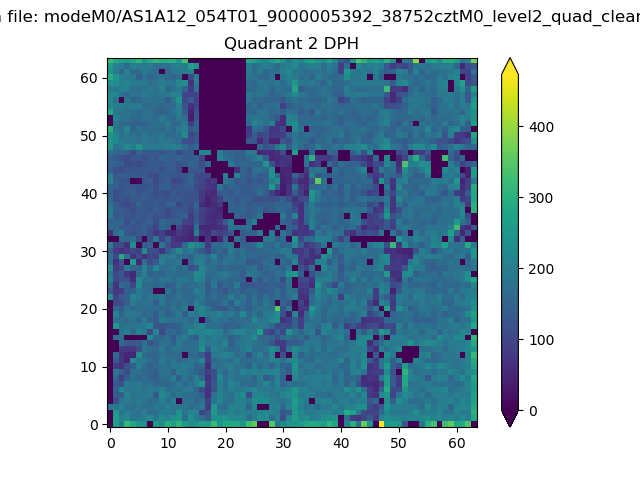 |
Quadrant C |
| Plot type | Count rate plots | Images |
|---|---|---|
| Comparison with Poisson distribution Blue bars denote a histogram of data divided into 1 sec bins. Red curve is a Poisson curve with rate = median count rate of data. |
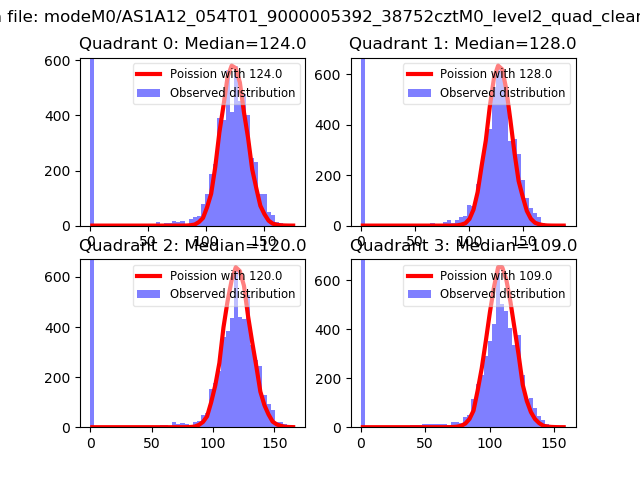 |
 |
| Quadrant-wise count rates Data is divided into 100 sec bins |
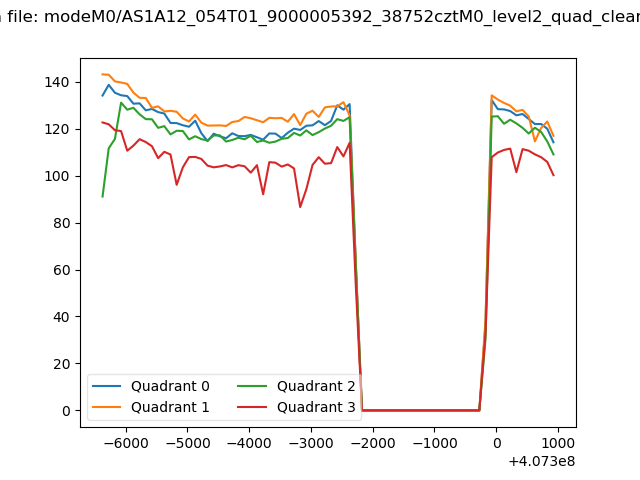 |
|
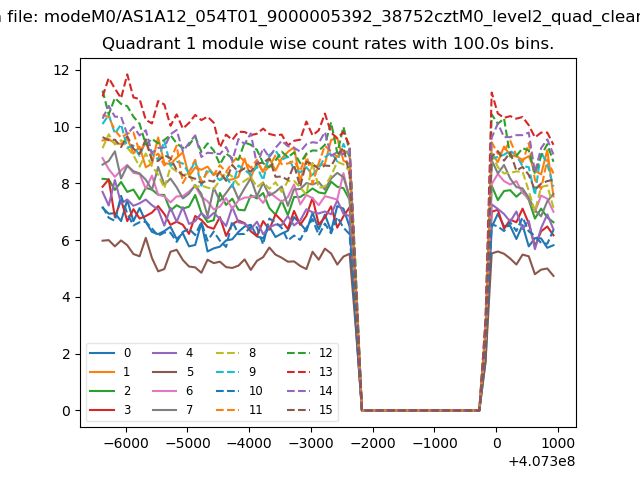
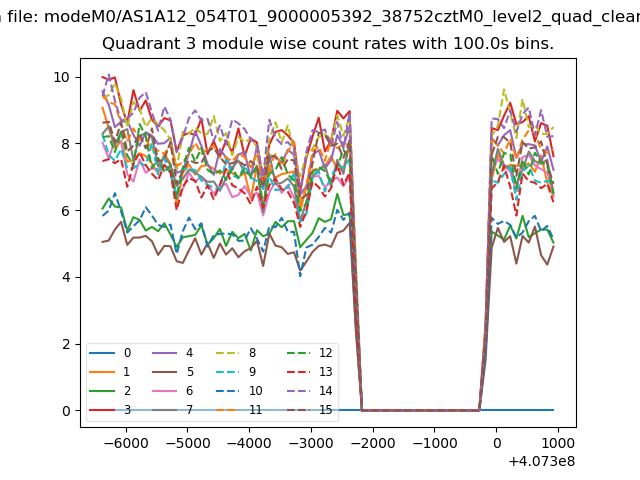
| Module-wise count rates for Quadrant A Data is divided into 100 sec bins |
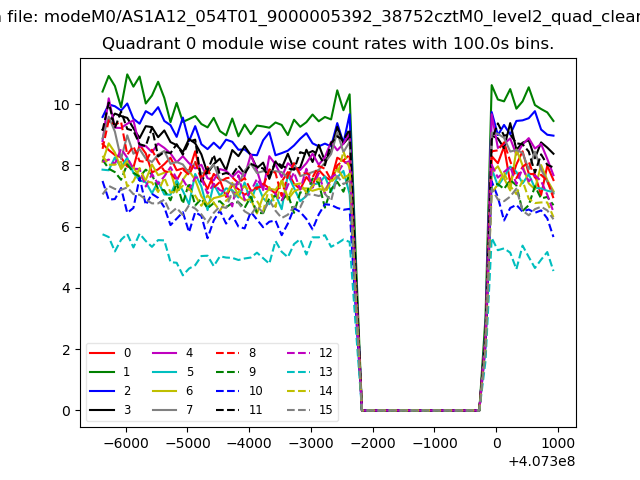 |
 |
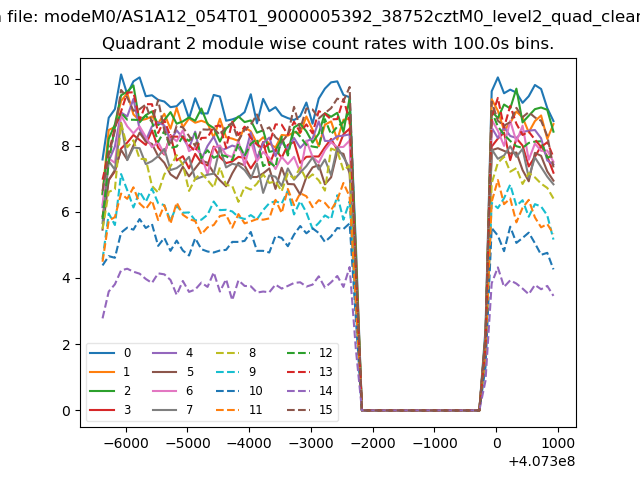
| Module-wise count rates for Quadrant B Data is divided into 100 sec bins |
 |
 |
| Module-wise count rates for Quadrant C Data is divided into 100 sec bins |
 |
 |
| Module-wise count rates for Quadrant D Data is divided into 100 sec bins |
 |
 |
| Parameter | Plot |
|---|---|
| CZT HV Monitor | 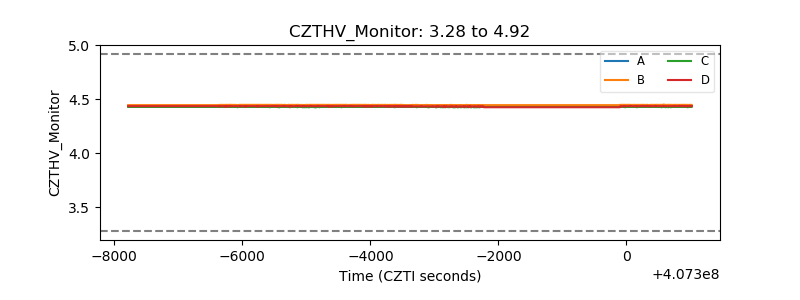 |
| D_VDD | 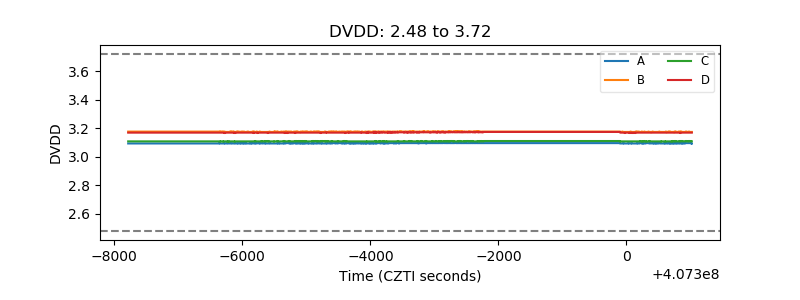 |
| Temperature 1 | 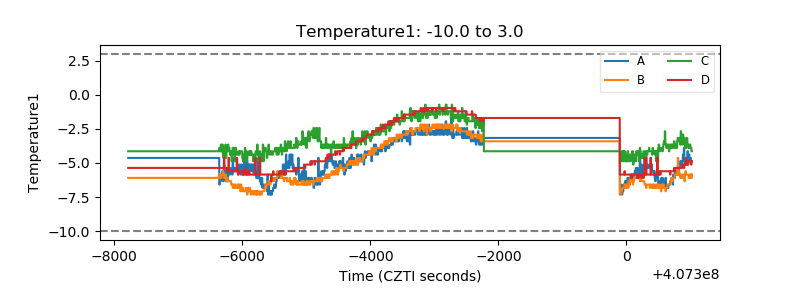 |
| Veto HV Monitor | 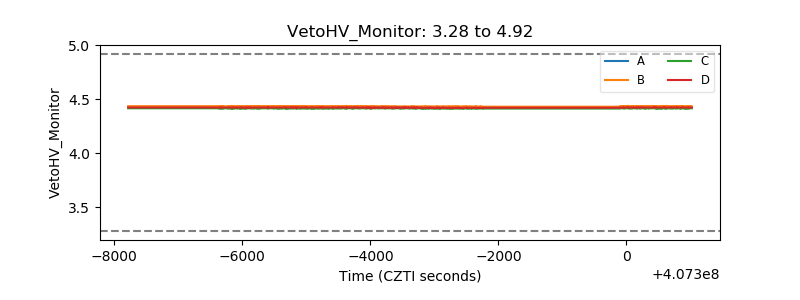 |
| Veto LLD | 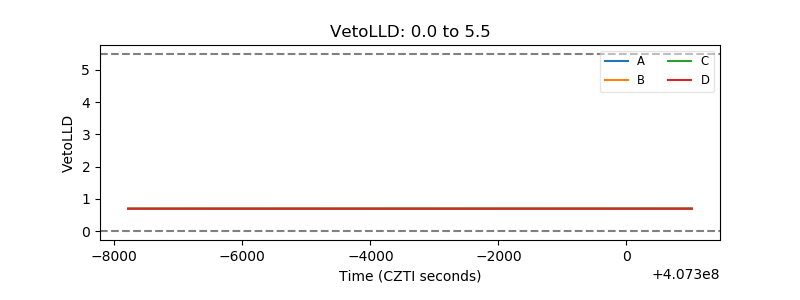 |
| Alpha Counter | 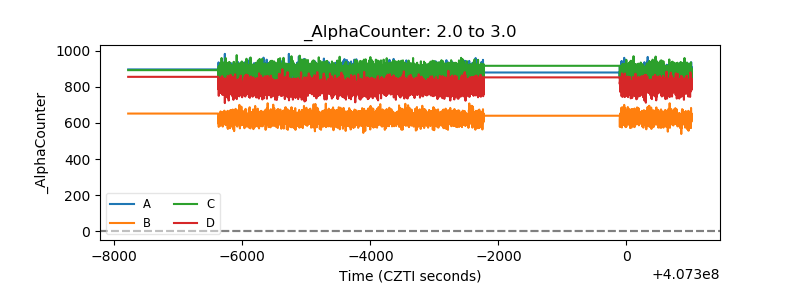 |
| _CPM_Rate | 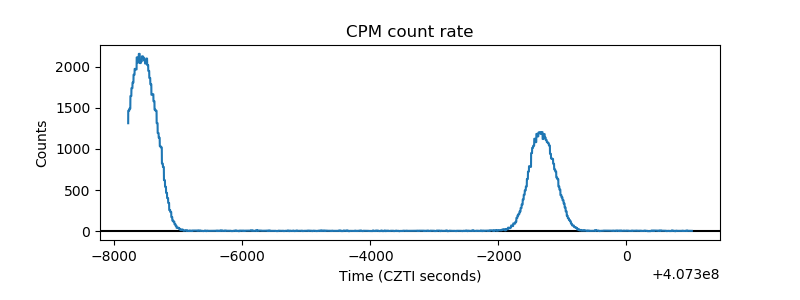 |
| CZT Counter | 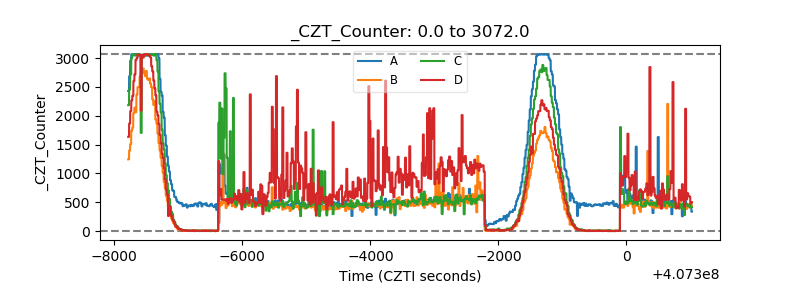 |
| +2.5 Volts monitor | 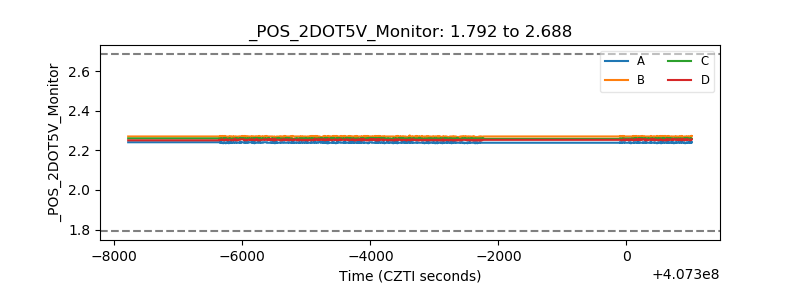 |
| +5 Volts monitor | 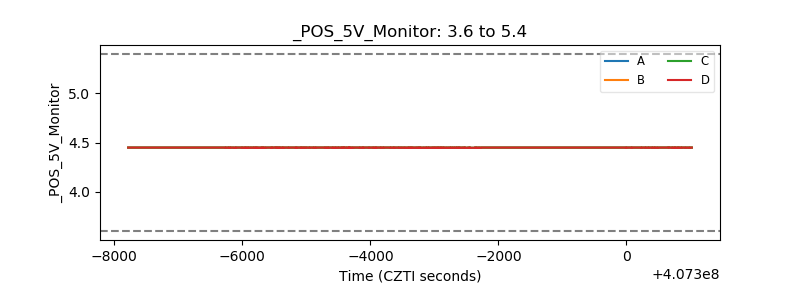 |
| _ROLL_ROT | 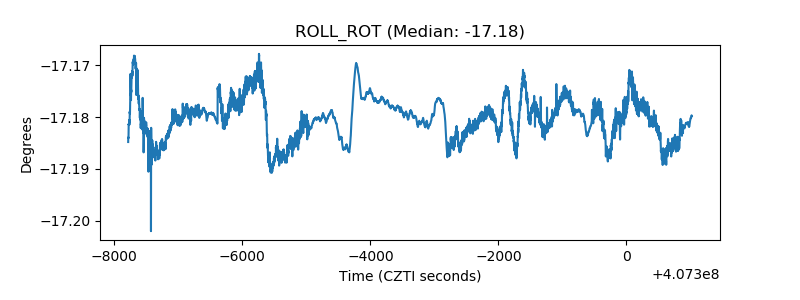 |
| _Roll_DEC | 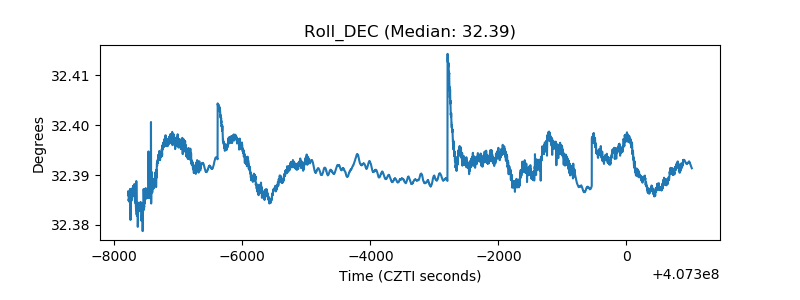 |
| _Roll_RA | 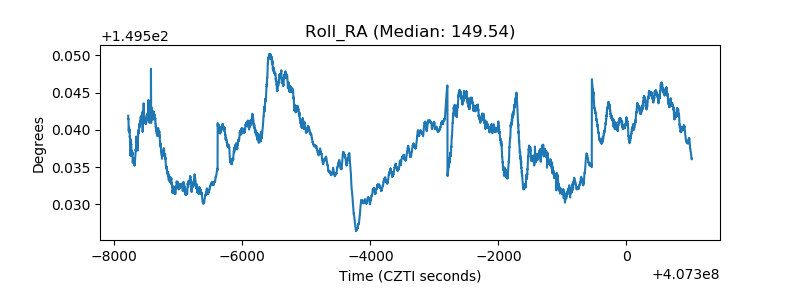 |
| Veto Counter | 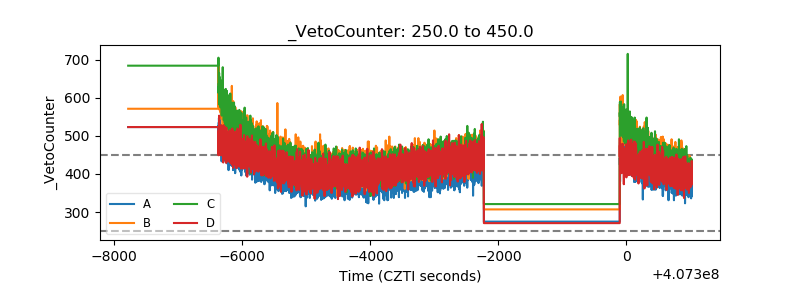 |