| Param | Original file | Final file |
|---|---|---|
| Filename | modeM0/AS1A12_054T01_9000005392_38753cztM0_level2.fits | modeM0/AS1A12_054T01_9000005392_38753cztM0_level2_quad_clean.evt |
| Size (bytes) | 337,786,560 | 90,550,080 |
| Size | 322.1 MB | 86.4 MB |
| Events in quadrant A | 2,752,424 | 619,053 |
| Events in quadrant B | 2,549,408 | 630,558 |
| Events in quadrant C | 2,543,910 | 597,398 |
| Events in quadrant D | 4,254,088 | 531,363 |
| Mode M9 | |||
|---|---|---|---|
| Quadrant | BADHDUFLAG | Total packets | Discarded packets |
| A | 0 | 24 | 0 |
| B | 0 | 24 | 0 |
| C | 0 | 24 | 0 |
| D | 0 | 25 | 0 |
| Mode SS | |||
|---|---|---|---|
| Quadrant | BADHDUFLAG | Total packets | Discarded packets |
| A | 0 | 106 | 0 |
| B | 0 | 106 | 0 |
| C | 0 | 106 | 0 |
| D | 0 | 106 | 0 |
| Mode M0 | |||
|---|---|---|---|
| Quadrant | BADHDUFLAG | Total packets | Discarded packets |
| A | 0 | 11265 | 3 |
| B | 0 | 11077 | 2 |
| C | 0 | 10731 | 2 |
| D | 0 | 16237 | 2 |
| Quadrant | Total seconds | Saturated seconds | Saturation percentage |
|---|---|---|---|
| A | 5186 | 8 | 0.154261% |
| B | 5186 | 65 | 1.253374% |
| C | 5186 | 11 | 0.212110% |
| D | 5186 | 262 | 5.052063% |
Noise dominated data is calculated using 1-second bins in cleaned event files. If a bin has >2000 counts, and if more than 50% of those come from <1% of pixels, then it is considered to be noise-dominated and hence unusable.
| Quadrant | # 1 sec bins | Bins with >0 counts | Bins with >2000 counts | High rate bins dominated by noise | Noise dominated (total time) | Noise dominated (detector-on time) | Marked lightcurve |
|---|---|---|---|---|---|---|---|
| A | 7309 | 5187 | 8 | 8 | 0.11% | 0.15% | 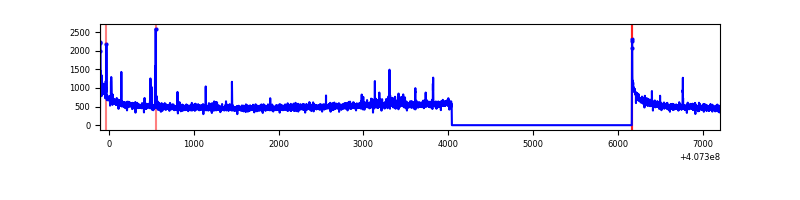 |
| B | 7309 | 5187 | 41 | 41 | 0.56% | 0.79% | 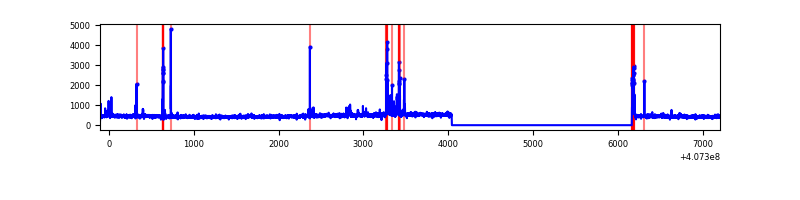 |
| C | 7309 | 5187 | 7 | 7 | 0.10% | 0.13% | 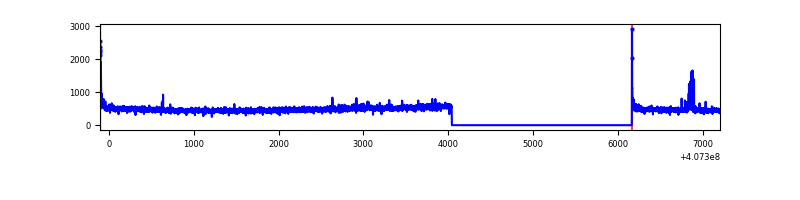 |
| D | 7309 | 5187 | 193 | 193 | 2.64% | 3.72% | 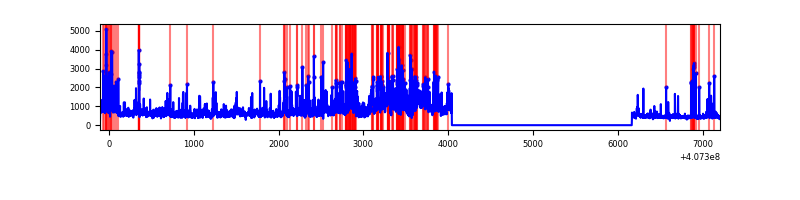 |
Top three noisy pixels from each quadrant. If the there are fewer than three noisy pixels in the level2.evt file, extra rows are filled as -1
| Pixel properties | Quadrant properties | ||||||
|---|---|---|---|---|---|---|---|
| Quadrant | DetID | PixID | Counts | Sigma | Mean | Median | Sigma |
| A | 10 | 83 | 400393 | 3345.69 | 590 | 579 | 119.5 |
| A | 13 | 248 | 34008 | 279.74 | 590 | 579 | 119.5 |
| A | 9 | 143 | 20969 | 170.63 | 590 | 579 | 119.5 |
| B | 15 | 85 | 102175 | 907.83 | 584 | 570 | 111.9 |
| B | 5 | 184 | 95068 | 844.33 | 584 | 570 | 111.9 |
| B | 0 | 230 | 22524 | 196.16 | 584 | 570 | 111.9 |
| C | 15 | 214 | 233437 | 1753.16 | 571 | 575 | 132.8 |
| C | 0 | 10 | 43227 | 321.12 | 571 | 575 | 132.8 |
| C | 15 | 208 | 25239 | 185.69 | 571 | 575 | 132.8 |
| D | 2 | 16 | 1518437 | 11022.45 | 561 | 546 | 137.7 |
| D | 5 | 222 | 184846 | 1338.33 | 561 | 546 | 137.7 |
| D | 12 | 227 | 104181 | 752.57 | 561 | 546 | 137.7 |
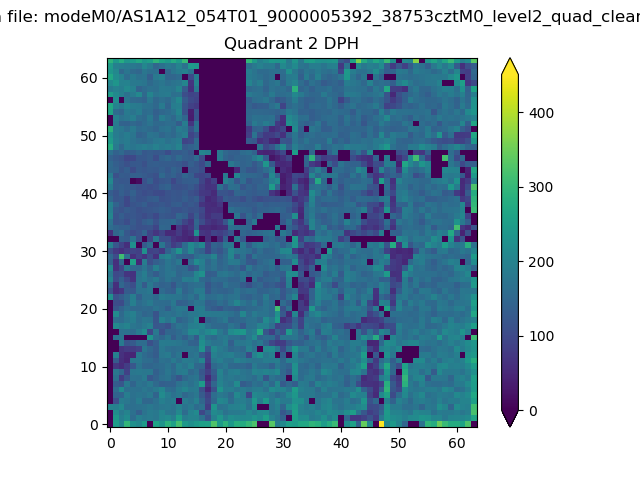
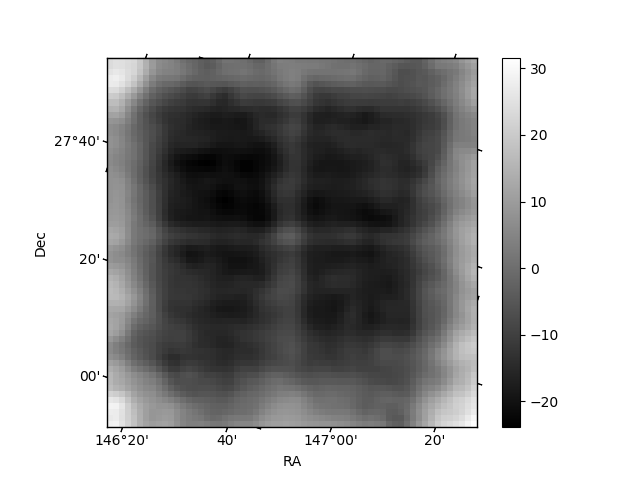
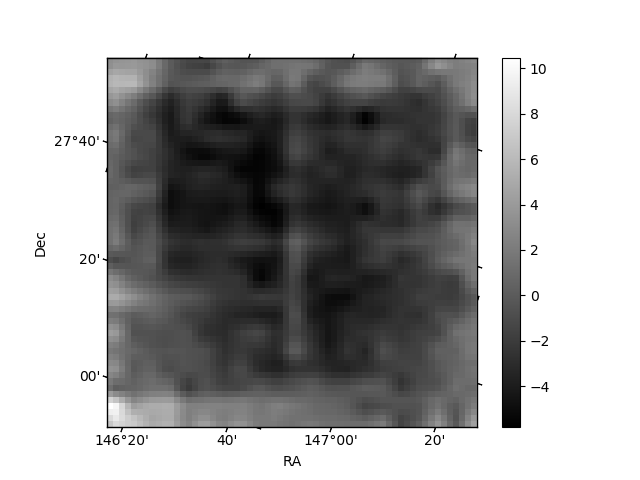
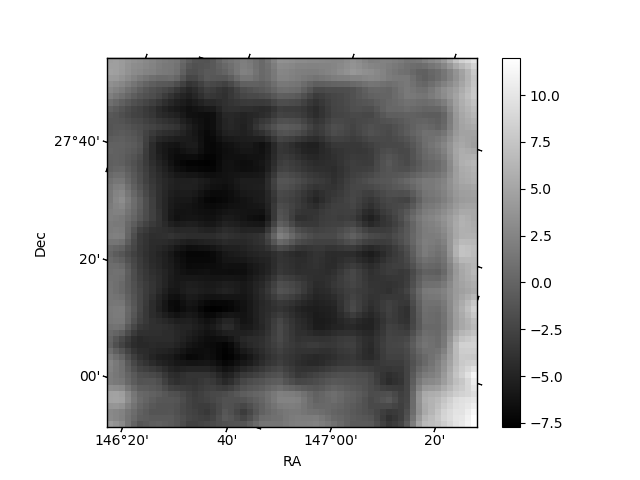
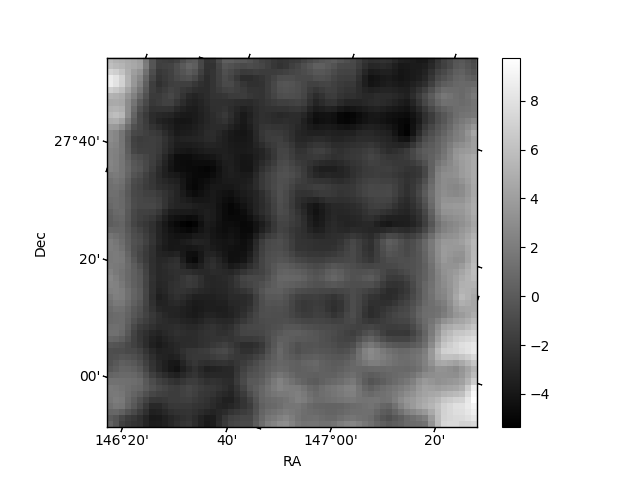
Histogram calculated using DETX and DETY for each event in the final _common_clean file
| Quadrant A | 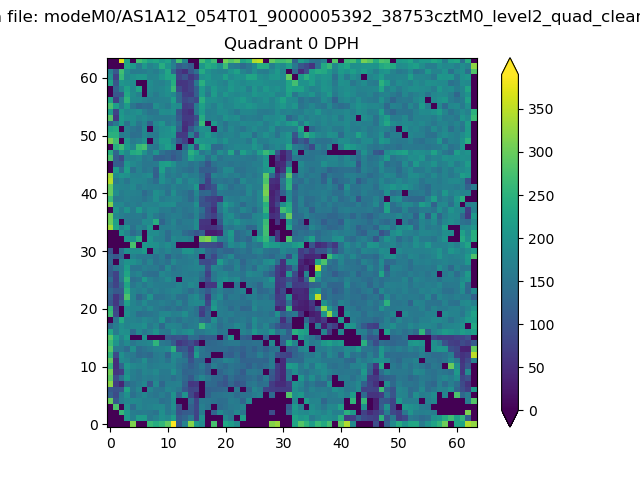 |
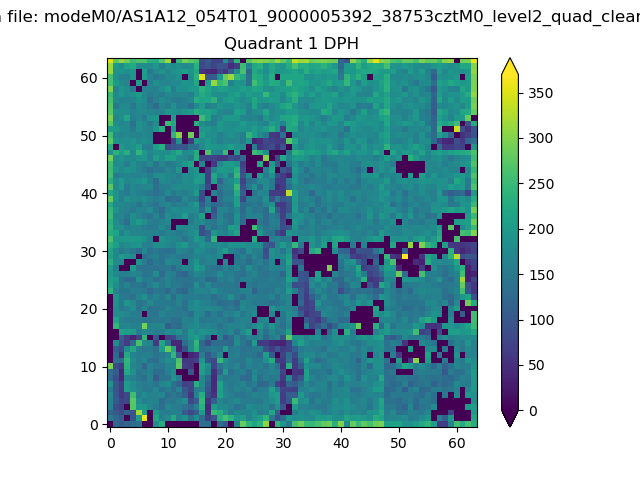 |
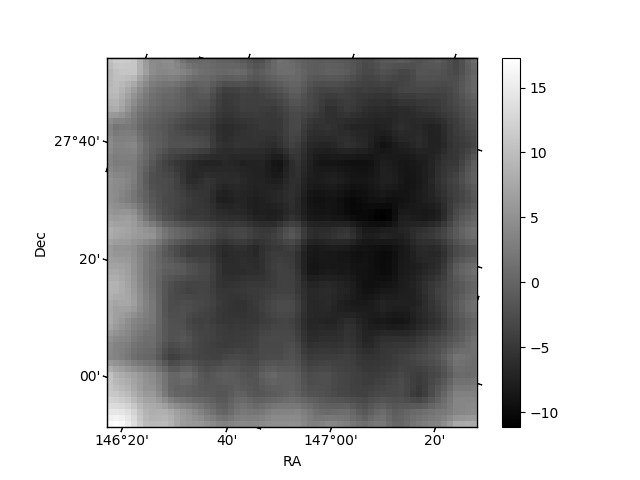
Quadrant B |
|---|---|---|---|
| Quadrant D | 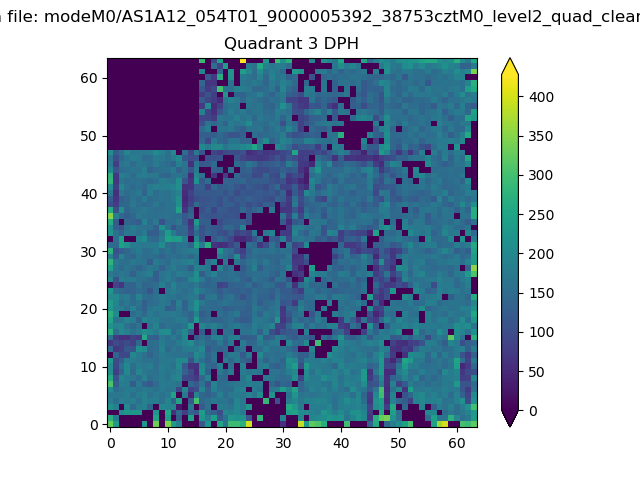 |
 |
Quadrant C |
| Plot type | Count rate plots | Images |
|---|---|---|
| Comparison with Poisson distribution Blue bars denote a histogram of data divided into 1 sec bins. Red curve is a Poisson curve with rate = median count rate of data. |
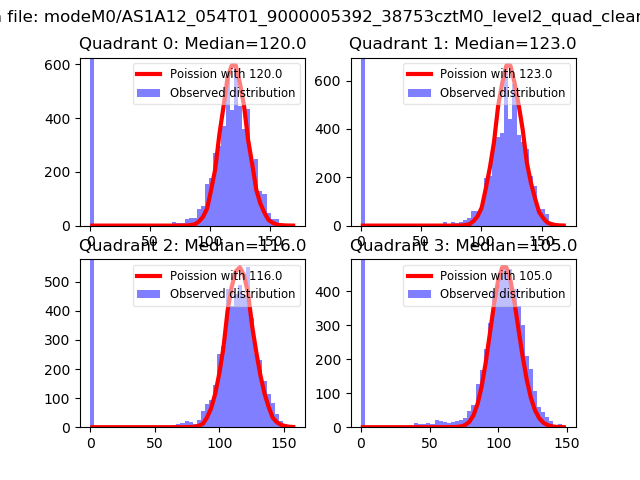 |
 |
| Quadrant-wise count rates Data is divided into 100 sec bins |
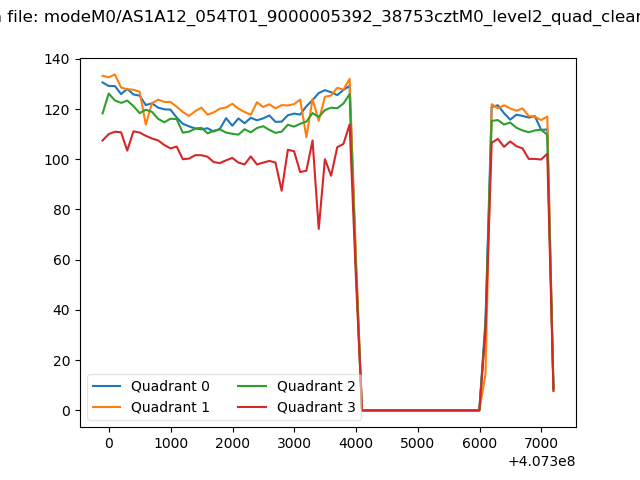 |
|
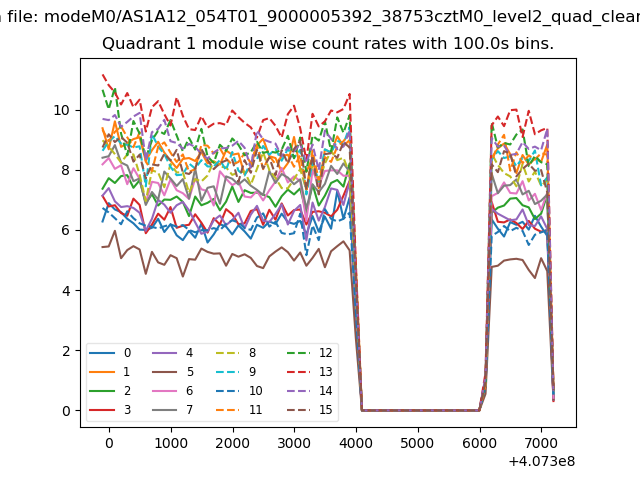
| Module-wise count rates for Quadrant A Data is divided into 100 sec bins |
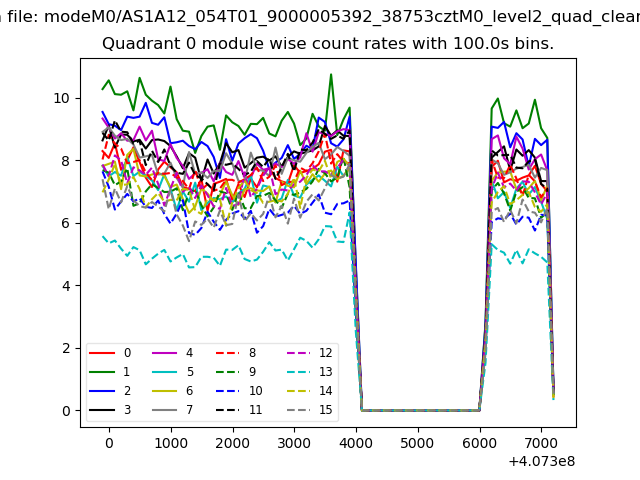 |
 |
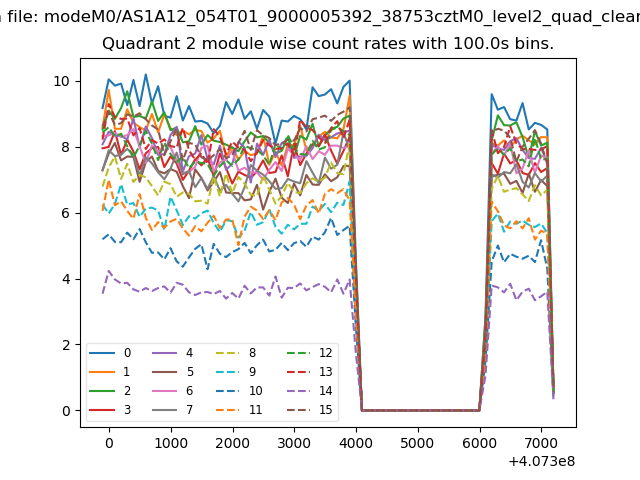
| Module-wise count rates for Quadrant B Data is divided into 100 sec bins |
 |
 |
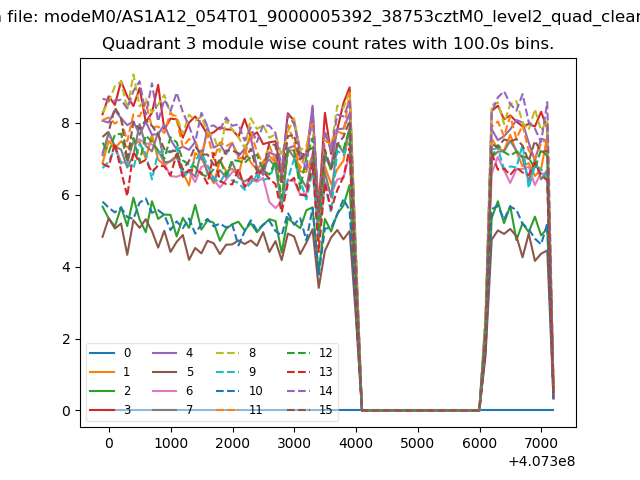
| Module-wise count rates for Quadrant C Data is divided into 100 sec bins |
 |
 |
| Module-wise count rates for Quadrant D Data is divided into 100 sec bins |
 |
 |
| Parameter | Plot |
|---|---|
| CZT HV Monitor | 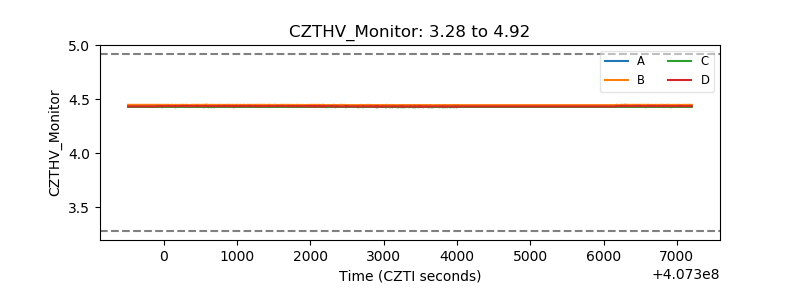 |
| D_VDD | 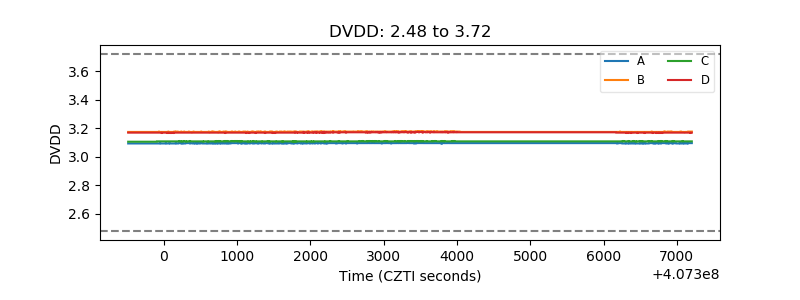 |
| Temperature 1 | 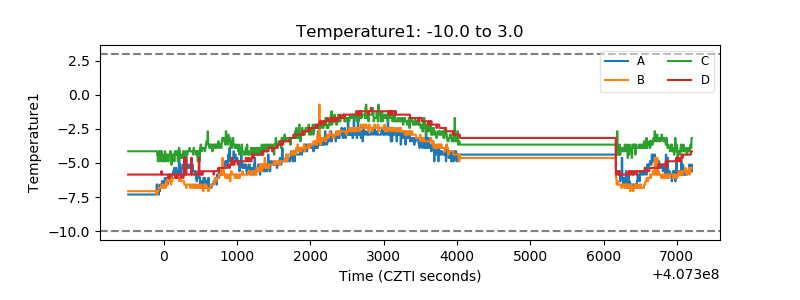 |
| Veto HV Monitor | 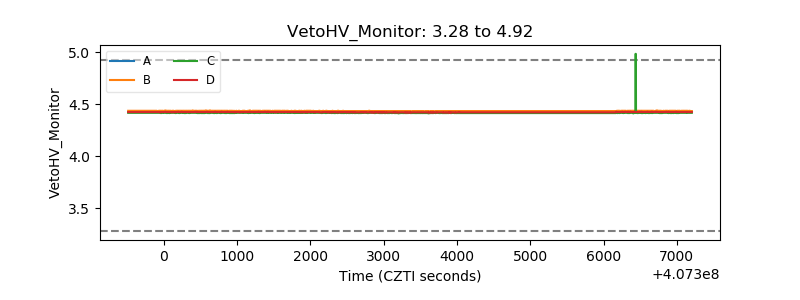 |
| Veto LLD | 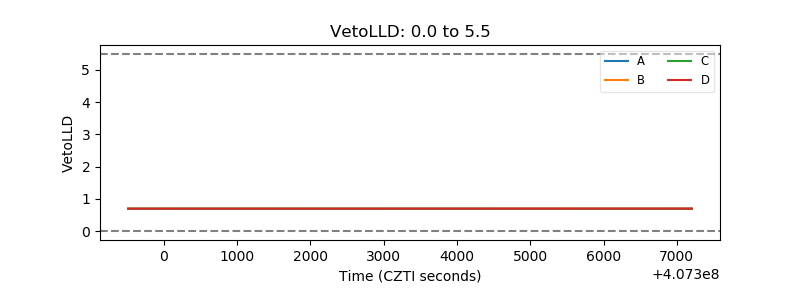 |
| Alpha Counter | 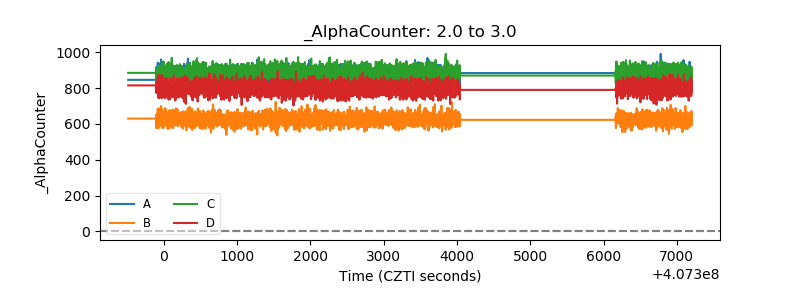 |
| _CPM_Rate | 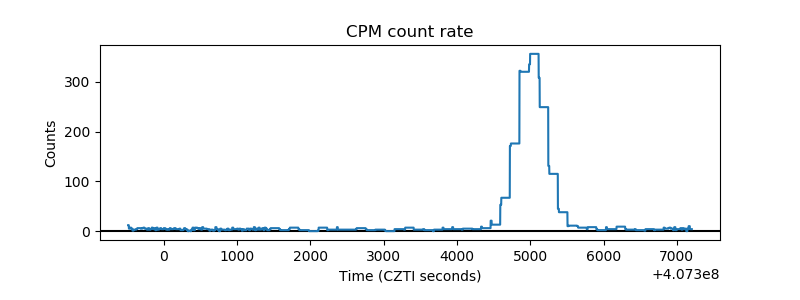 |
| CZT Counter | 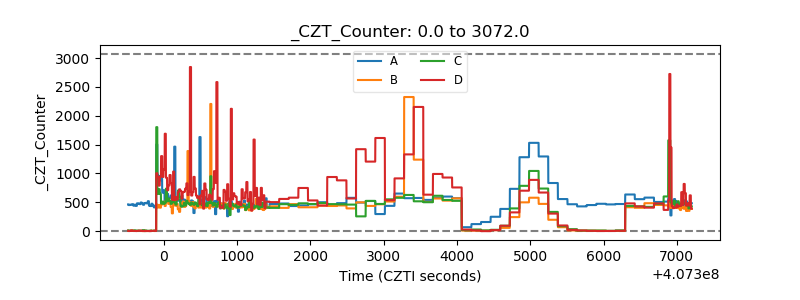 |
| +2.5 Volts monitor | 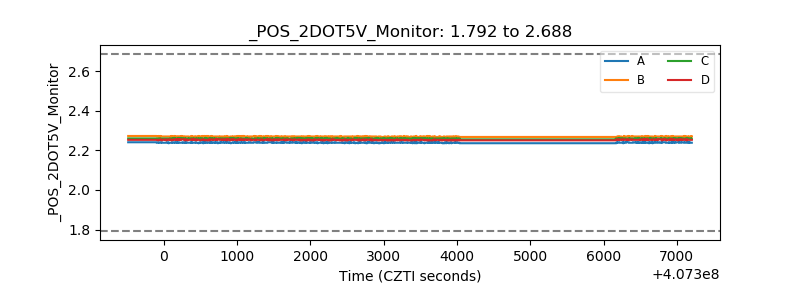 |
| +5 Volts monitor | 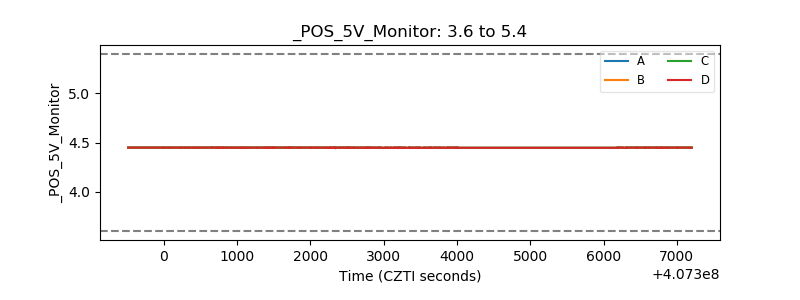 |
| _ROLL_ROT | 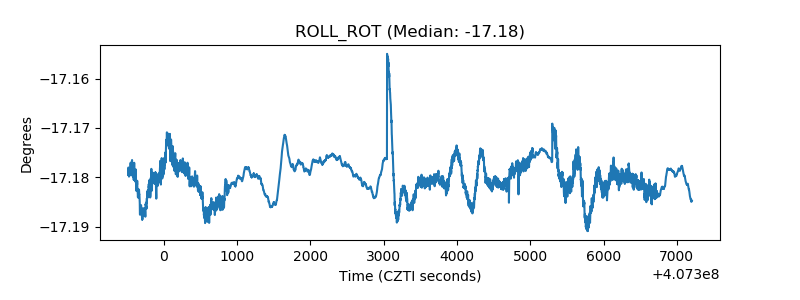 |
| _Roll_DEC | 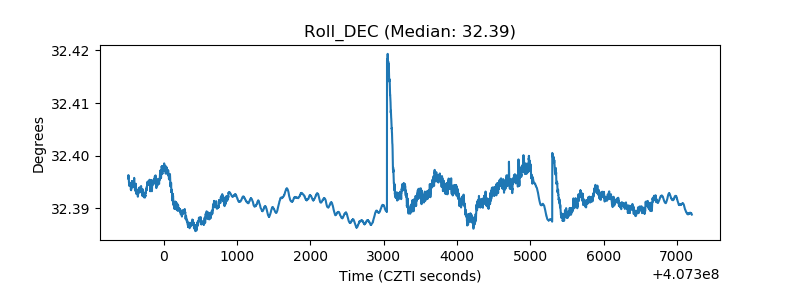 |
| _Roll_RA | 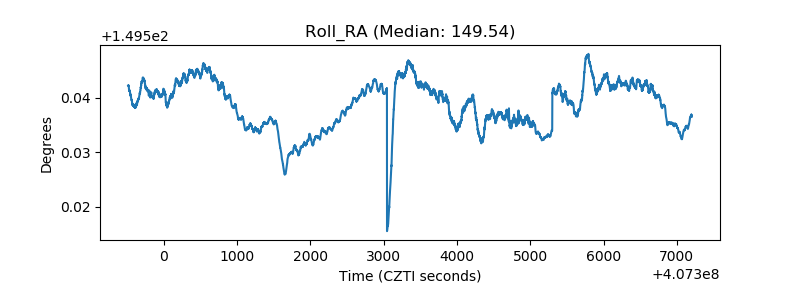 |
| Veto Counter | 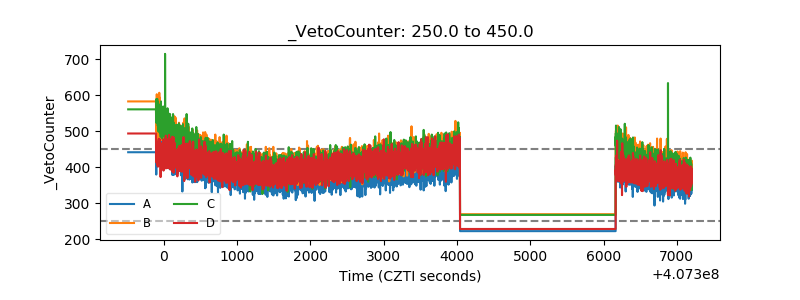 |