| Param | Original file | Final file |
|---|---|---|
| Filename | modeM0/AS1A12_054T01_9000005392_38754cztM0_level2.fits | modeM0/AS1A12_054T01_9000005392_38754cztM0_level2_quad_clean.evt |
| Size (bytes) | 316,768,320 | 87,652,800 |
| Size | 302.1 MB | 83.6 MB |
| Events in quadrant A | 2,784,407 | 590,055 |
| Events in quadrant B | 2,368,637 | 606,845 |
| Events in quadrant C | 2,615,991 | 569,631 |
| Events in quadrant D | 3,552,946 | 524,316 |
| Mode M9 | |||
|---|---|---|---|
| Quadrant | BADHDUFLAG | Total packets | Discarded packets |
| A | 0 | 23 | 0 |
| B | 0 | 23 | 0 |
| C | 0 | 23 | 0 |
| D | 0 | 24 | 0 |
| Mode SS | |||
|---|---|---|---|
| Quadrant | BADHDUFLAG | Total packets | Discarded packets |
| A | 0 | 106 | 0 |
| B | 0 | 106 | 0 |
| C | 0 | 106 | 0 |
| D | 0 | 106 | 0 |
| Mode M0 | |||
|---|---|---|---|
| Quadrant | BADHDUFLAG | Total packets | Discarded packets |
| A | 0 | 11329 | 3 |
| B | 0 | 10591 | 2 |
| C | 0 | 10923 | 2 |
| D | 0 | 14190 | 2 |
| Quadrant | Total seconds | Saturated seconds | Saturation percentage |
|---|---|---|---|
| A | 5183 | 37 | 0.713872% |
| B | 5183 | 25 | 0.482346% |
| C | 5183 | 20 | 0.385877% |
| D | 5183 | 106 | 2.045148% |
Noise dominated data is calculated using 1-second bins in cleaned event files. If a bin has >2000 counts, and if more than 50% of those come from <1% of pixels, then it is considered to be noise-dominated and hence unusable.
| Quadrant | # 1 sec bins | Bins with >0 counts | Bins with >2000 counts | High rate bins dominated by noise | Noise dominated (total time) | Noise dominated (detector-on time) | Marked lightcurve |
|---|---|---|---|---|---|---|---|
| A | 7187 | 5184 | 27 | 27 | 0.38% | 0.52% | 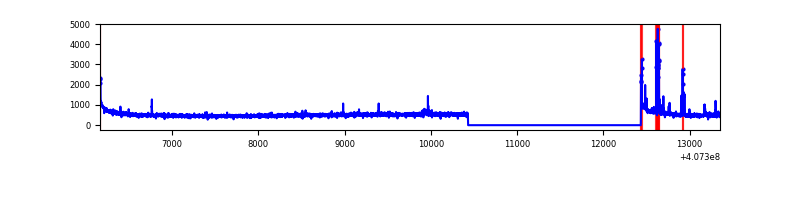 |
| B | 7187 | 5184 | 16 | 16 | 0.22% | 0.31% | 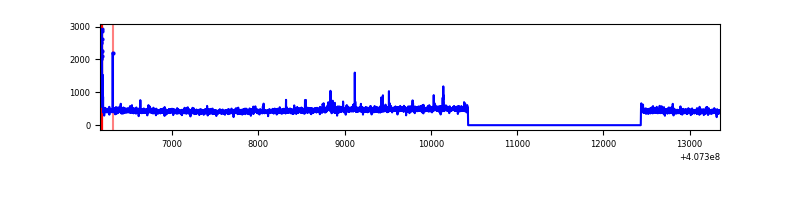 |
| C | 7187 | 5184 | 25 | 25 | 0.35% | 0.48% | 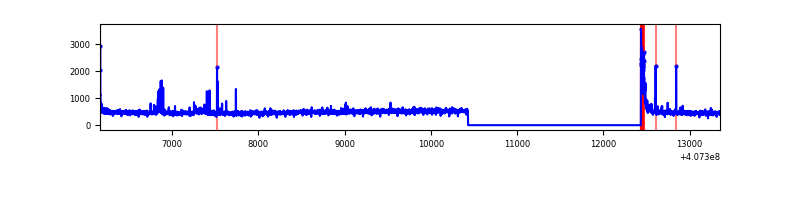 |
| D | 7187 | 5184 | 88 | 88 | 1.22% | 1.70% | 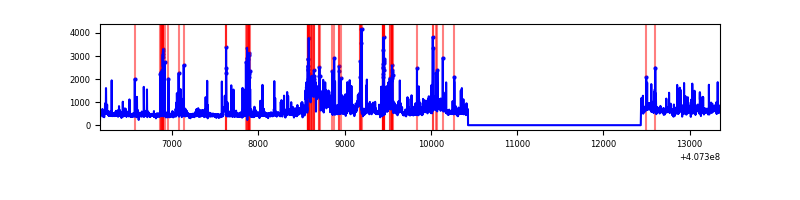 |
Top three noisy pixels from each quadrant. If the there are fewer than three noisy pixels in the level2.evt file, extra rows are filled as -1
| Pixel properties | Quadrant properties | ||||||
|---|---|---|---|---|---|---|---|
| Quadrant | DetID | PixID | Counts | Sigma | Mean | Median | Sigma |
| A | 10 | 83 | 397992 | 3375.77 | 581 | 571 | 117.7 |
| A | 9 | 143 | 94857 | 800.88 | 581 | 571 | 117.7 |
| A | 13 | 248 | 16838 | 138.17 | 581 | 571 | 117.7 |
| B | 5 | 184 | 52631 | 466.82 | 576 | 563 | 111.5 |
| B | 4 | 171 | 16836 | 145.9 | 576 | 563 | 111.5 |
| B | 12 | 111 | 13988 | 120.36 | 576 | 563 | 111.5 |
| C | 15 | 214 | 232238 | 1759.87 | 563 | 566 | 131.6 |
| C | 0 | 10 | 98714 | 745.57 | 563 | 566 | 131.6 |
| C | 14 | 254 | 53635 | 403.13 | 563 | 566 | 131.6 |
| D | 2 | 16 | 1030543 | 7443.55 | 561 | 547 | 138.4 |
| D | 12 | 227 | 167854 | 1209.09 | 561 | 547 | 138.4 |
| D | 10 | 118 | 81334 | 583.83 | 561 | 547 | 138.4 |
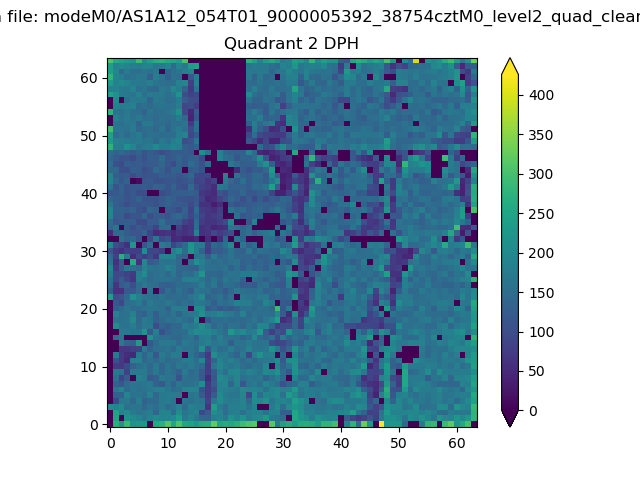
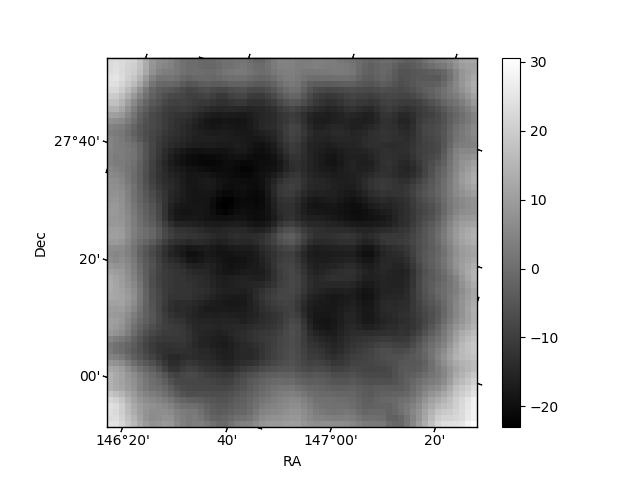
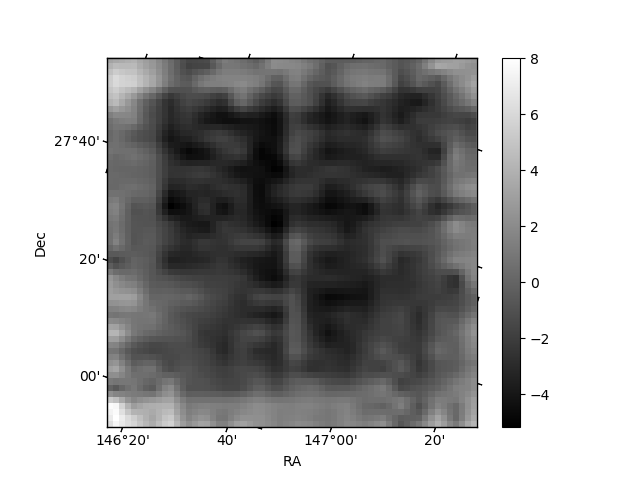
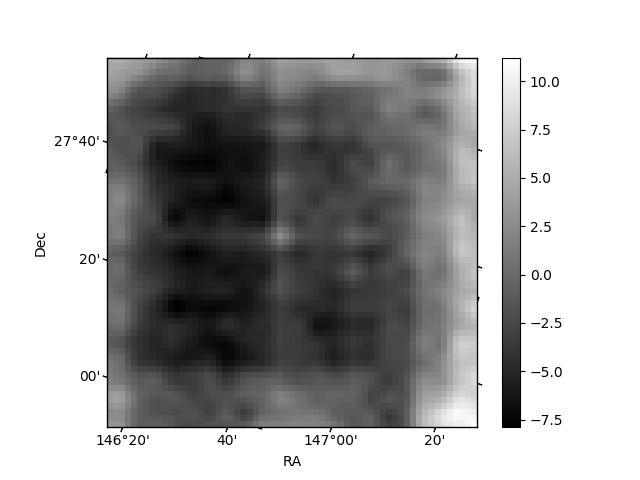
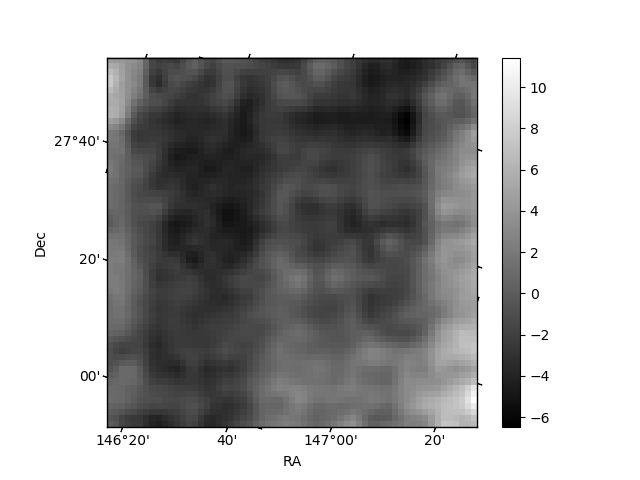
Histogram calculated using DETX and DETY for each event in the final _common_clean file
| Quadrant A | 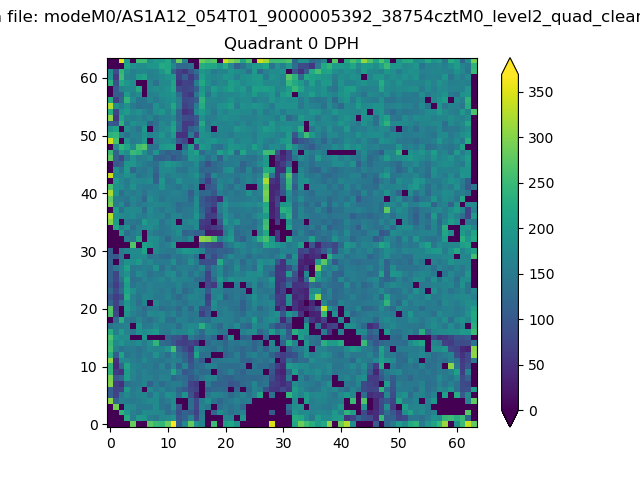 |
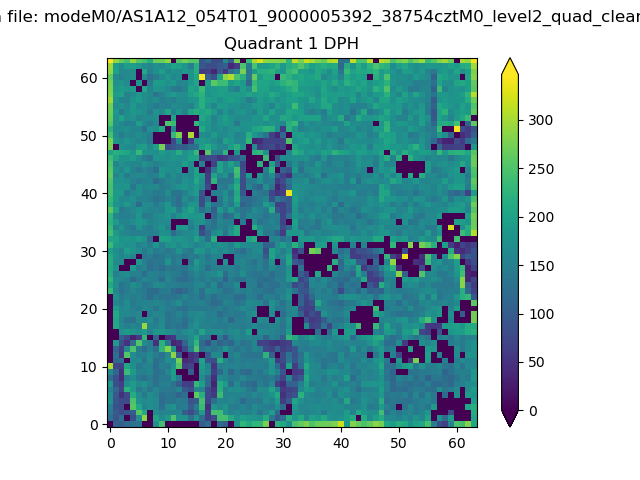 |
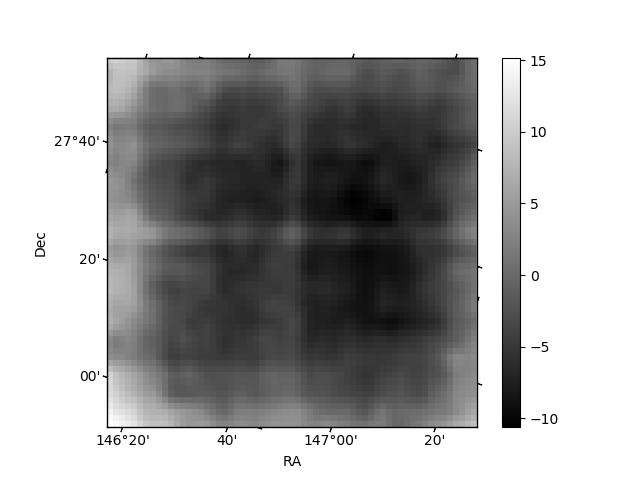
Quadrant B |
|---|---|---|---|
| Quadrant D | 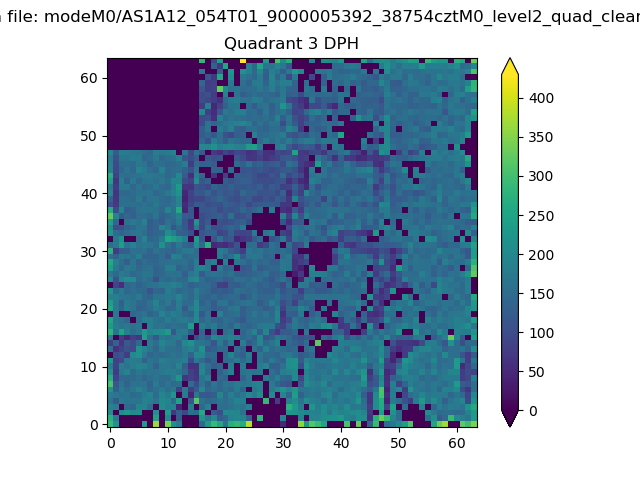 |
 |
Quadrant C |
| Plot type | Count rate plots | Images |
|---|---|---|
| Comparison with Poisson distribution Blue bars denote a histogram of data divided into 1 sec bins. Red curve is a Poisson curve with rate = median count rate of data. |
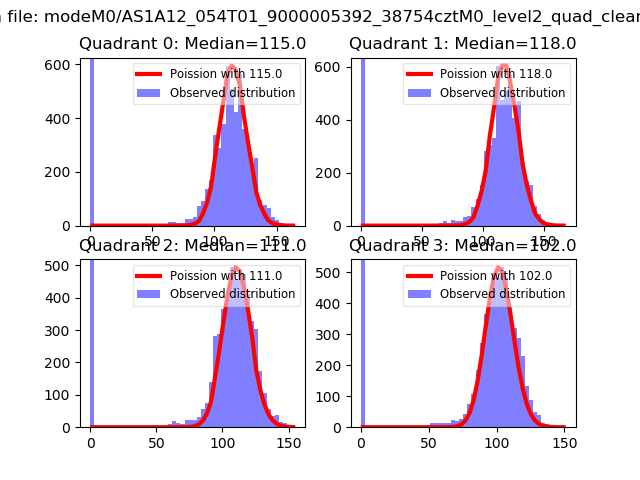 |
 |
| Quadrant-wise count rates Data is divided into 100 sec bins |
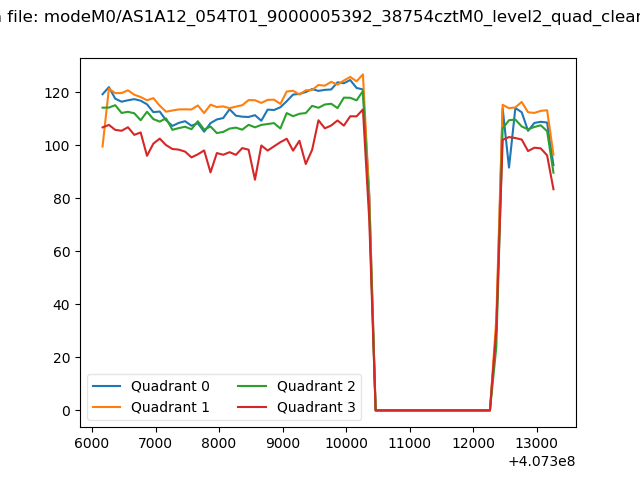 |
|
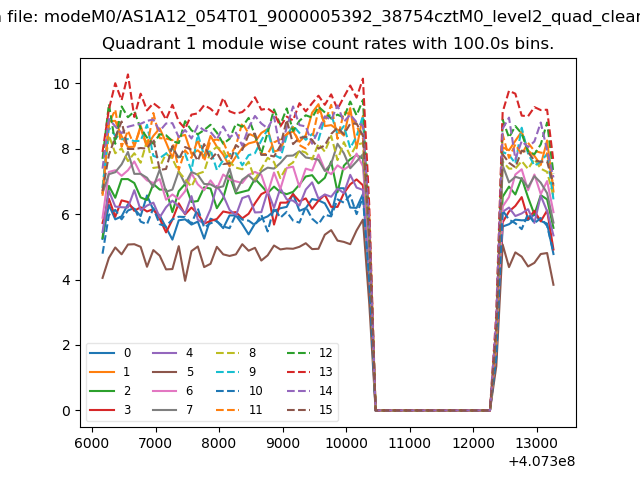
| Module-wise count rates for Quadrant A Data is divided into 100 sec bins |
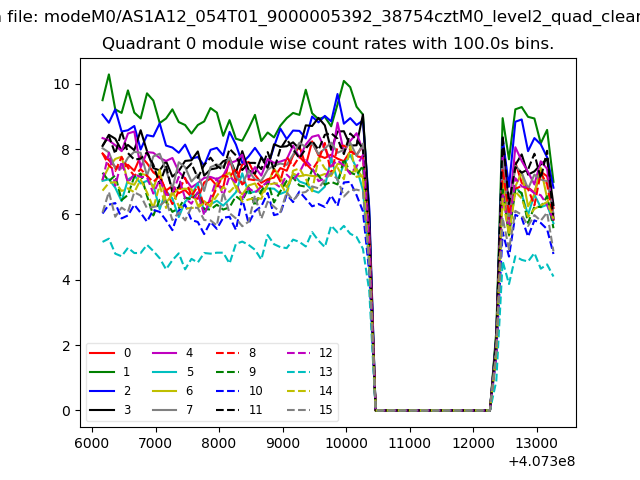 |
 |
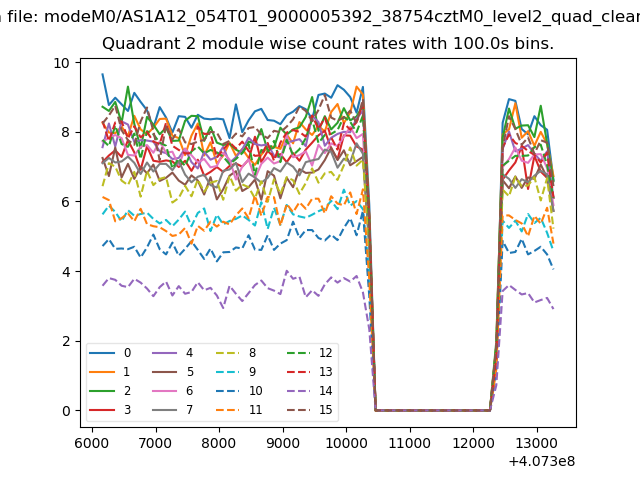
| Module-wise count rates for Quadrant B Data is divided into 100 sec bins |
 |
 |
| Module-wise count rates for Quadrant C Data is divided into 100 sec bins |
 |
 |
| Module-wise count rates for Quadrant D Data is divided into 100 sec bins |
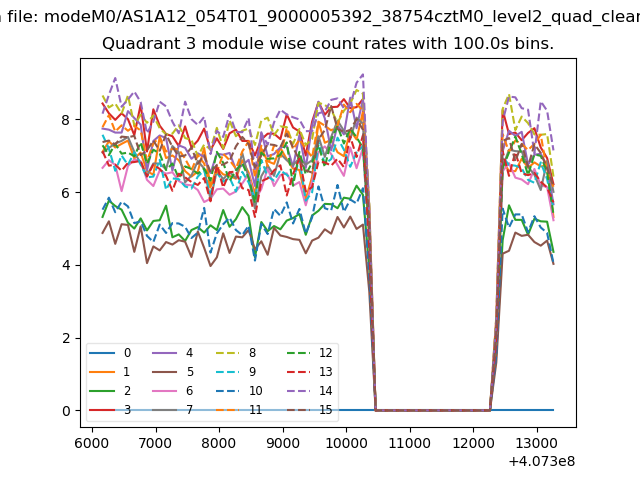 |
 |
| Parameter | Plot |
|---|---|
| CZT HV Monitor | 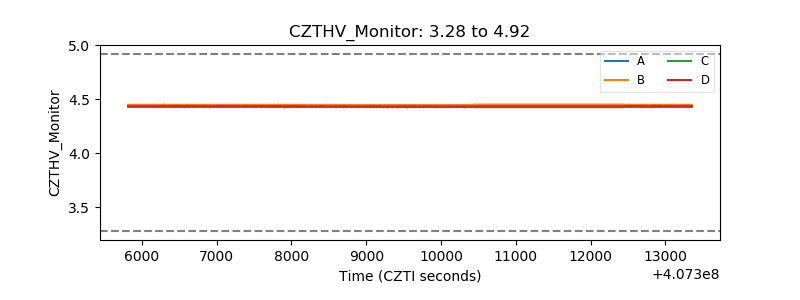 |
| D_VDD | 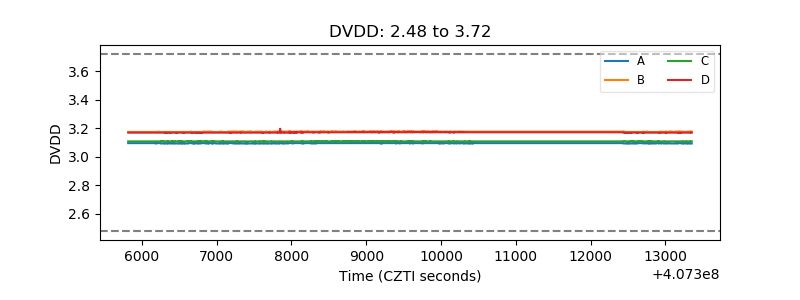 |
| Temperature 1 | 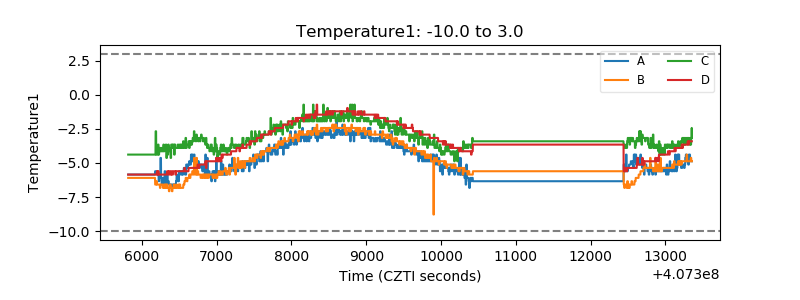 |
| Veto HV Monitor | 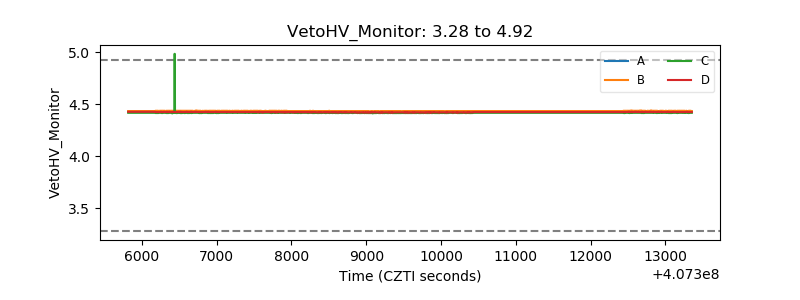 |
| Veto LLD | 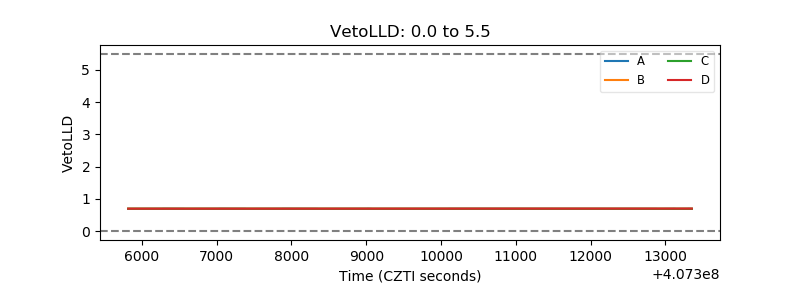 |
| Alpha Counter | 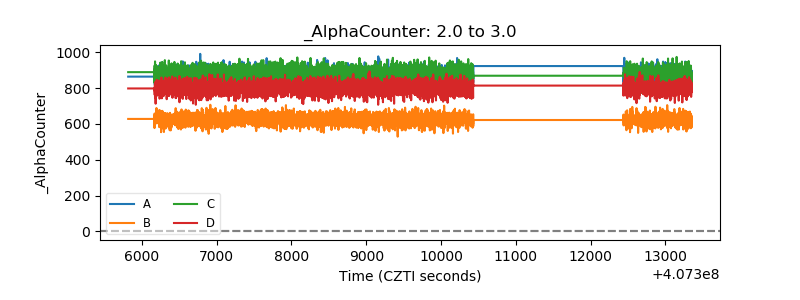 |
| _CPM_Rate | 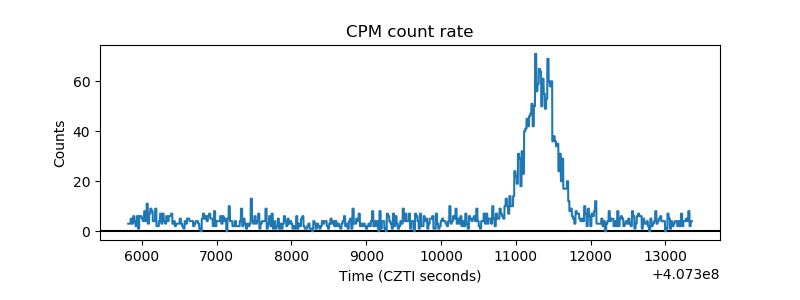 |
| CZT Counter | 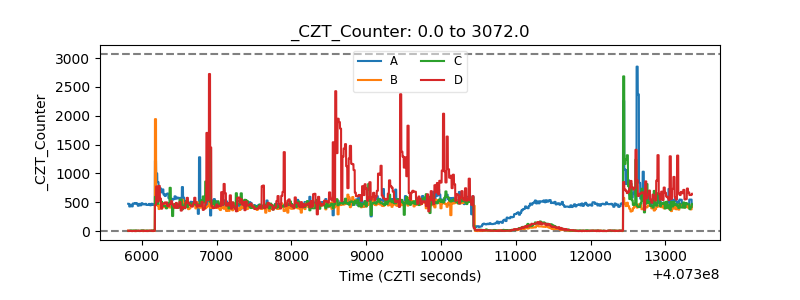 |
| +2.5 Volts monitor | 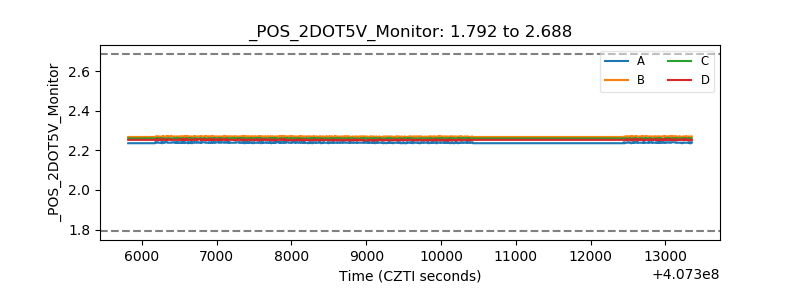 |
| +5 Volts monitor | 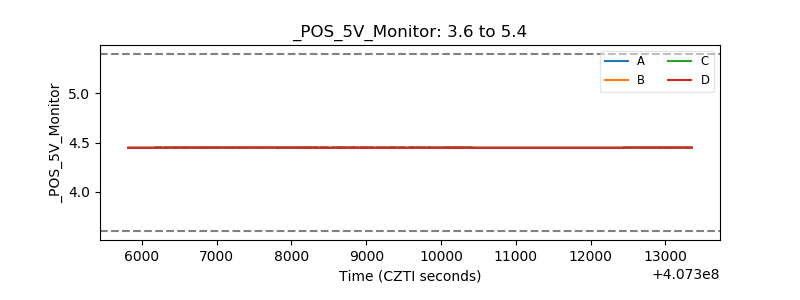 |
| _ROLL_ROT | 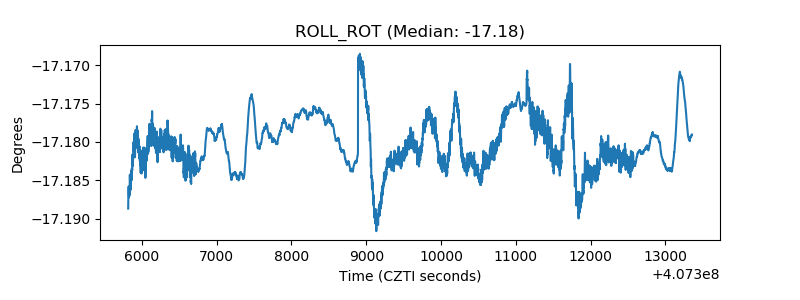 |
| _Roll_DEC | 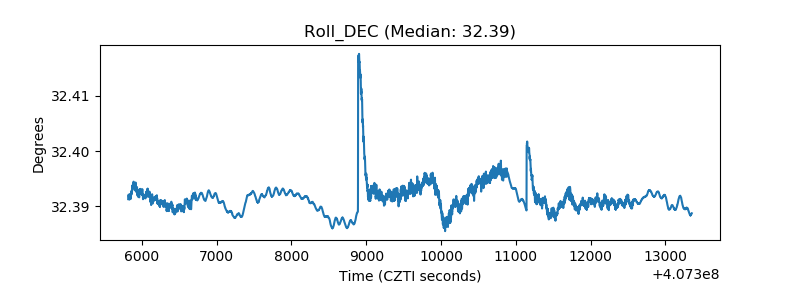 |
| _Roll_RA | 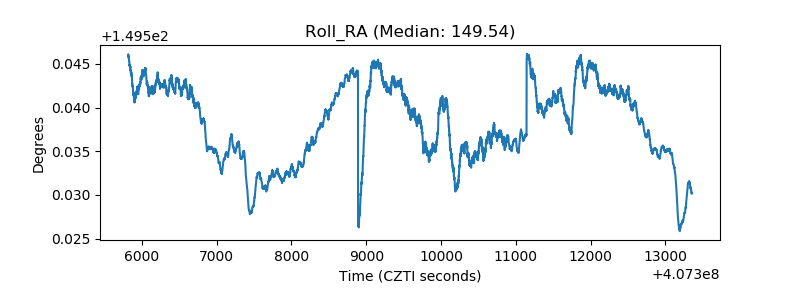 |
| Veto Counter | 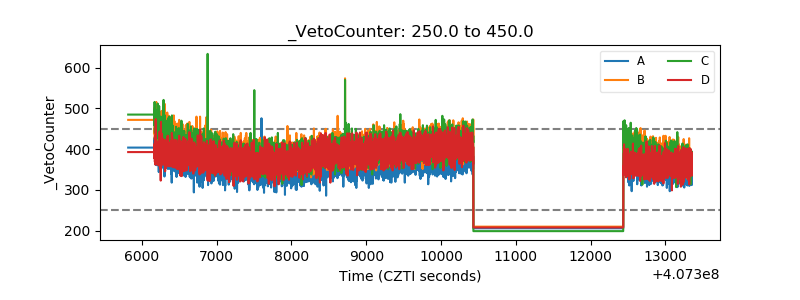 |