| Param | Original file | Final file |
|---|---|---|
| Filename | modeM0/AS1A12_054T01_9000005392_38755cztM0_level2.fits | modeM0/AS1A12_054T01_9000005392_38755cztM0_level2_quad_clean.evt |
| Size (bytes) | 346,141,440 | 89,648,640 |
| Size | 330.1 MB | 85.5 MB |
| Events in quadrant A | 2,912,578 | 602,120 |
| Events in quadrant B | 2,471,852 | 618,032 |
| Events in quadrant C | 2,768,484 | 582,198 |
| Events in quadrant D | 4,241,624 | 535,527 |
| Mode M9 | |||
|---|---|---|---|
| Quadrant | BADHDUFLAG | Total packets | Discarded packets |
| A | 0 | 16 | 0 |
| B | 0 | 16 | 0 |
| C | 0 | 16 | 0 |
| D | 0 | 17 | 0 |
| Mode SS | |||
|---|---|---|---|
| Quadrant | BADHDUFLAG | Total packets | Discarded packets |
| A | 0 | 110 | 0 |
| B | 0 | 110 | 0 |
| C | 0 | 110 | 0 |
| D | 0 | 110 | 0 |
| Mode M0 | |||
|---|---|---|---|
| Quadrant | BADHDUFLAG | Total packets | Discarded packets |
| A | 0 | 11771 | 3 |
| B | 0 | 10984 | 2 |
| C | 0 | 11511 | 2 |
| D | 0 | 16483 | 2 |
| Quadrant | Total seconds | Saturated seconds | Saturation percentage |
|---|---|---|---|
| A | 5377 | 41 | 0.762507% |
| B | 5377 | 15 | 0.278966% |
| C | 5377 | 43 | 0.799702% |
| D | 5377 | 101 | 1.878371% |
Noise dominated data is calculated using 1-second bins in cleaned event files. If a bin has >2000 counts, and if more than 50% of those come from <1% of pixels, then it is considered to be noise-dominated and hence unusable.
| Quadrant | # 1 sec bins | Bins with >0 counts | Bins with >2000 counts | High rate bins dominated by noise | Noise dominated (total time) | Noise dominated (detector-on time) | Marked lightcurve |
|---|---|---|---|---|---|---|---|
| A | 7051 | 5378 | 29 | 29 | 0.41% | 0.54% | 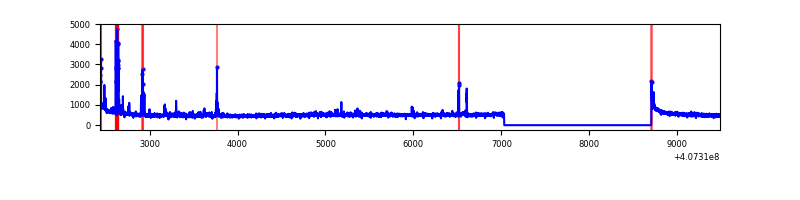 |
| B | 7051 | 5378 | 7 | 7 | 0.10% | 0.13% | 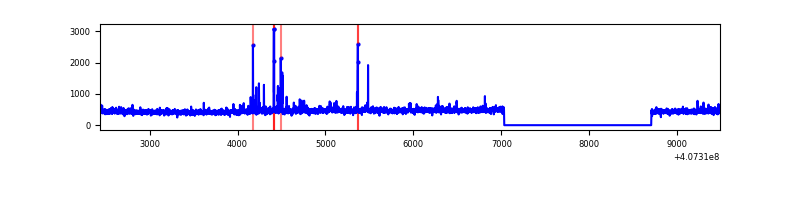 |
| C | 7051 | 5378 | 50 | 50 | 0.71% | 0.93% | 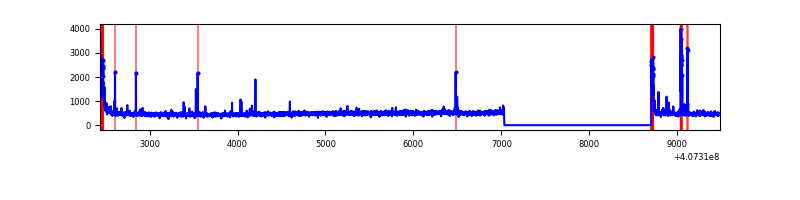 |
| D | 7051 | 5378 | 105 | 105 | 1.49% | 1.95% | 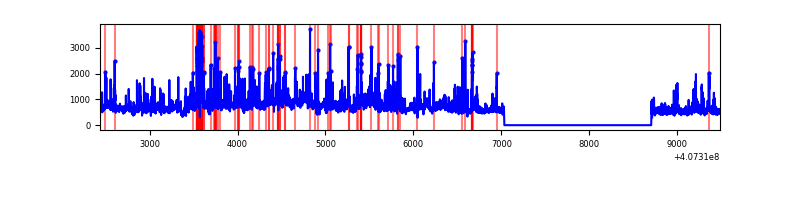 |
Top three noisy pixels from each quadrant. If the there are fewer than three noisy pixels in the level2.evt file, extra rows are filled as -1
| Pixel properties | Quadrant properties | ||||||
|---|---|---|---|---|---|---|---|
| Quadrant | DetID | PixID | Counts | Sigma | Mean | Median | Sigma |
| A | 10 | 83 | 408090 | 3328.25 | 601 | 590 | 122.4 |
| A | 9 | 143 | 116605 | 947.55 | 601 | 590 | 122.4 |
| A | 13 | 248 | 33818 | 271.39 | 601 | 590 | 122.4 |
| B | 4 | 171 | 46915 | 399.71 | 597 | 582 | 115.9 |
| B | 15 | 85 | 39932 | 339.47 | 597 | 582 | 115.9 |
| B | 0 | 221 | 18802 | 157.18 | 597 | 582 | 115.9 |
| C | 15 | 214 | 240622 | 1754.43 | 583 | 587 | 136.8 |
| C | 0 | 10 | 130421 | 948.96 | 583 | 587 | 136.8 |
| C | 14 | 254 | 116663 | 848.4 | 583 | 587 | 136.8 |
| D | 2 | 16 | 1509052 | 10418.51 | 582 | 564 | 144.8 |
| D | 10 | 118 | 199101 | 1371.21 | 582 | 564 | 144.8 |
| D | 12 | 233 | 95808 | 657.81 | 582 | 564 | 144.8 |
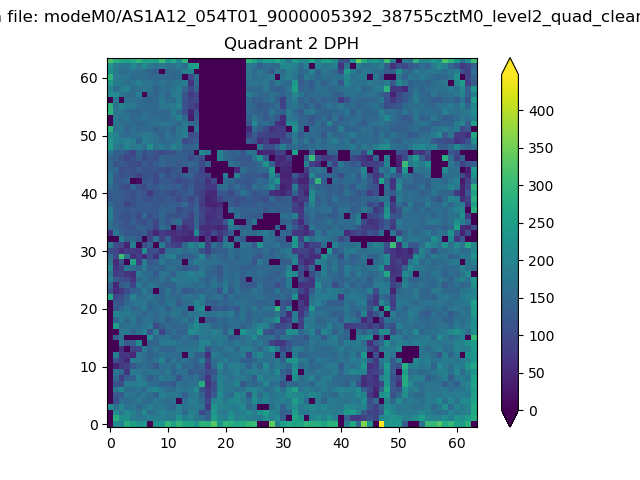
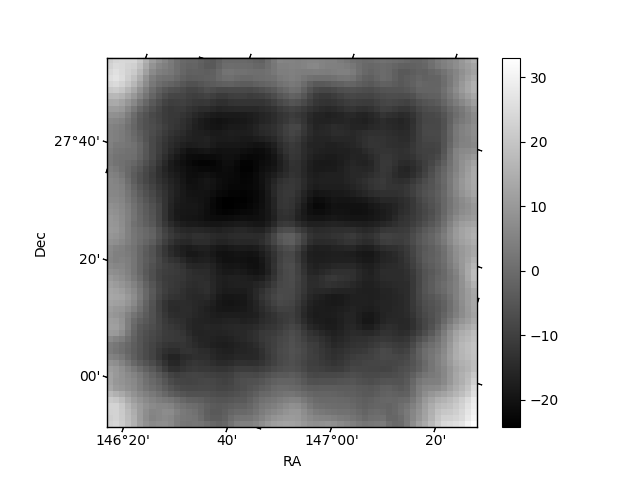
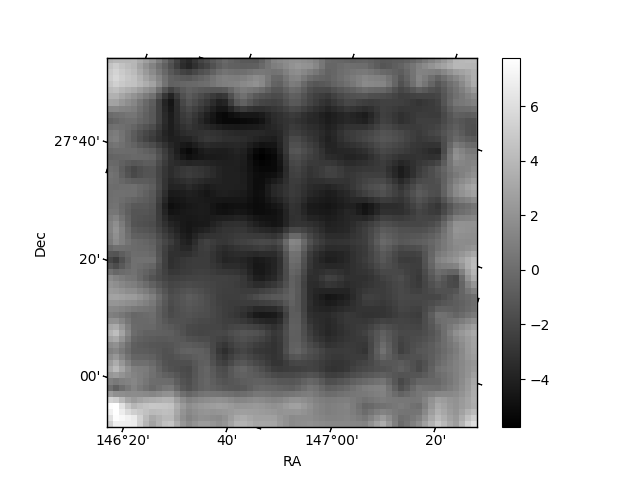
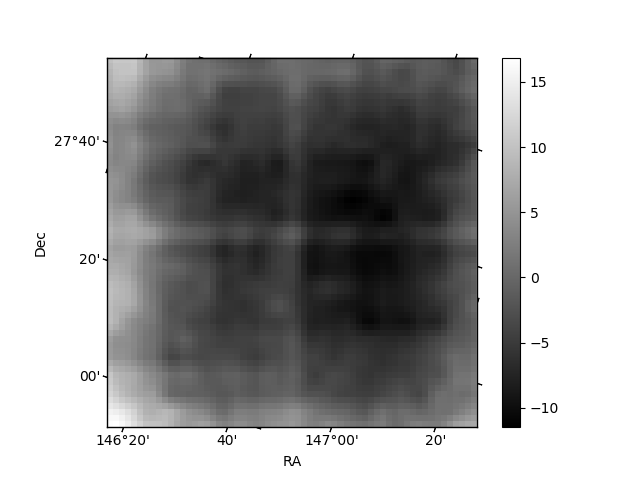
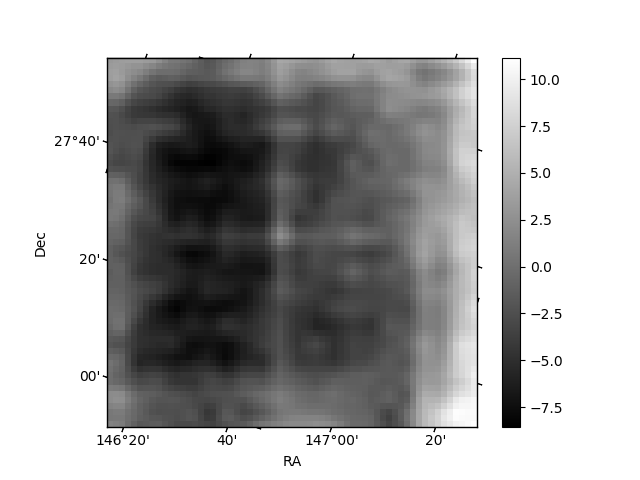
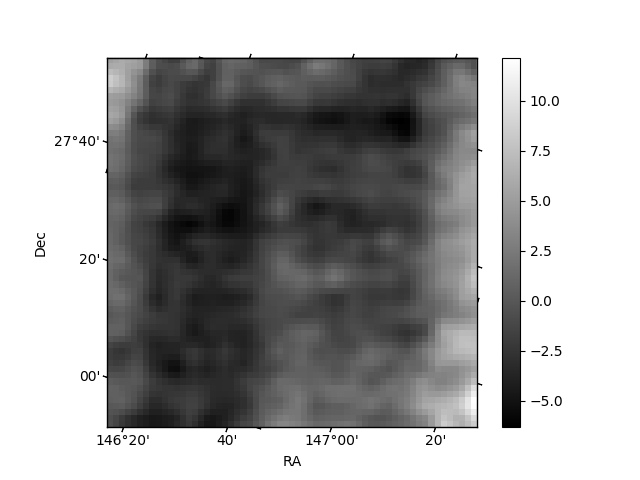
Histogram calculated using DETX and DETY for each event in the final _common_clean file
| Quadrant A | 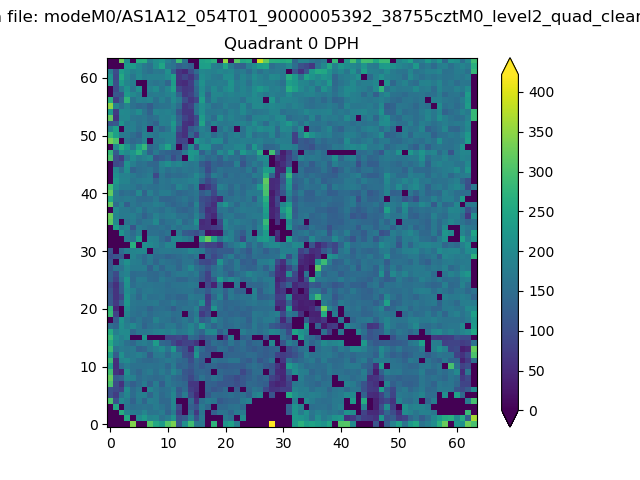 |
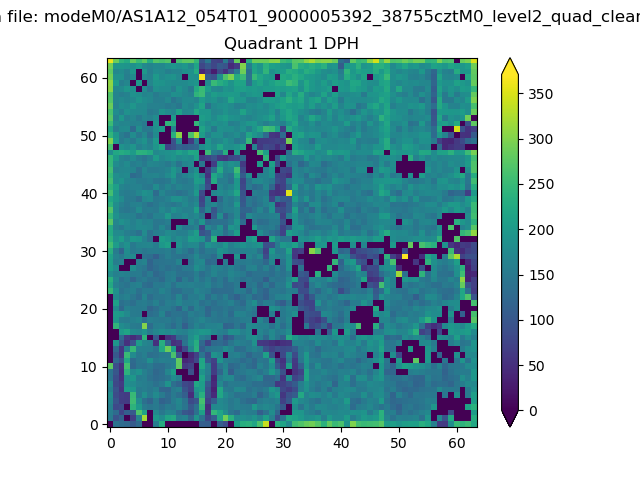 |
Quadrant B |
|---|---|---|---|
| Quadrant D | 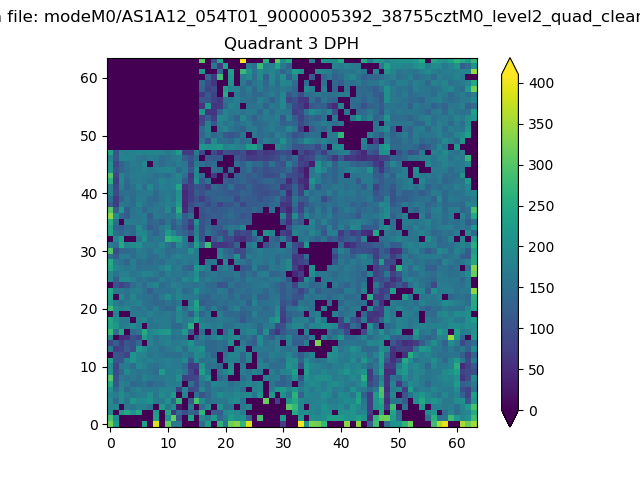 |
 |
Quadrant C |
| Plot type | Count rate plots | Images |
|---|---|---|
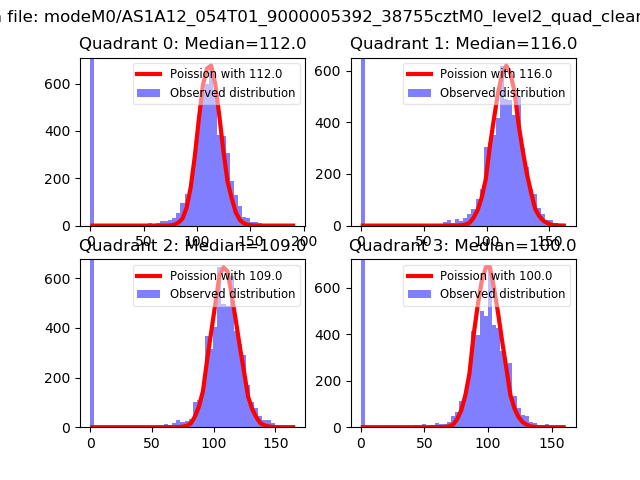
| Comparison with Poisson distribution Blue bars denote a histogram of data divided into 1 sec bins. Red curve is a Poisson curve with rate = median count rate of data. |
 |
 |
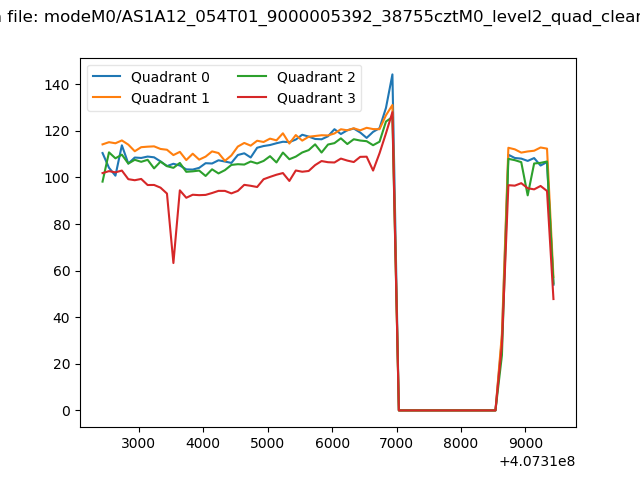
| Quadrant-wise count rates Data is divided into 100 sec bins |
 |
|
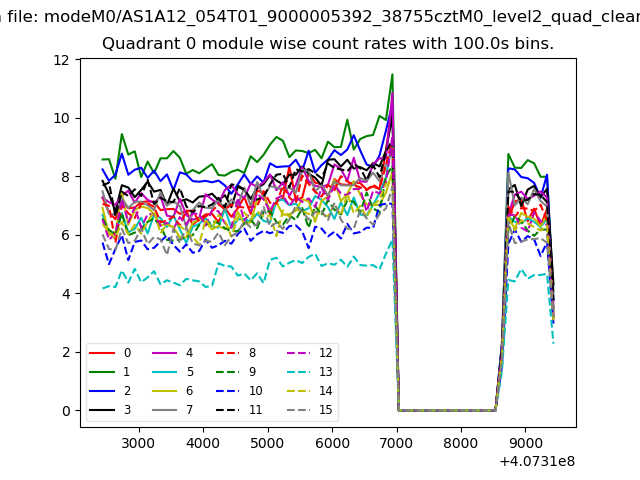
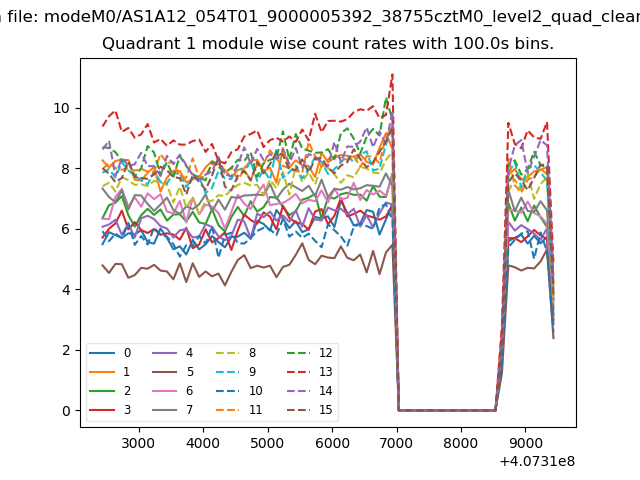
| Module-wise count rates for Quadrant A Data is divided into 100 sec bins |
 |
 |
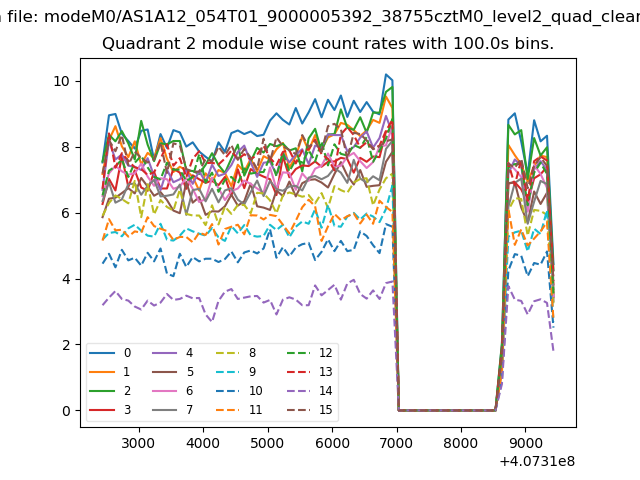
| Module-wise count rates for Quadrant B Data is divided into 100 sec bins |
 |
 |
| Module-wise count rates for Quadrant C Data is divided into 100 sec bins |
 |
 |
| Module-wise count rates for Quadrant D Data is divided into 100 sec bins |
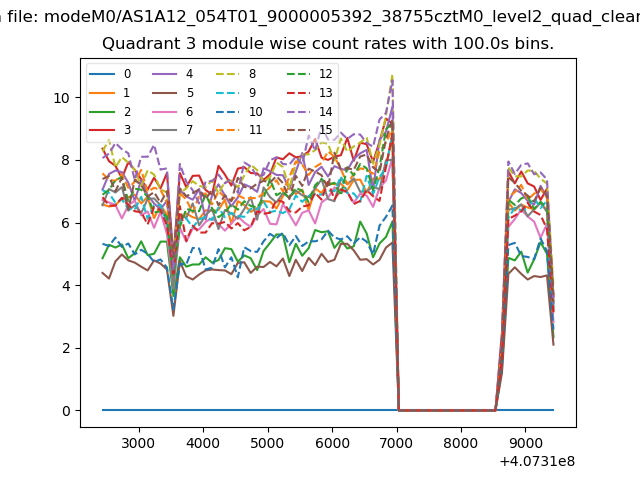 |
 |
| Parameter | Plot |
|---|---|
| CZT HV Monitor | 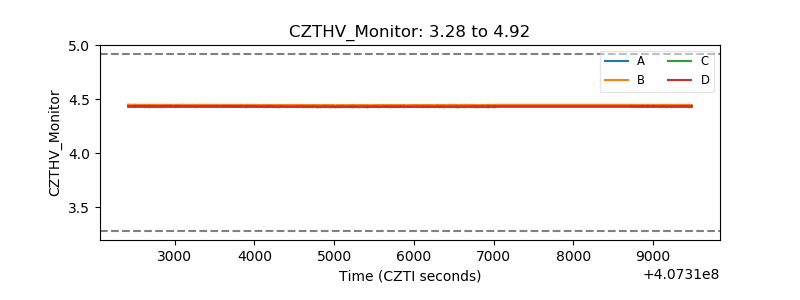 |
| D_VDD | 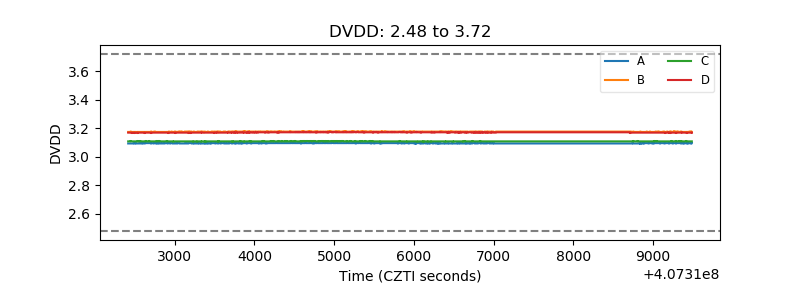 |
| Temperature 1 | 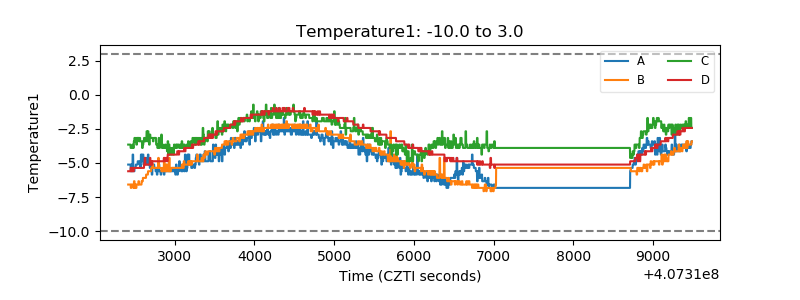 |
| Veto HV Monitor | 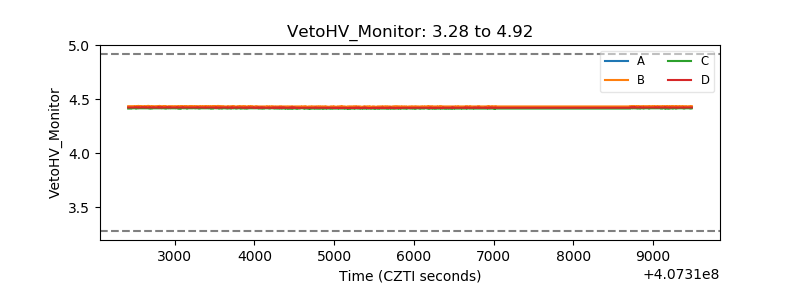 |
| Veto LLD | 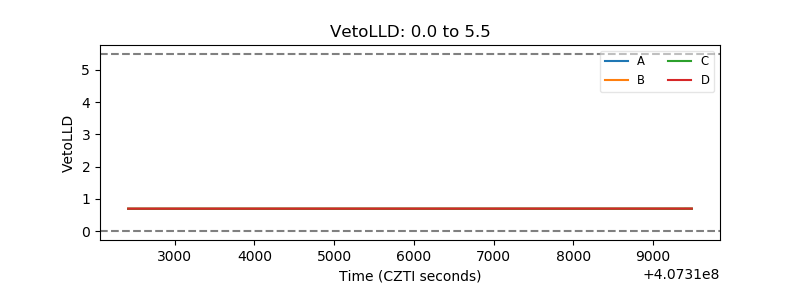 |
| Alpha Counter | 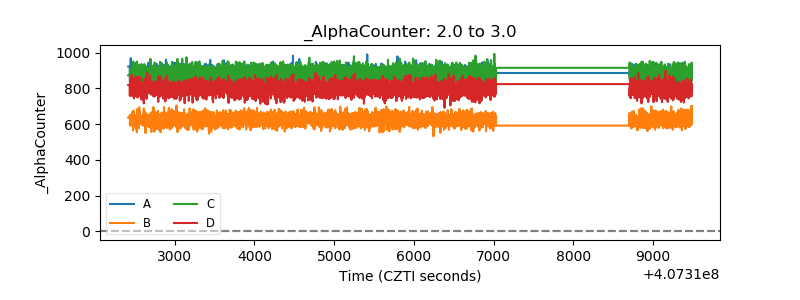 |
| _CPM_Rate | 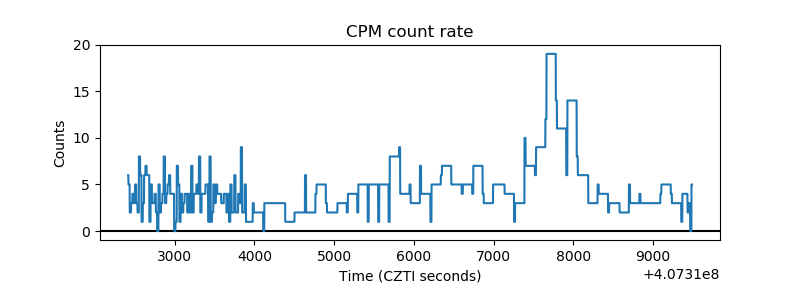 |
| CZT Counter | 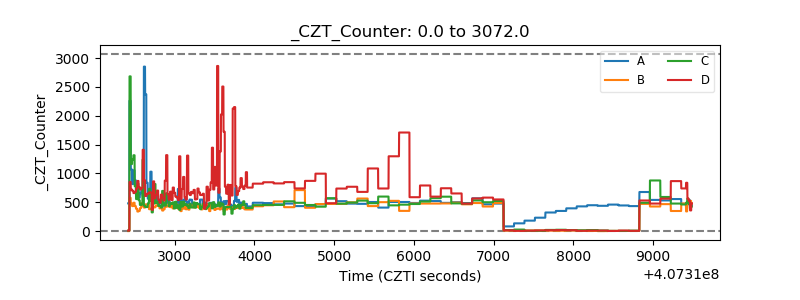 |
| +2.5 Volts monitor | 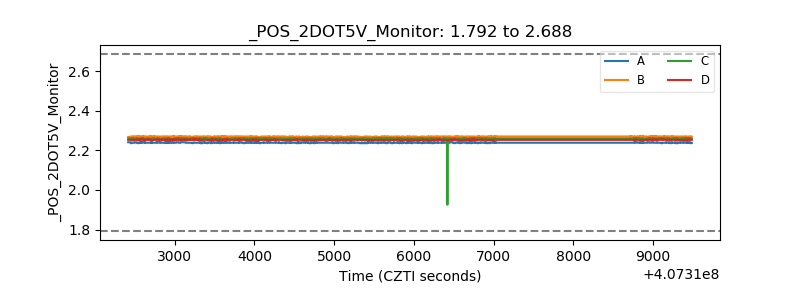 |
| +5 Volts monitor | 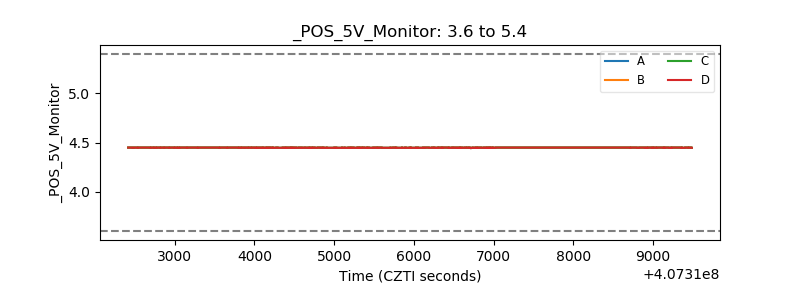 |
| _ROLL_ROT | 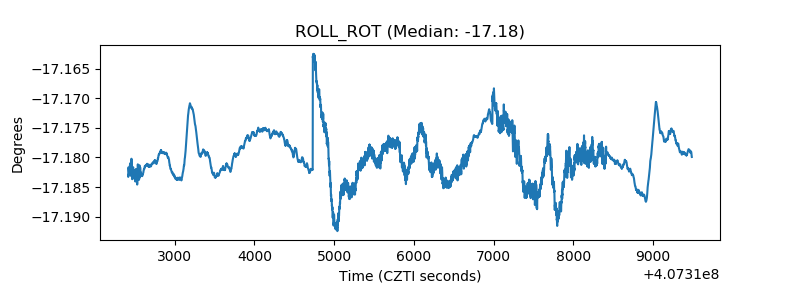 |
| _Roll_DEC | 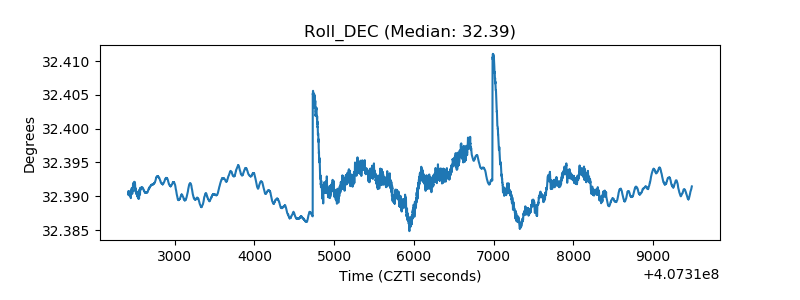 |
| _Roll_RA |  |
| Veto Counter | 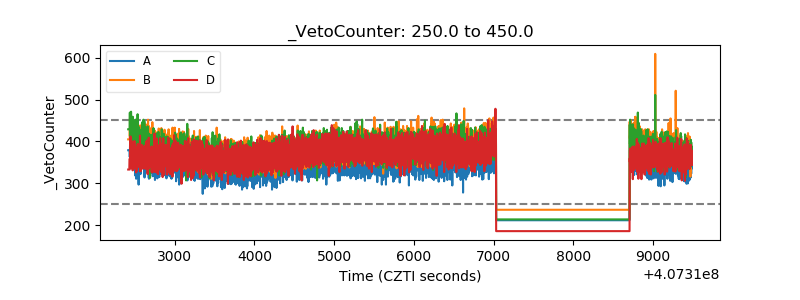 |