| Param | Original file | Final file |
|---|---|---|
| Filename | modeM0/AS1A12_054T01_9000005392_38756cztM0_level2.fits | modeM0/AS1A12_054T01_9000005392_38756cztM0_level2_quad_clean.evt |
| Size (bytes) | 366,134,400 | 92,568,960 |
| Size | 349.2 MB | 88.3 MB |
| Events in quadrant A | 2,982,610 | 627,373 |
| Events in quadrant B | 2,891,567 | 629,778 |
| Events in quadrant C | 2,807,608 | 602,092 |
| Events in quadrant D | 4,434,045 | 550,590 |
| Mode M9 | |||
|---|---|---|---|
| Quadrant | BADHDUFLAG | Total packets | Discarded packets |
| A | 0 | 15 | 0 |
| B | 0 | 15 | 0 |
| C | 0 | 15 | 0 |
| D | 0 | 16 | 0 |
| Mode SS | |||
|---|---|---|---|
| Quadrant | BADHDUFLAG | Total packets | Discarded packets |
| A | 0 | 114 | 0 |
| B | 0 | 114 | 0 |
| C | 0 | 114 | 0 |
| D | 0 | 114 | 0 |
| Mode M0 | |||
|---|---|---|---|
| Quadrant | BADHDUFLAG | Total packets | Discarded packets |
| A | 0 | 12113 | 3 |
| B | 0 | 12340 | 2 |
| C | 0 | 11735 | 2 |
| D | 0 | 17030 | 2 |
| Quadrant | Total seconds | Saturated seconds | Saturation percentage |
|---|---|---|---|
| A | 5620 | 23 | 0.409253% |
| B | 5620 | 104 | 1.850534% |
| C | 5620 | 35 | 0.622776% |
| D | 5620 | 148 | 2.633452% |
Noise dominated data is calculated using 1-second bins in cleaned event files. If a bin has >2000 counts, and if more than 50% of those come from <1% of pixels, then it is considered to be noise-dominated and hence unusable.
| Quadrant | # 1 sec bins | Bins with >0 counts | Bins with >2000 counts | High rate bins dominated by noise | Noise dominated (total time) | Noise dominated (detector-on time) | Marked lightcurve |
|---|---|---|---|---|---|---|---|
| A | 6993 | 5621 | 17 | 17 | 0.24% | 0.30% | 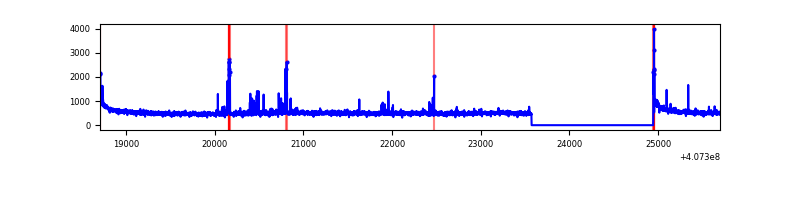 |
| B | 6993 | 5621 | 75 | 75 | 1.07% | 1.33% | 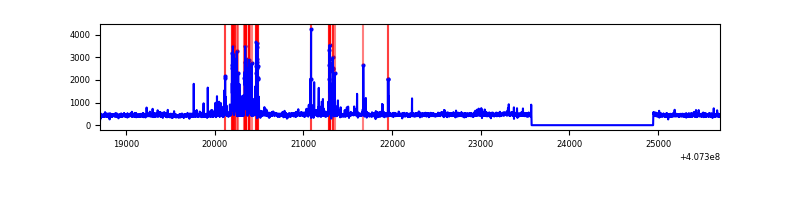 |
| C | 6993 | 5621 | 32 | 32 | 0.46% | 0.57% | 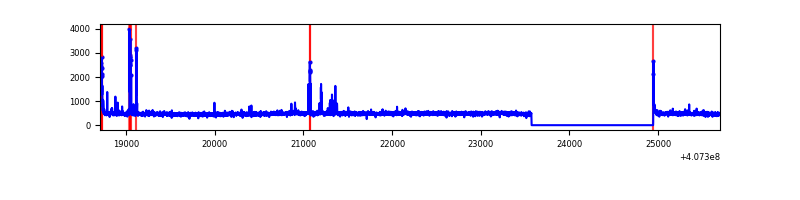 |
| D | 6993 | 5621 | 108 | 108 | 1.54% | 1.92% | 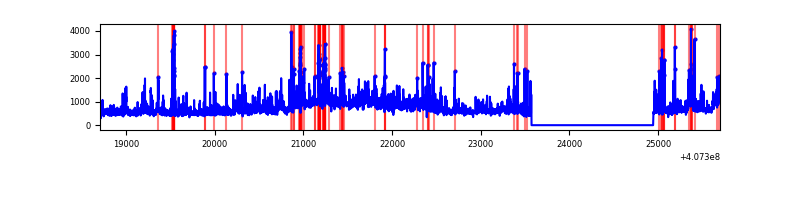 |
Top three noisy pixels from each quadrant. If the there are fewer than three noisy pixels in the level2.evt file, extra rows are filled as -1
| Pixel properties | Quadrant properties | ||||||
|---|---|---|---|---|---|---|---|
| Quadrant | DetID | PixID | Counts | Sigma | Mean | Median | Sigma |
| A | 10 | 83 | 428110 | 3317.1 | 629 | 617 | 128.9 |
| A | 9 | 143 | 41790 | 319.48 | 629 | 617 | 128.9 |
| A | 13 | 248 | 33925 | 258.45 | 629 | 617 | 128.9 |
| B | 4 | 171 | 309353 | 2547.01 | 620 | 604 | 121.2 |
| B | 5 | 172 | 49149 | 400.47 | 620 | 604 | 121.2 |
| B | 15 | 85 | 25853 | 208.29 | 620 | 604 | 121.2 |
| C | 15 | 214 | 250489 | 1752.11 | 610 | 614 | 142.6 |
| C | 14 | 254 | 67073 | 466.01 | 610 | 614 | 142.6 |
| C | 0 | 10 | 59403 | 412.23 | 610 | 614 | 142.6 |
| D | 2 | 16 | 1401638 | 9307.23 | 607 | 589 | 150.5 |
| D | 5 | 222 | 291358 | 1931.59 | 607 | 589 | 150.5 |
| D | 10 | 118 | 217560 | 1441.35 | 607 | 589 | 150.5 |
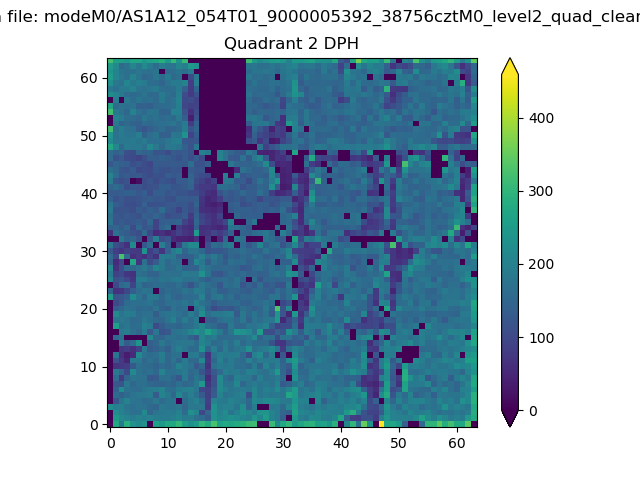
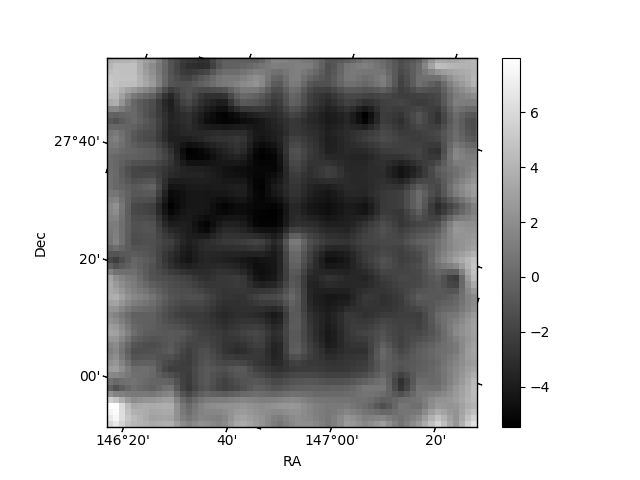
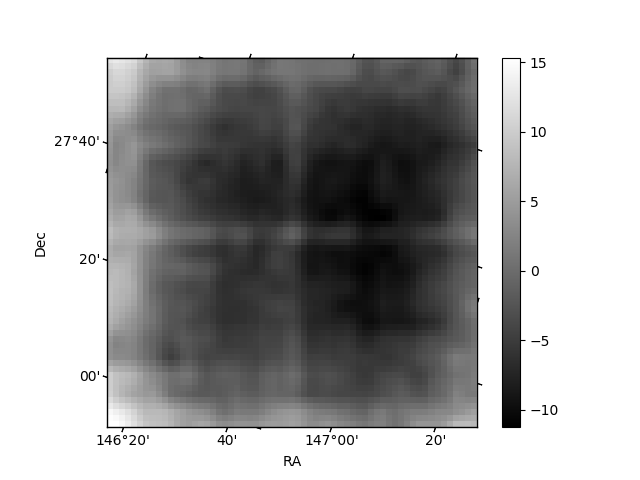
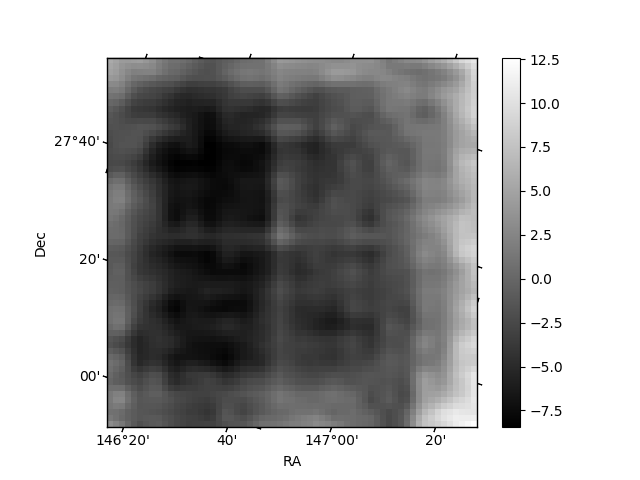
Histogram calculated using DETX and DETY for each event in the final _common_clean file
| Quadrant A | 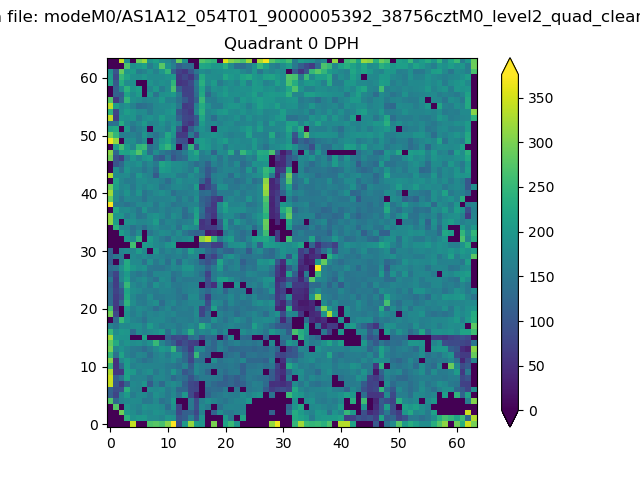 |
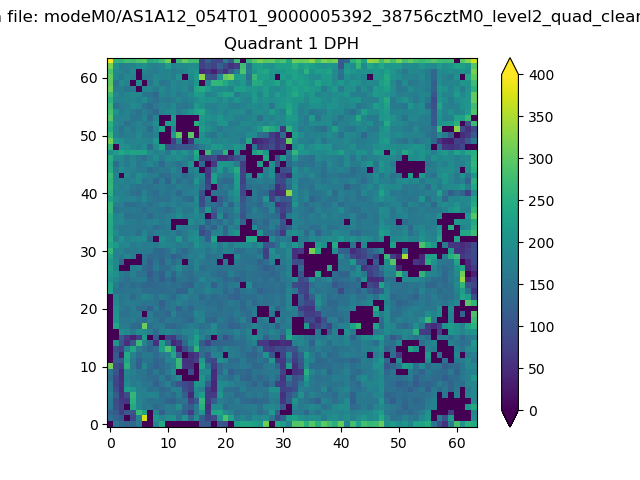 |
Quadrant B |
|---|---|---|---|
| Quadrant D | 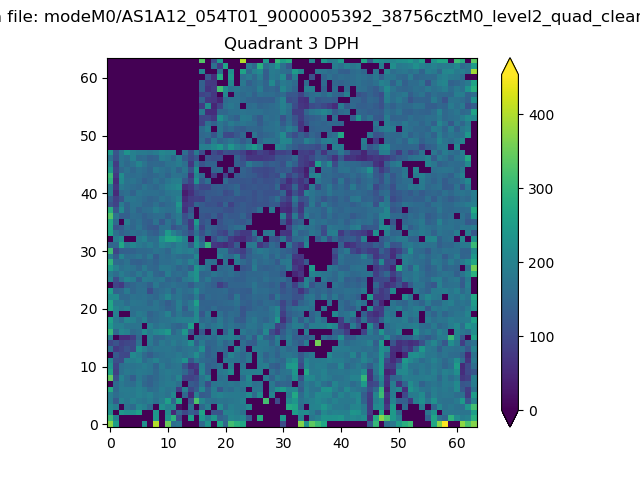 |
 |
Quadrant C |
| Plot type | Count rate plots | Images |
|---|---|---|
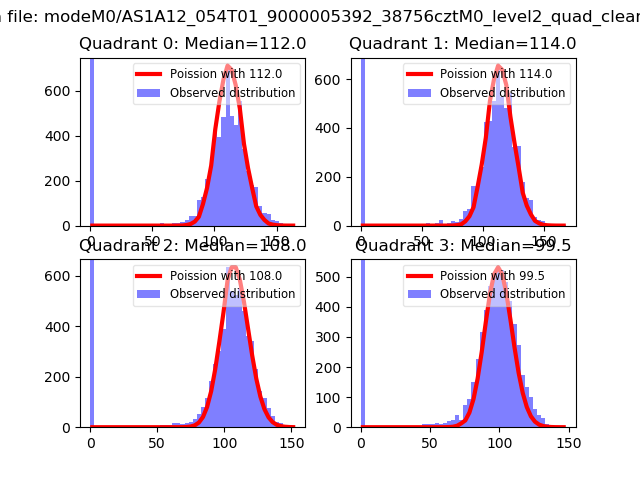
| Comparison with Poisson distribution Blue bars denote a histogram of data divided into 1 sec bins. Red curve is a Poisson curve with rate = median count rate of data. |
 |
 |
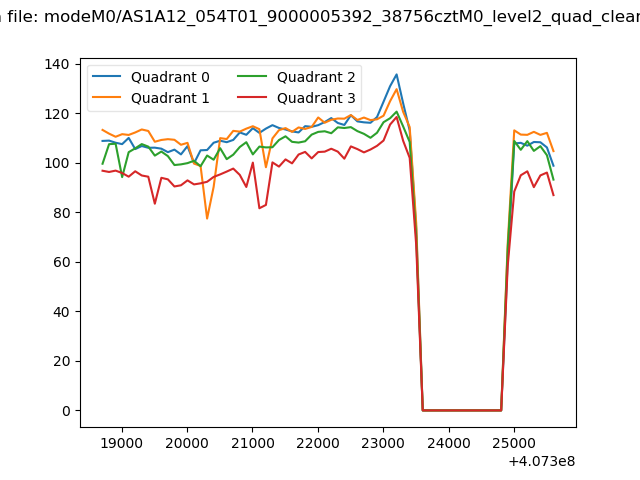
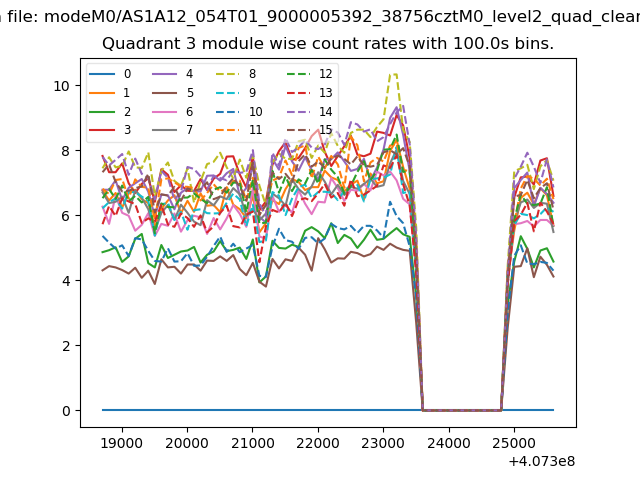
| Quadrant-wise count rates Data is divided into 100 sec bins |
 |
|
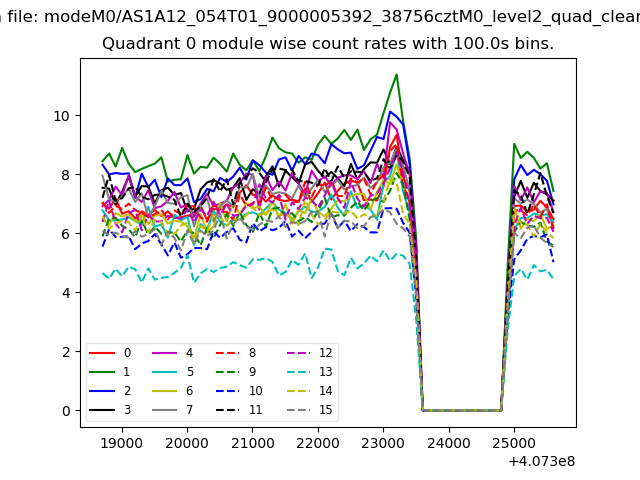
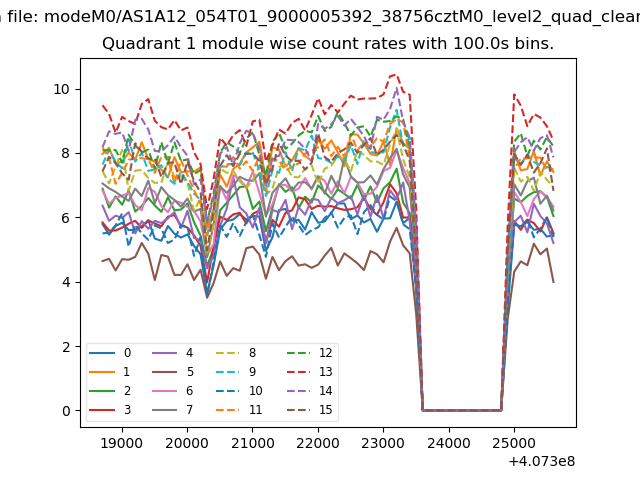
| Module-wise count rates for Quadrant A Data is divided into 100 sec bins |
 |
 |
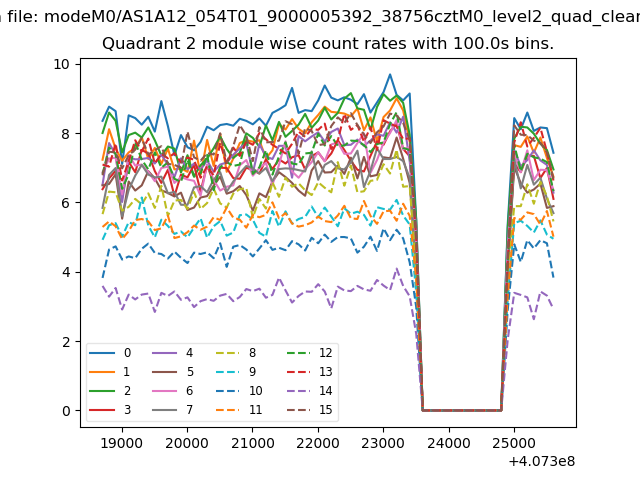
| Module-wise count rates for Quadrant B Data is divided into 100 sec bins |
 |
 |
| Module-wise count rates for Quadrant C Data is divided into 100 sec bins |
 |
 |
| Module-wise count rates for Quadrant D Data is divided into 100 sec bins |
 |
 |
| Parameter | Plot |
|---|---|
| CZT HV Monitor | 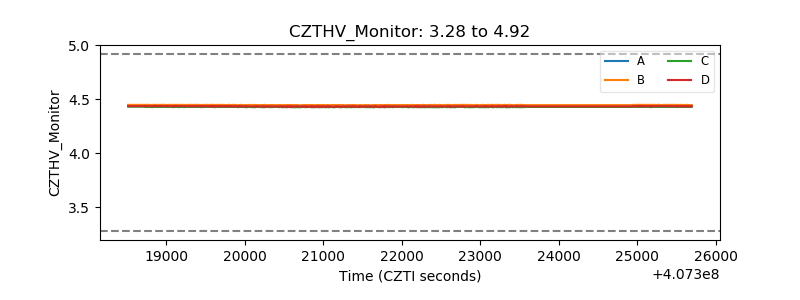 |
| D_VDD | 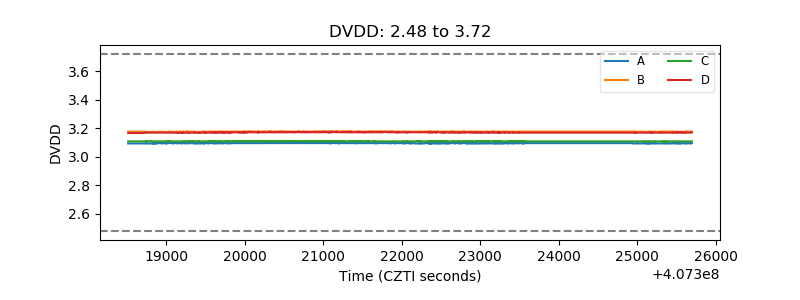 |
| Temperature 1 | 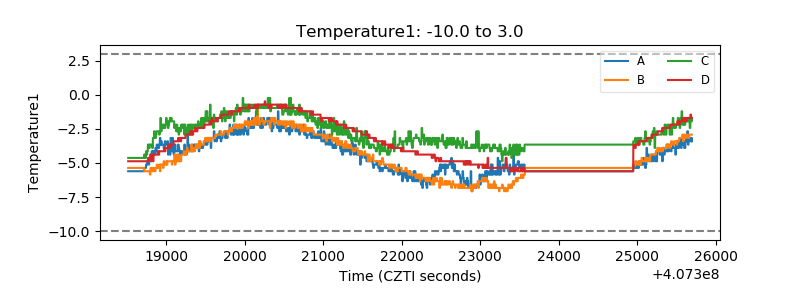 |
| Veto HV Monitor | 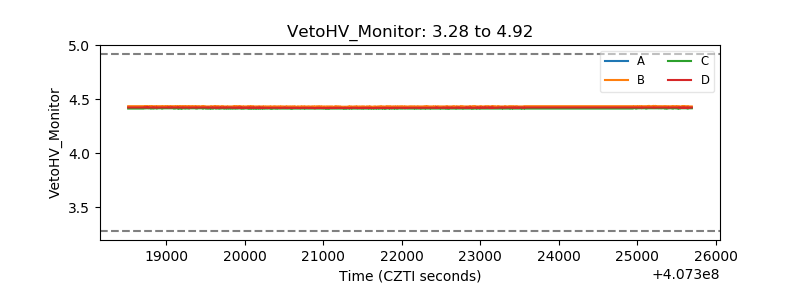 |
| Veto LLD | 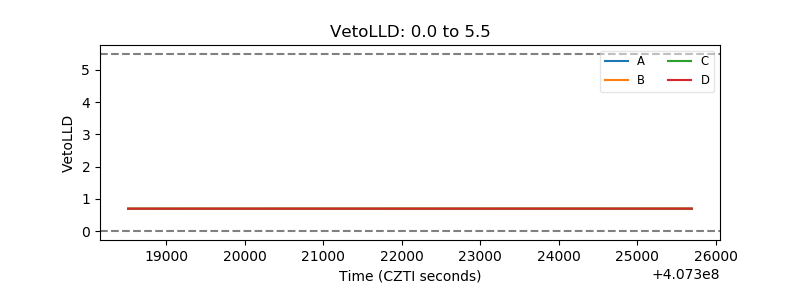 |
| Alpha Counter | 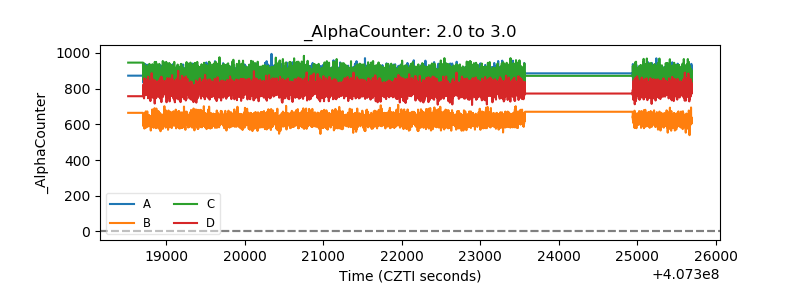 |
| _CPM_Rate | 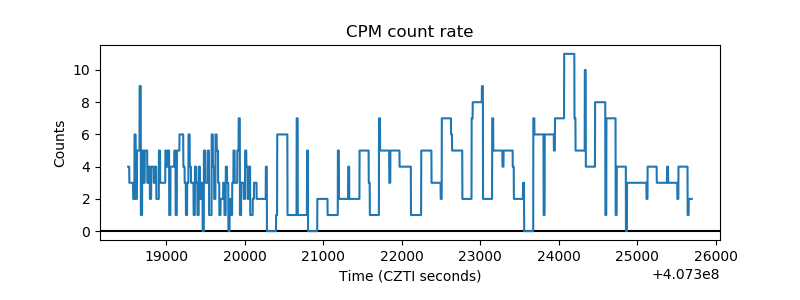 |
| CZT Counter | 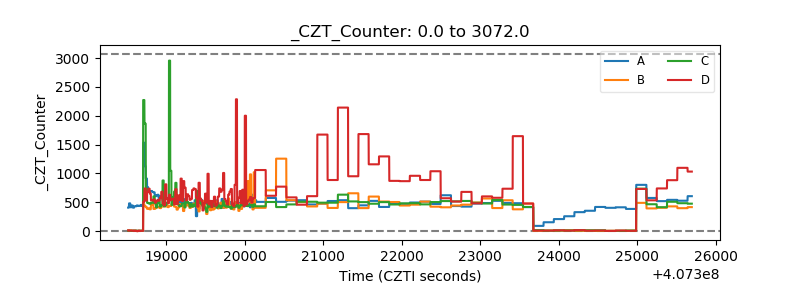 |
| +2.5 Volts monitor | 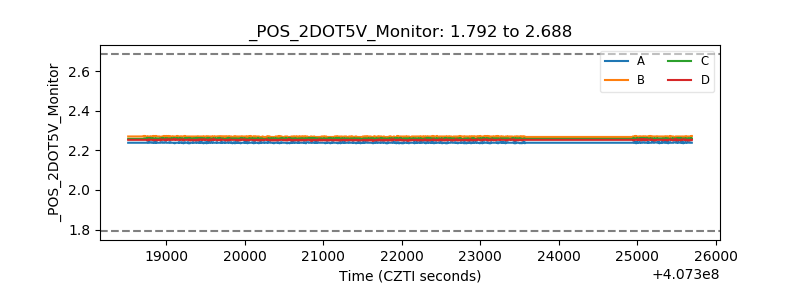 |
| +5 Volts monitor |  |
| _ROLL_ROT | 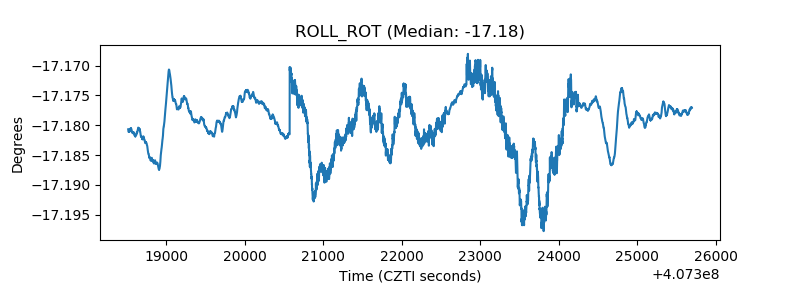 |
| _Roll_DEC | 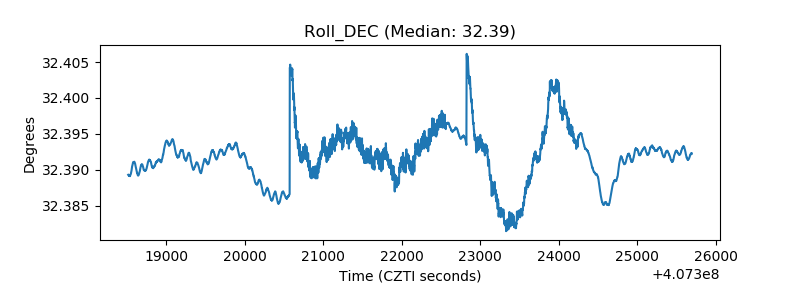 |
| _Roll_RA | 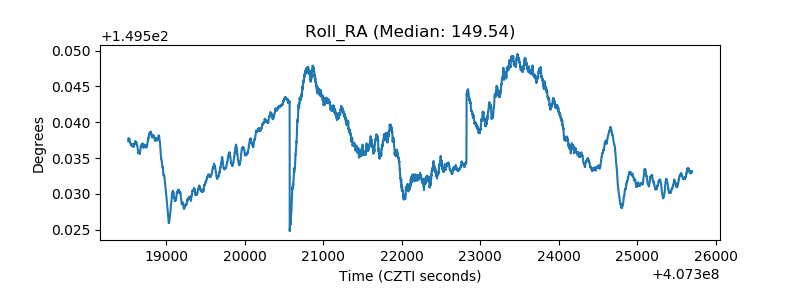 |
| Veto Counter | 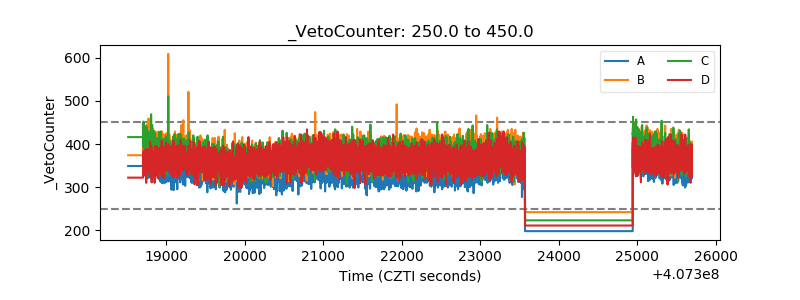 |