| Param | Original file | Final file |
|---|---|---|
| Filename | modeM0/AS1A12_054T01_9000005392_38757cztM0_level2.fits | modeM0/AS1A12_054T01_9000005392_38757cztM0_level2_quad_clean.evt |
| Size (bytes) | 261,956,160 | 65,171,520 |
| Size | 249.8 MB | 62.2 MB |
| Events in quadrant A | 2,090,363 | 438,386 |
| Events in quadrant B | 1,809,778 | 446,521 |
| Events in quadrant C | 1,916,762 | 421,631 |
| Events in quadrant D | 3,569,431 | 386,024 |
| Mode M9 | |||
|---|---|---|---|
| Quadrant | BADHDUFLAG | Total packets | Discarded packets |
| A | 0 | 4 | 0 |
| B | 0 | 4 | 0 |
| C | 0 | 4 | 0 |
| D | 0 | 5 | 0 |
| Mode SS | |||
|---|---|---|---|
| Quadrant | BADHDUFLAG | Total packets | Discarded packets |
| A | 0 | 80 | 0 |
| B | 0 | 80 | 0 |
| C | 0 | 80 | 0 |
| D | 0 | 80 | 0 |
| Mode M0 | |||
|---|---|---|---|
| Quadrant | BADHDUFLAG | Total packets | Discarded packets |
| A | 0 | 8567 | 1 |
| B | 0 | 8096 | 1 |
| C | 0 | 8094 | 1 |
| D | 0 | 13344 | 1 |
| Quadrant | Total seconds | Saturated seconds | Saturation percentage |
|---|---|---|---|
| A | 3976 | 27 | 0.679074% |
| B | 3976 | 3 | 0.075453% |
| C | 3976 | 2 | 0.050302% |
| D | 3976 | 118 | 2.967807% |
Noise dominated data is calculated using 1-second bins in cleaned event files. If a bin has >2000 counts, and if more than 50% of those come from <1% of pixels, then it is considered to be noise-dominated and hence unusable.
| Quadrant | # 1 sec bins | Bins with >0 counts | Bins with >2000 counts | High rate bins dominated by noise | Noise dominated (total time) | Noise dominated (detector-on time) | Marked lightcurve |
|---|---|---|---|---|---|---|---|
| A | 3976 | 3976 | 22 | 22 | 0.55% | 0.55% | 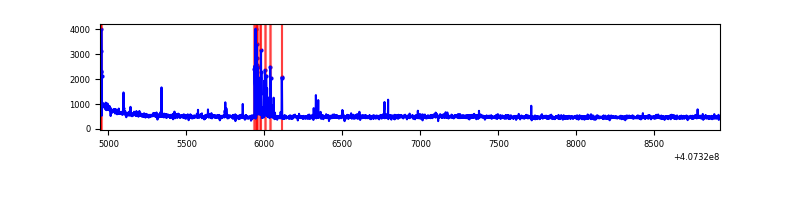 |
| B | 3976 | 3976 | 0 | 0 | 0.00% | 0.00% | 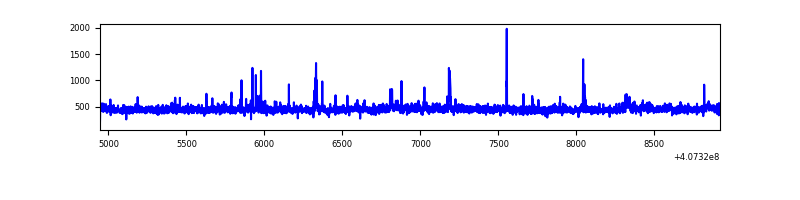 |
| C | 3976 | 3976 | 3 | 3 | 0.08% | 0.08% | 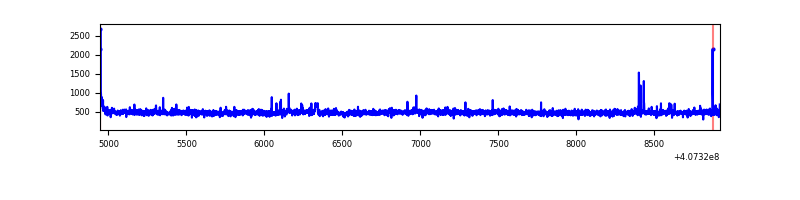 |
| D | 3976 | 3976 | 108 | 108 | 2.72% | 2.72% | 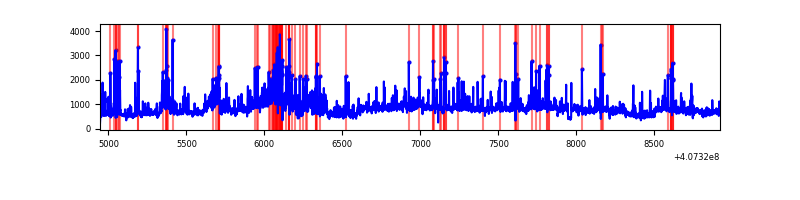 |
Top three noisy pixels from each quadrant. If the there are fewer than three noisy pixels in the level2.evt file, extra rows are filled as -1
| Pixel properties | Quadrant properties | ||||||
|---|---|---|---|---|---|---|---|
| Quadrant | DetID | PixID | Counts | Sigma | Mean | Median | Sigma |
| A | 10 | 83 | 262382 | 2904.37 | 440 | 432 | 90.2 |
| A | 13 | 248 | 87199 | 962.03 | 440 | 432 | 90.2 |
| A | 9 | 143 | 27604 | 301.27 | 440 | 432 | 90.2 |
| B | 4 | 171 | 34178 | 389.24 | 438 | 426 | 86.7 |
| B | 15 | 85 | 13744 | 153.59 | 438 | 426 | 86.7 |
| B | 12 | 111 | 10699 | 118.47 | 438 | 426 | 86.7 |
| C | 15 | 214 | 174664 | 1720.33 | 430 | 432 | 101.3 |
| C | 14 | 254 | 38433 | 375.21 | 430 | 432 | 101.3 |
| C | 0 | 10 | 12945 | 123.55 | 430 | 432 | 101.3 |
| D | 2 | 16 | 1270509 | 12072.85 | 427 | 415 | 105.2 |
| D | 5 | 222 | 329420 | 3127.35 | 427 | 415 | 105.2 |
| D | 10 | 118 | 152854 | 1449.01 | 427 | 415 | 105.2 |
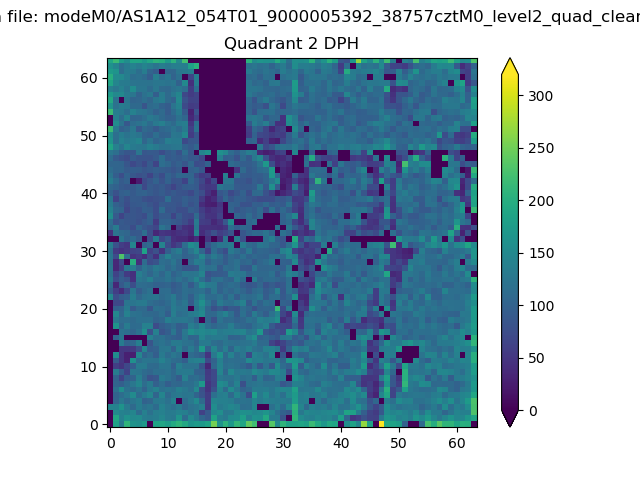
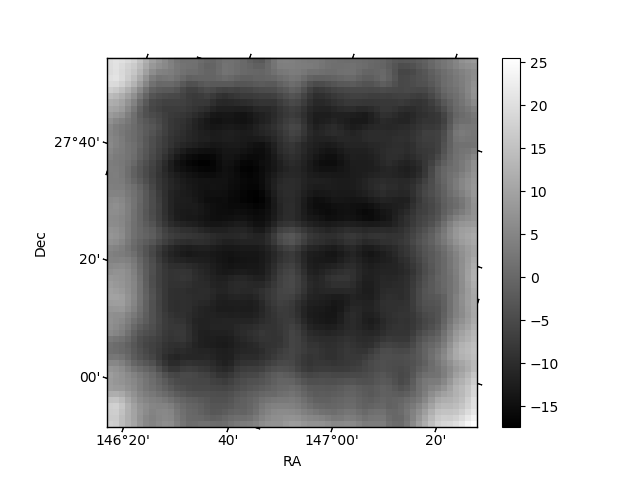
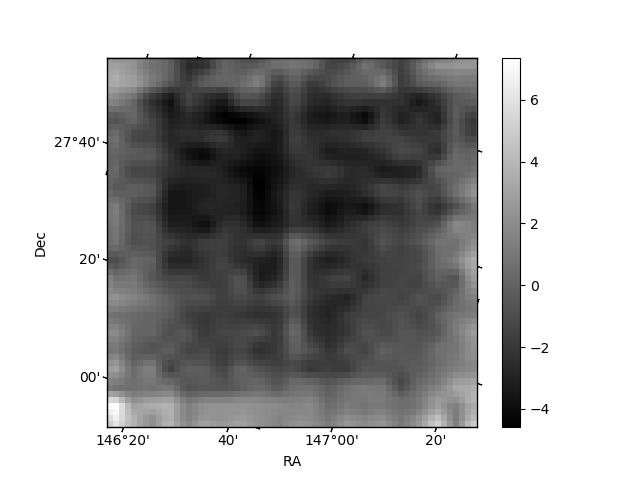
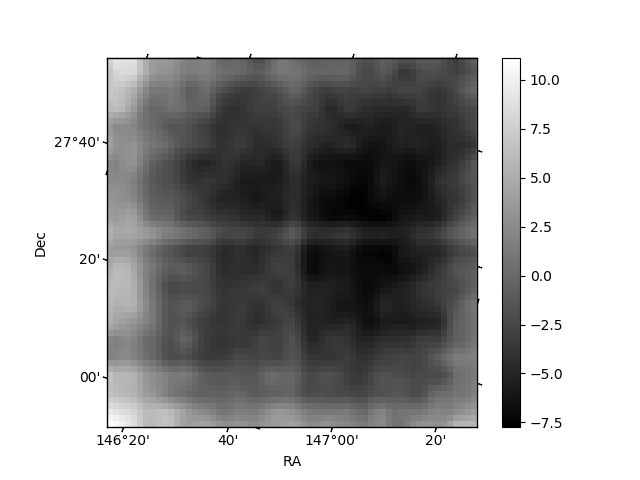
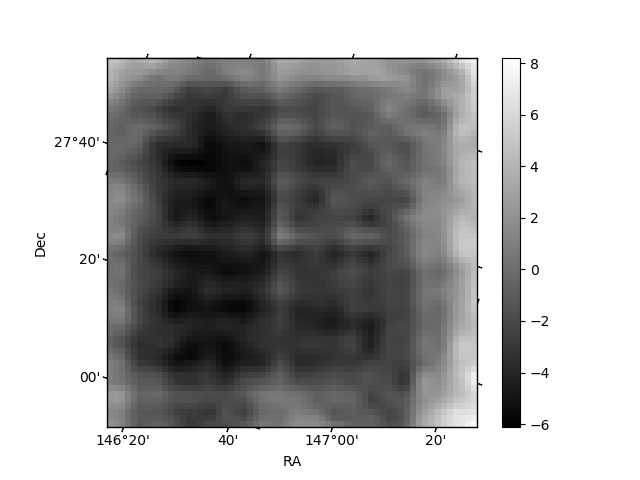
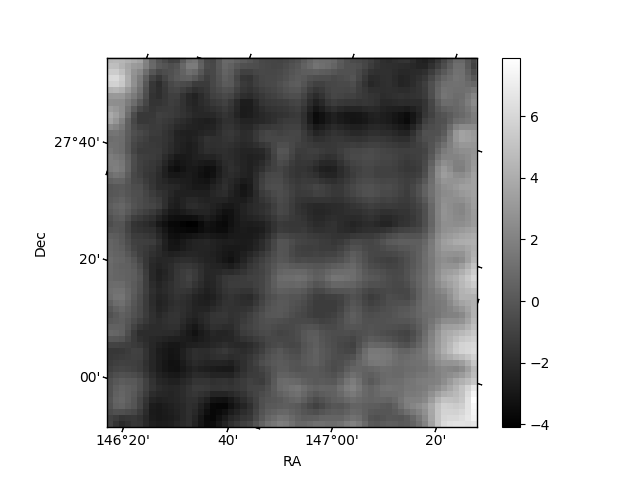
Histogram calculated using DETX and DETY for each event in the final _common_clean file
| Quadrant A | 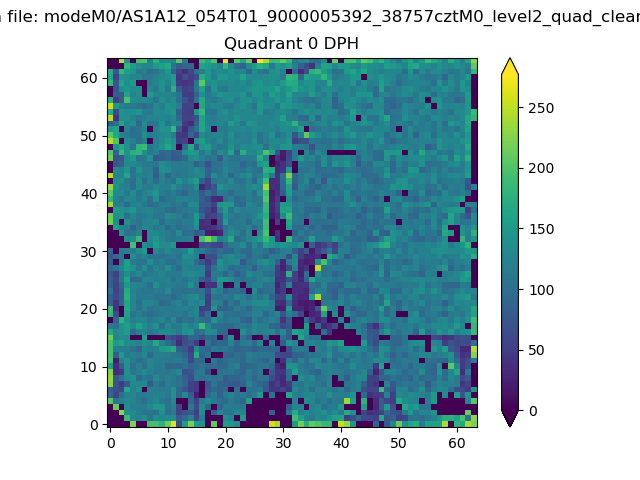 |
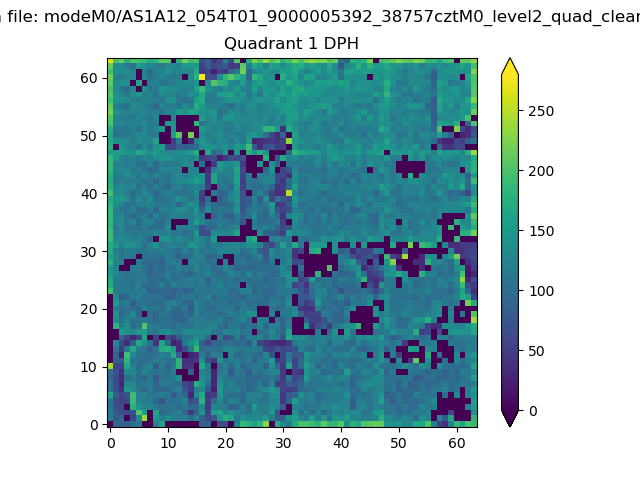 |
Quadrant B |
|---|---|---|---|
| Quadrant D | 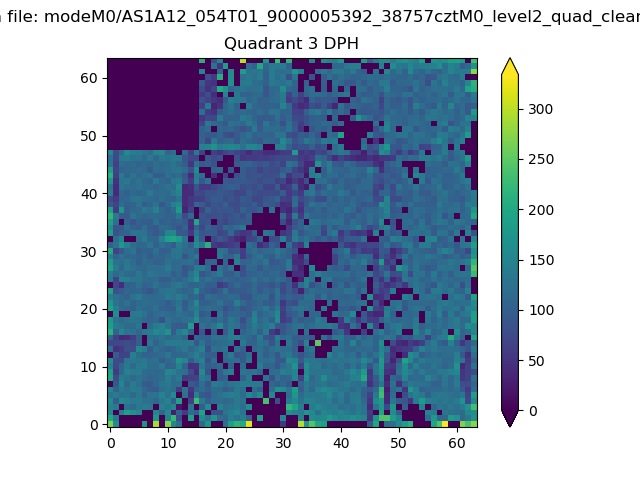 |
 |
Quadrant C |
| Plot type | Count rate plots | Images |
|---|---|---|
| Comparison with Poisson distribution Blue bars denote a histogram of data divided into 1 sec bins. Red curve is a Poisson curve with rate = median count rate of data. |
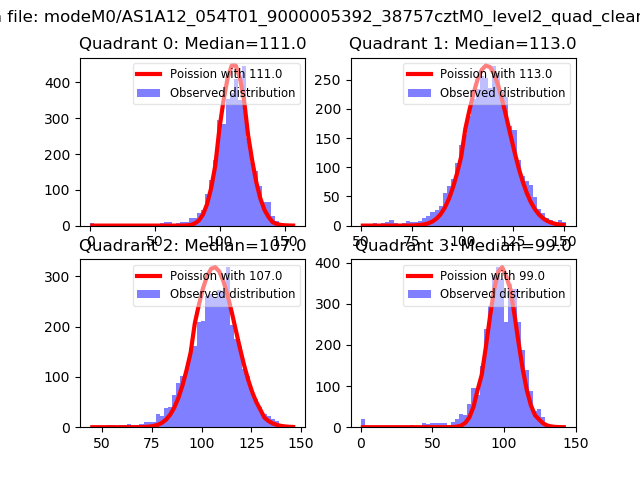 |
 |
| Quadrant-wise count rates Data is divided into 100 sec bins |
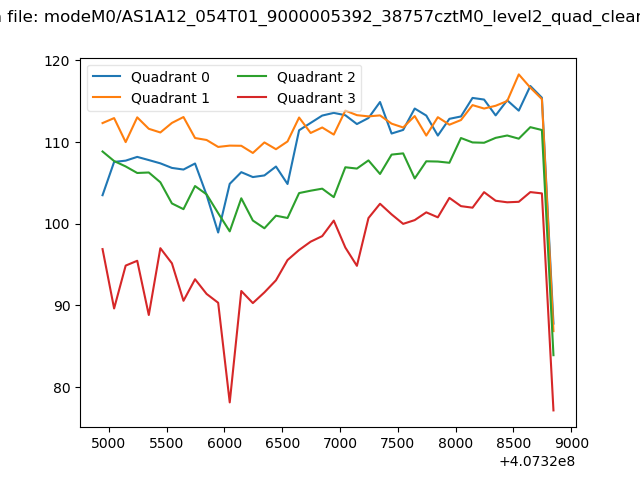 |
|
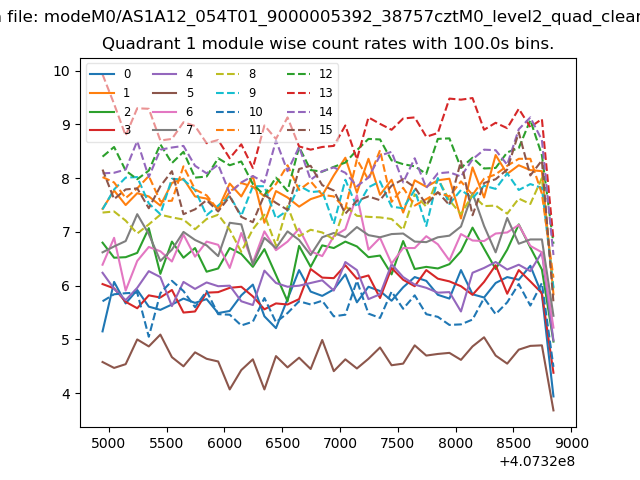
| Module-wise count rates for Quadrant A Data is divided into 100 sec bins |
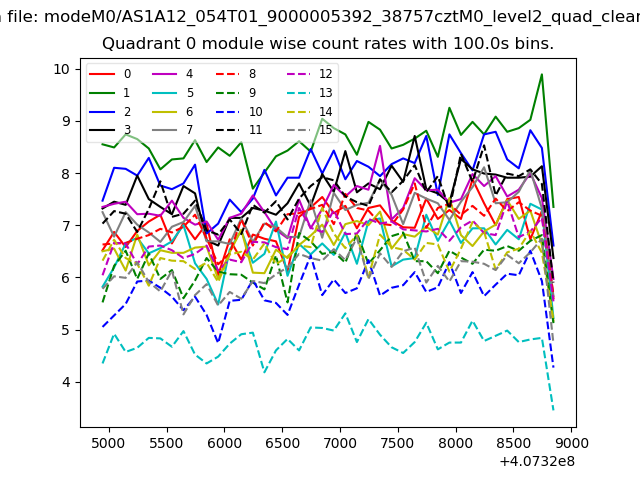 |
 |
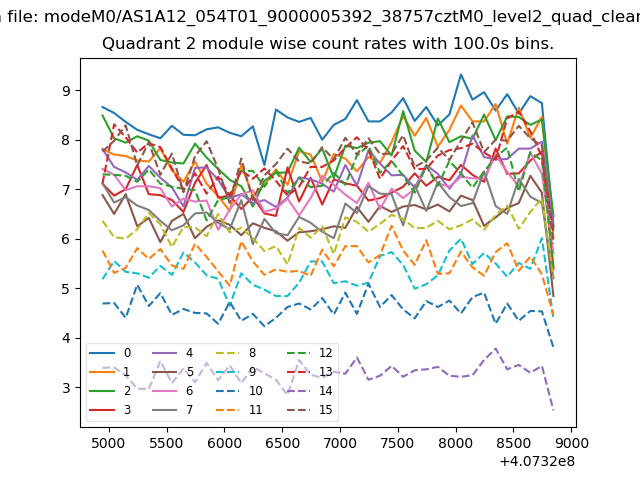
| Module-wise count rates for Quadrant B Data is divided into 100 sec bins |
 |
 |
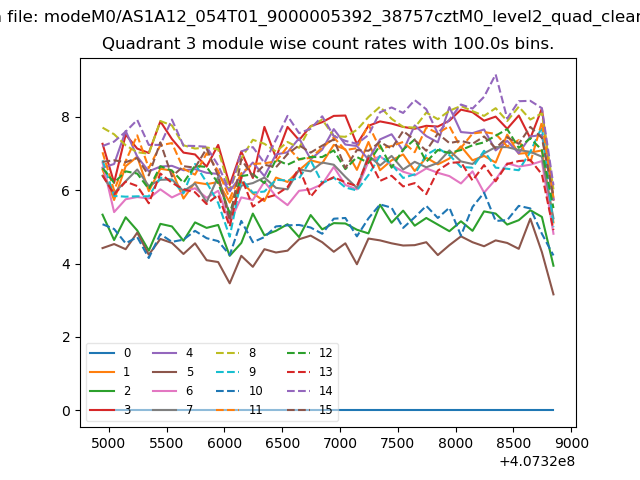
| Module-wise count rates for Quadrant C Data is divided into 100 sec bins |
 |
 |
| Module-wise count rates for Quadrant D Data is divided into 100 sec bins |
 |
 |
| Parameter | Plot |
|---|---|
| CZT HV Monitor | 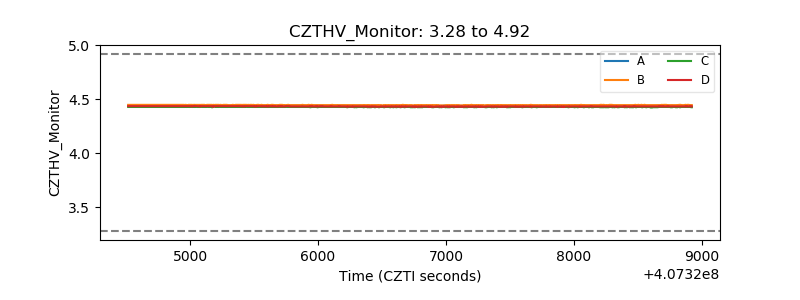 |
| D_VDD | 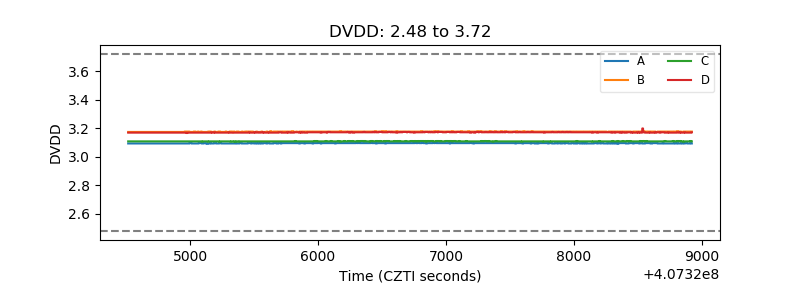 |
| Temperature 1 | 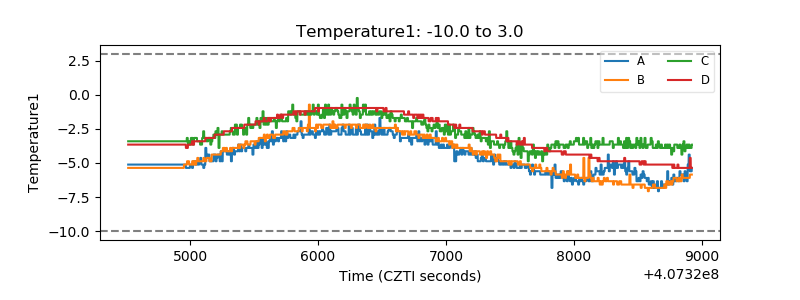 |
| Veto HV Monitor | 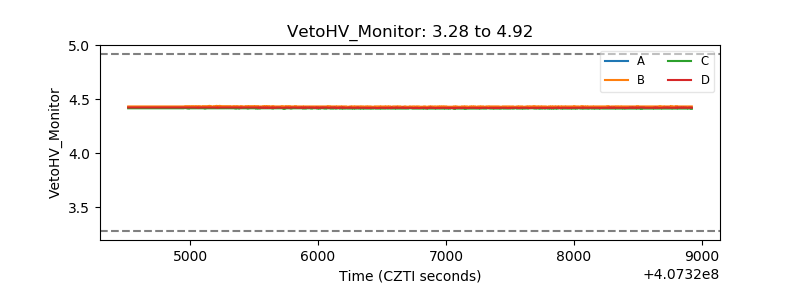 |
| Veto LLD | 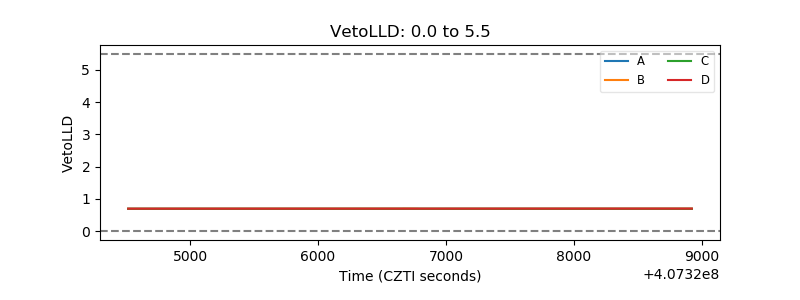 |
| Alpha Counter | 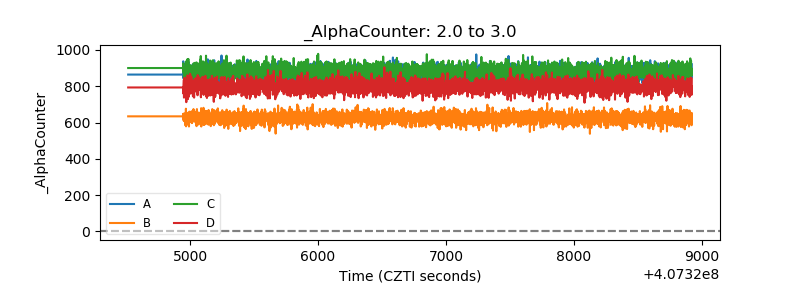 |
| _CPM_Rate | 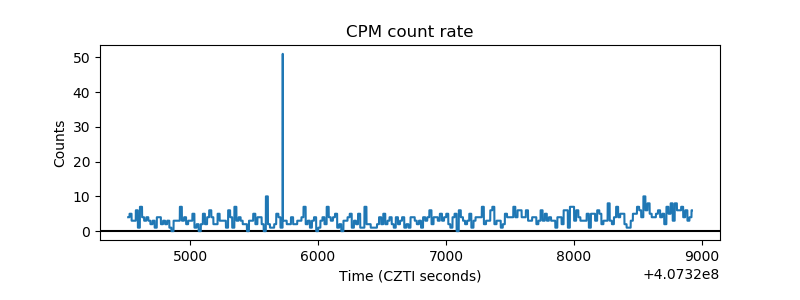 |
| CZT Counter | 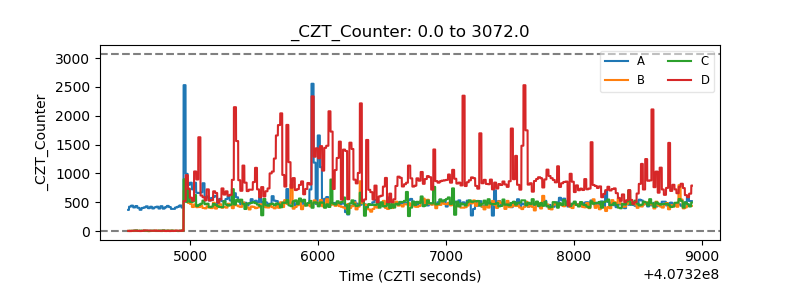 |
| +2.5 Volts monitor | 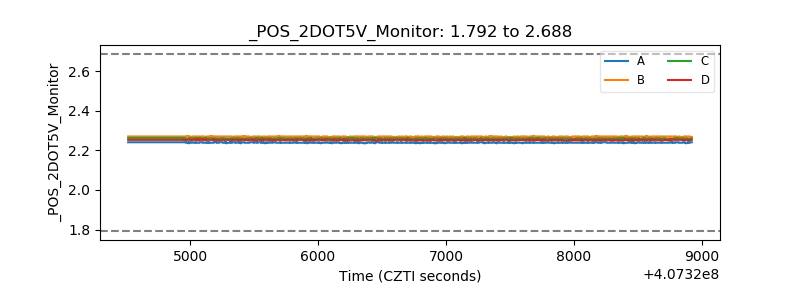 |
| +5 Volts monitor | 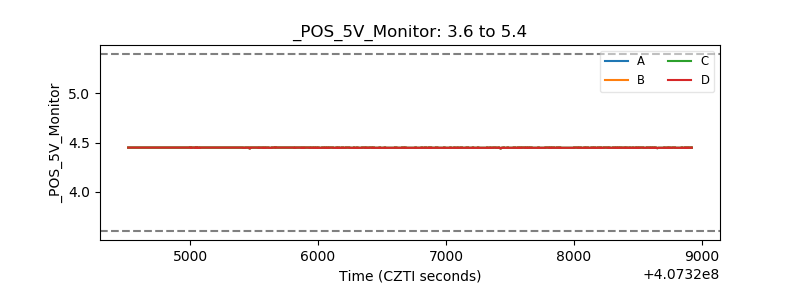 |
| _ROLL_ROT | 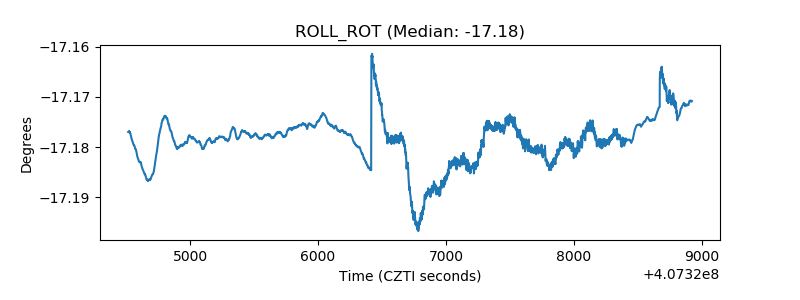 |
| _Roll_DEC | 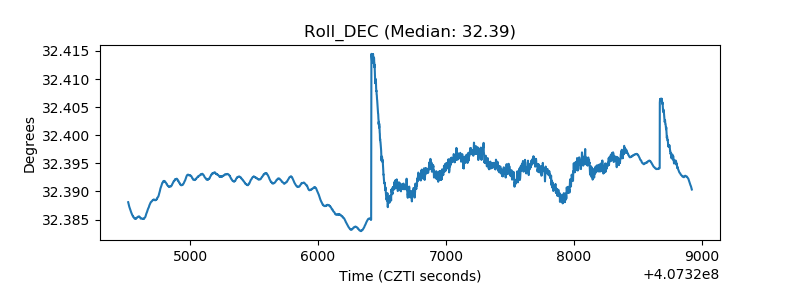 |
| _Roll_RA | 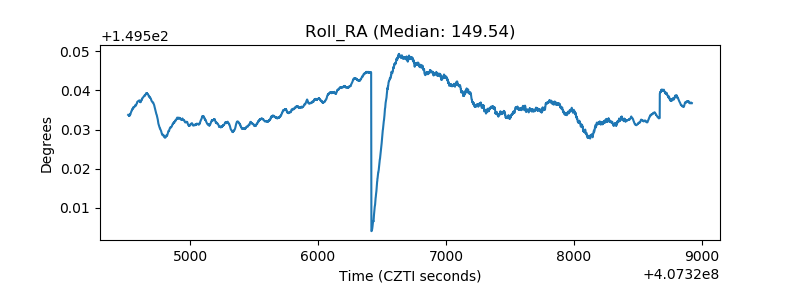 |
| Veto Counter | 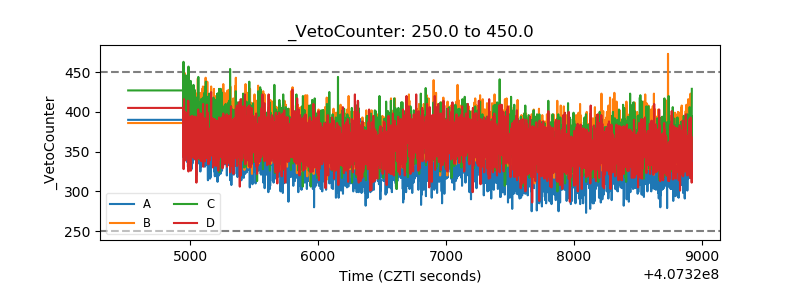 |