| Param | Original file | Final file |
|---|---|---|
| Filename | modeM0/AS1A12_051T01_9000005394_38757cztM0_level2.fits | modeM0/AS1A12_051T01_9000005394_38757cztM0_level2_quad_clean.evt |
| Size (bytes) | 77,955,840 | 16,787,520 |
| Size | 74.3 MB | 16.0 MB |
| Events in quadrant A | 606,840 | 109,213 |
| Events in quadrant B | 471,279 | 114,446 |
| Events in quadrant C | 539,061 | 111,884 |
| Events in quadrant D | 1,185,697 | 94,413 |
| Mode SS | |||
|---|---|---|---|
| Quadrant | BADHDUFLAG | Total packets | Discarded packets |
| A | 0 | 20 | 0 |
| B | 0 | 20 | 0 |
| C | 0 | 20 | 0 |
| D | 0 | 20 | 0 |
| Mode M0 | |||
|---|---|---|---|
| Quadrant | BADHDUFLAG | Total packets | Discarded packets |
| A | 0 | 2426 | 1 |
| B | 0 | 2065 | 0 |
| C | 0 | 2177 | 0 |
| D | 0 | 4239 | 0 |
| Mode M9 | |||
|---|---|---|---|
| Quadrant | BADHDUFLAG | Total packets | Discarded packets |
| A | 0 | 11 | 0 |
| B | 0 | 11 | 0 |
| C | 0 | 11 | 0 |
| D | 0 | 11 | 0 |
| Quadrant | Total seconds | Saturated seconds | Saturation percentage |
|---|---|---|---|
| A | 1025 | 6 | 0.585366% |
| B | 1025 | 6 | 0.585366% |
| C | 1025 | 4 | 0.390244% |
| D | 1025 | 118 | 11.512195% |
Noise dominated data is calculated using 1-second bins in cleaned event files. If a bin has >2000 counts, and if more than 50% of those come from <1% of pixels, then it is considered to be noise-dominated and hence unusable.
| Quadrant | # 1 sec bins | Bins with >0 counts | Bins with >2000 counts | High rate bins dominated by noise | Noise dominated (total time) | Noise dominated (detector-on time) | Marked lightcurve |
|---|---|---|---|---|---|---|---|
| A | 1025 | 1025 | 2 | 2 | 0.20% | 0.20% |  |
| B | 1025 | 1025 | 0 | 0 | 0.00% | 0.00% |  |
| C | 1025 | 1025 | 0 | 0 | 0.00% | 0.00% |  |
| D | 1025 | 1025 | 98 | 98 | 9.56% | 9.56% |  |
Top three noisy pixels from each quadrant. If the there are fewer than three noisy pixels in the level2.evt file, extra rows are filled as -1
| Pixel properties | Quadrant properties | ||||||
|---|---|---|---|---|---|---|---|
| Quadrant | DetID | PixID | Counts | Sigma | Mean | Median | Sigma |
| A | 10 | 83 | 123370 | 4739.62 | 117 | 114 | 26.0 |
| A | 9 | 143 | 15660 | 597.8 | 117 | 114 | 26.0 |
| A | 6 | 10 | 3593 | 133.78 | 117 | 114 | 26.0 |
| B | 10 | 247 | 3512 | 136.53 | 117 | 113 | 24.9 |
| B | 12 | 111 | 3025 | 116.97 | 117 | 113 | 24.9 |
| B | 11 | 111 | 2720 | 104.71 | 117 | 113 | 24.9 |
| C | 15 | 214 | 51375 | 1792.55 | 116 | 116 | 28.6 |
| C | 0 | 10 | 18705 | 650.06 | 116 | 116 | 28.6 |
| C | 14 | 254 | 14680 | 509.31 | 116 | 116 | 28.6 |
| D | 2 | 16 | 448792 | 15382.23 | 112 | 109 | 29.2 |
| D | 5 | 222 | 206651 | 7080.89 | 112 | 109 | 29.2 |
| D | 10 | 118 | 78465 | 2686.28 | 112 | 109 | 29.2 |
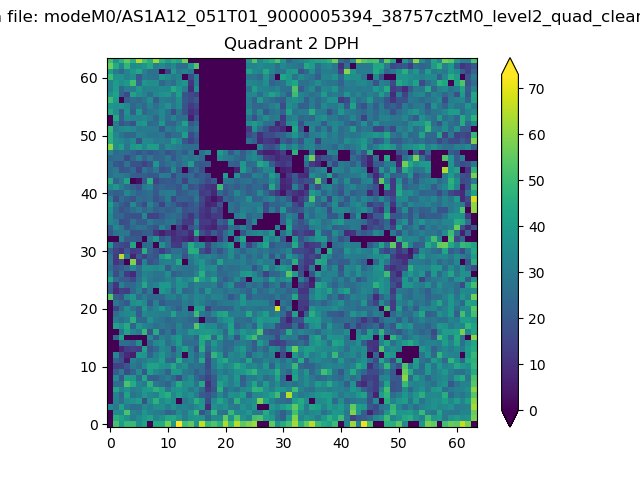
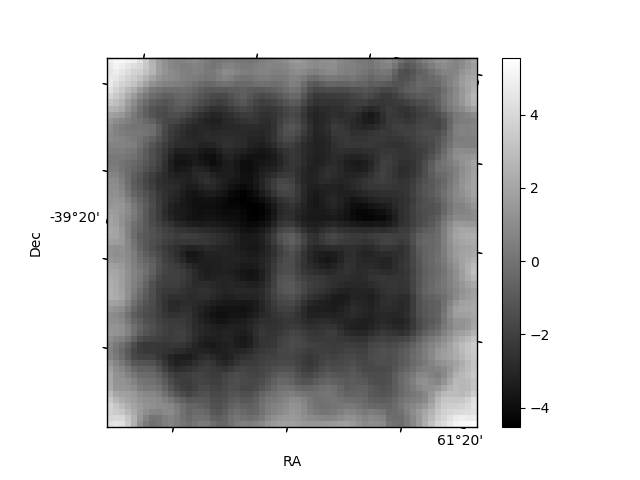
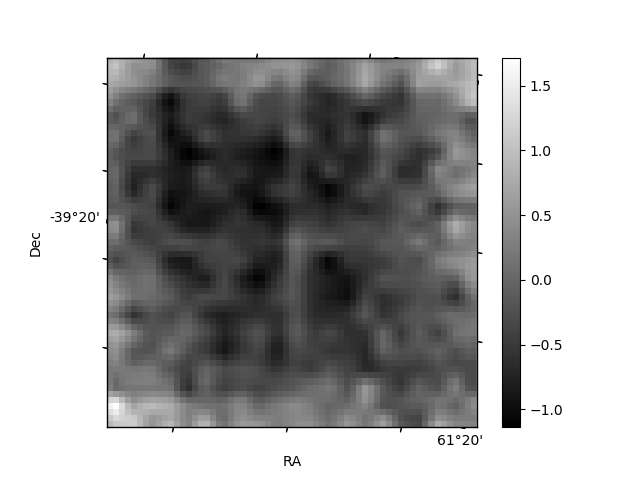
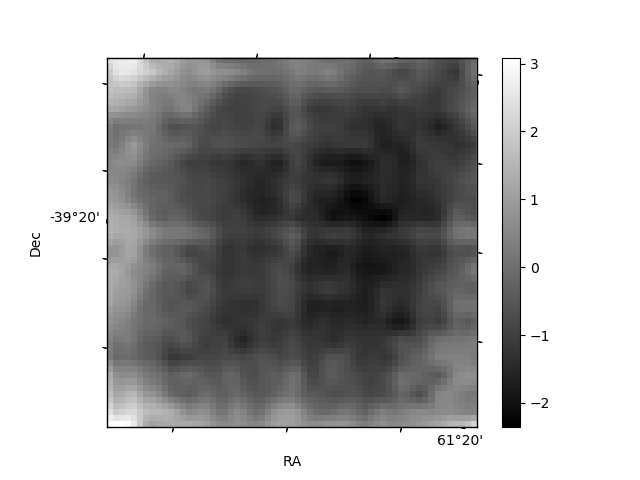
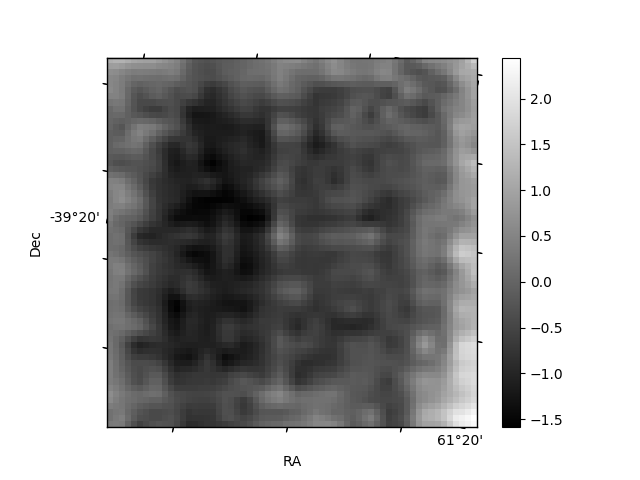
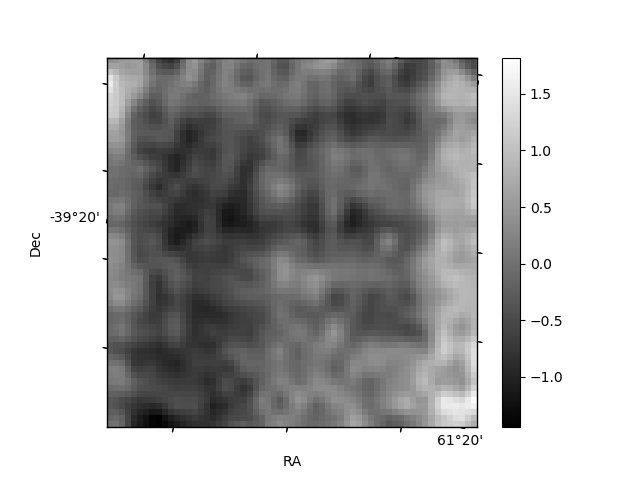
Histogram calculated using DETX and DETY for each event in the final _common_clean file
| Quadrant A | 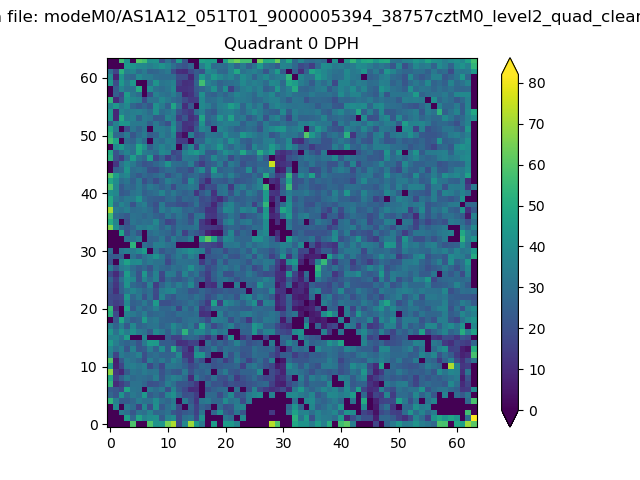 |
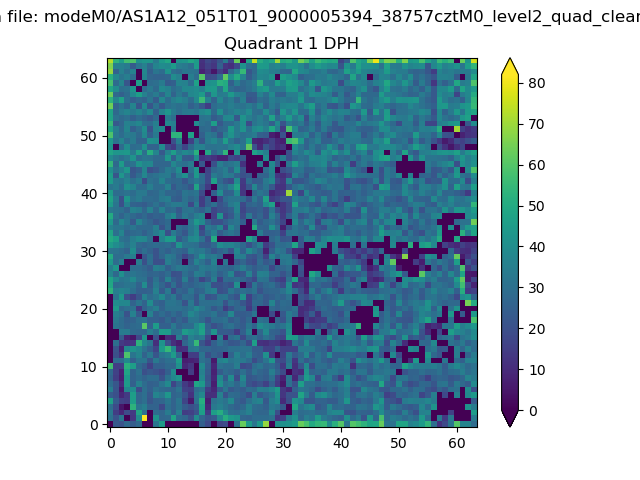 |
Quadrant B |
|---|---|---|---|
| Quadrant D | 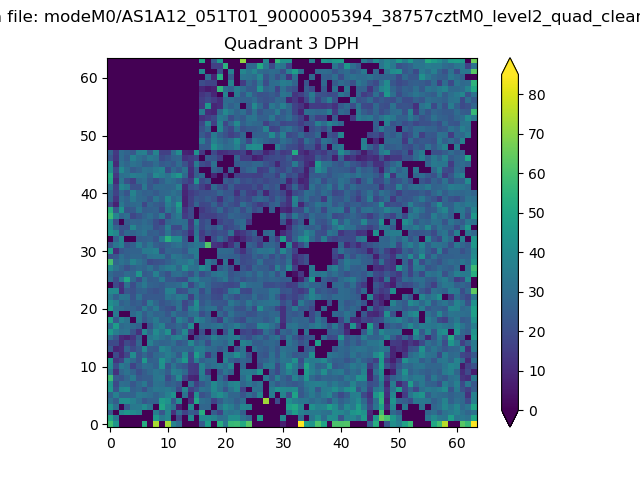 |
 |
Quadrant C |
| Plot type | Count rate plots | Images |
|---|---|---|
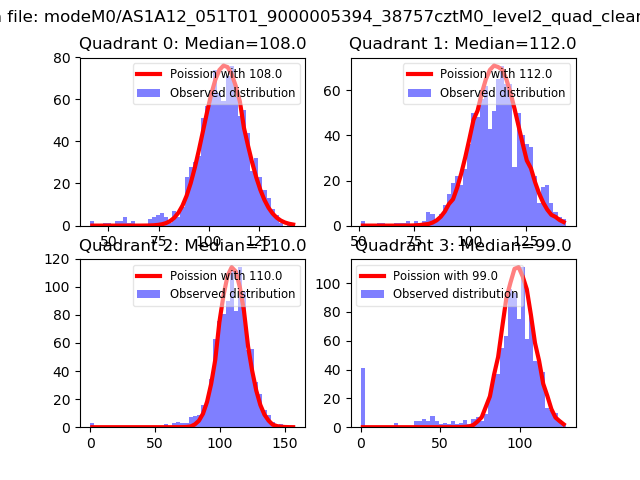
| Comparison with Poisson distribution Blue bars denote a histogram of data divided into 1 sec bins. Red curve is a Poisson curve with rate = median count rate of data. |
 |
 |
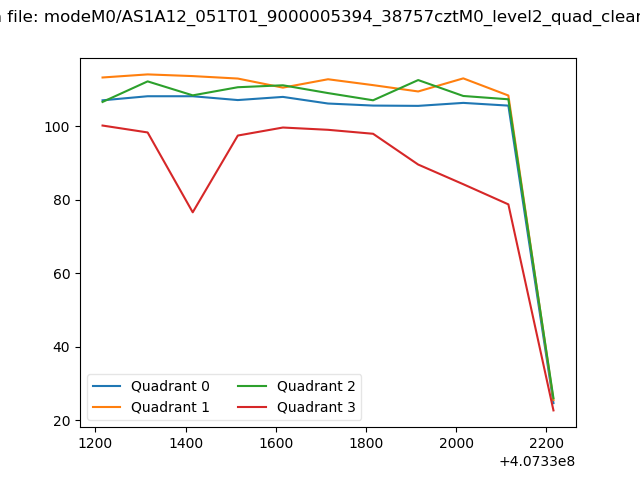
| Quadrant-wise count rates Data is divided into 100 sec bins |
 |
|
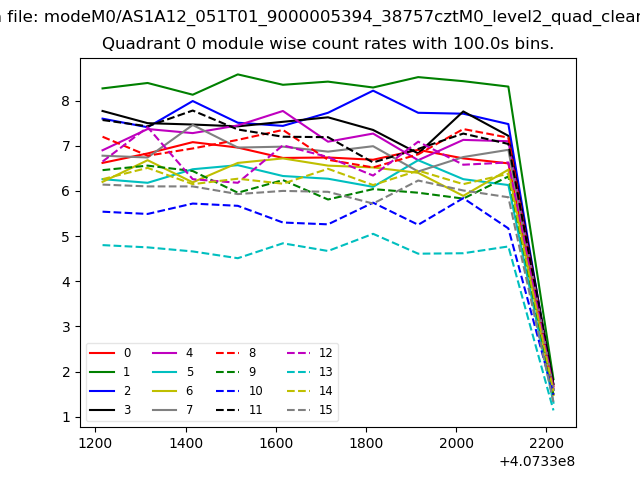
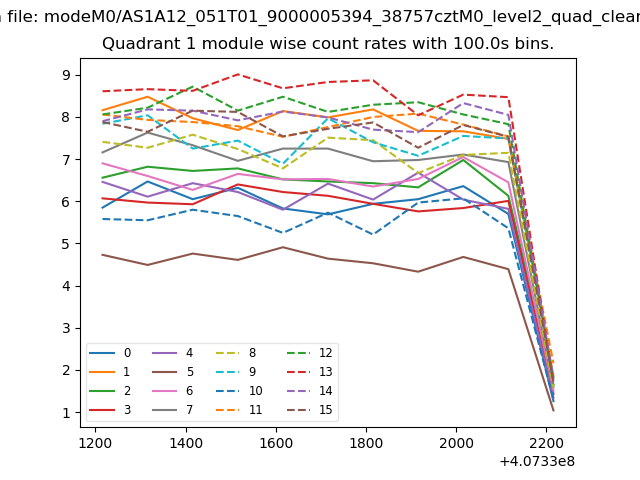
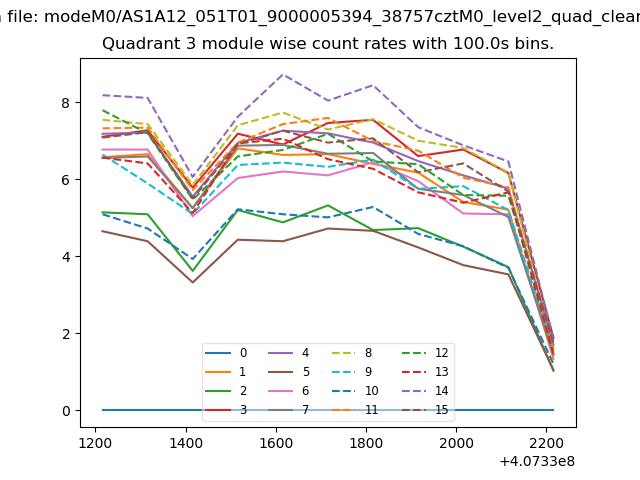
| Module-wise count rates for Quadrant A Data is divided into 100 sec bins |
 |
 |
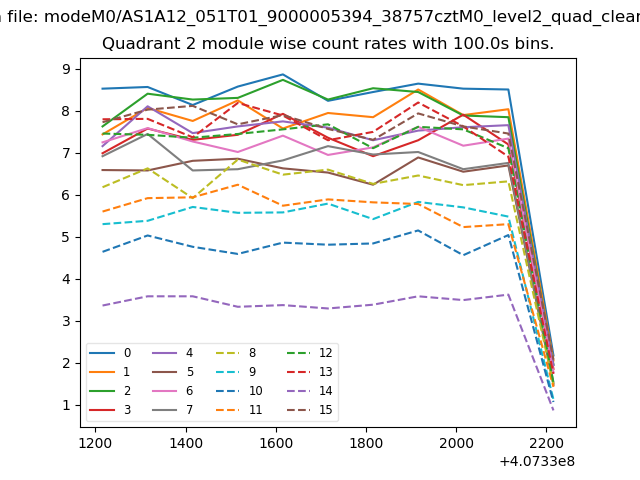
| Module-wise count rates for Quadrant B Data is divided into 100 sec bins |
 |
 |
| Module-wise count rates for Quadrant C Data is divided into 100 sec bins |
 |
 |
| Module-wise count rates for Quadrant D Data is divided into 100 sec bins |
 |
 |
| Parameter | Plot |
|---|---|
| CZT HV Monitor | 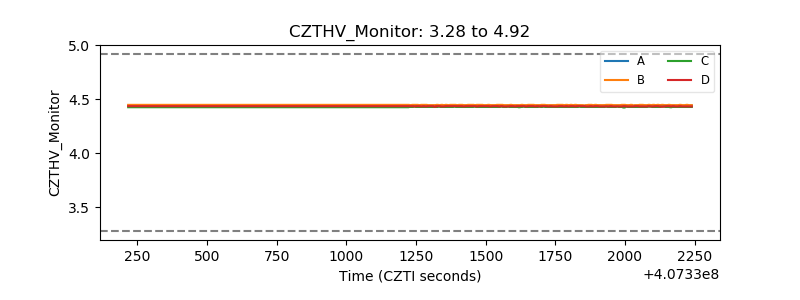 |
| D_VDD | 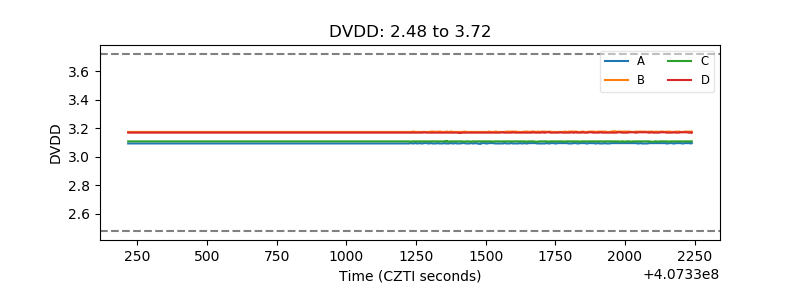 |
| Temperature 1 | 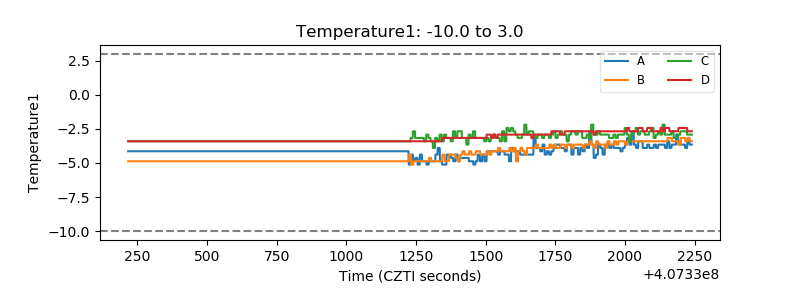 |
| Veto HV Monitor | 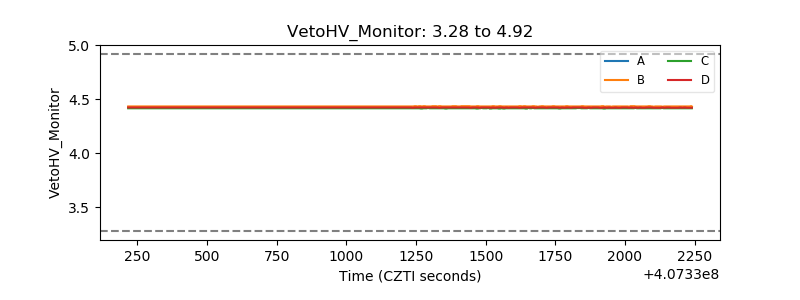 |
| Veto LLD | 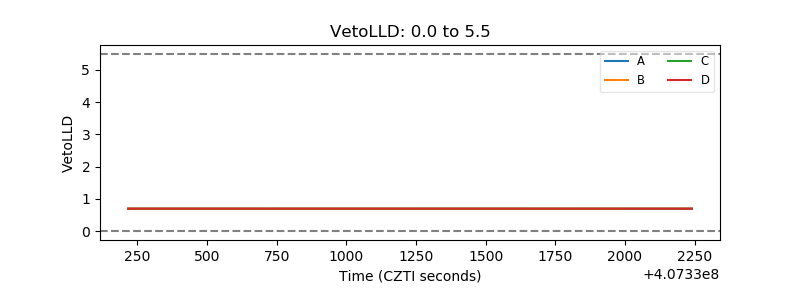 |
| Alpha Counter | 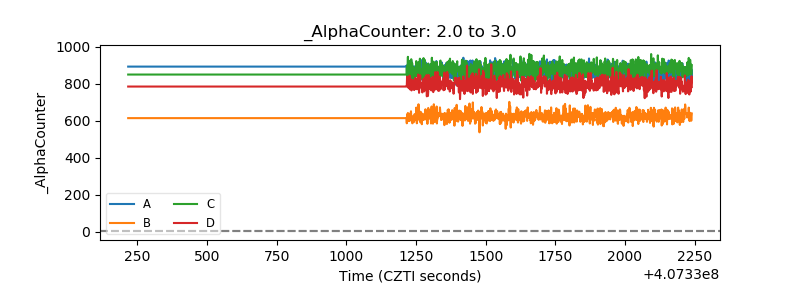 |
| _CPM_Rate | 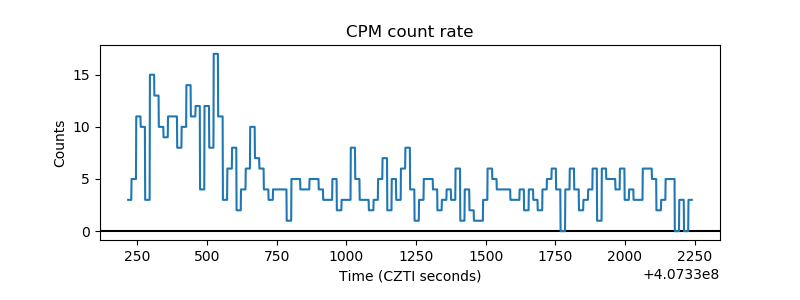 |
| CZT Counter | 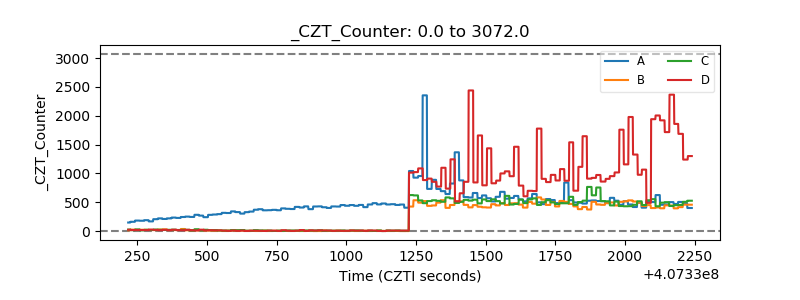 |
| +2.5 Volts monitor | 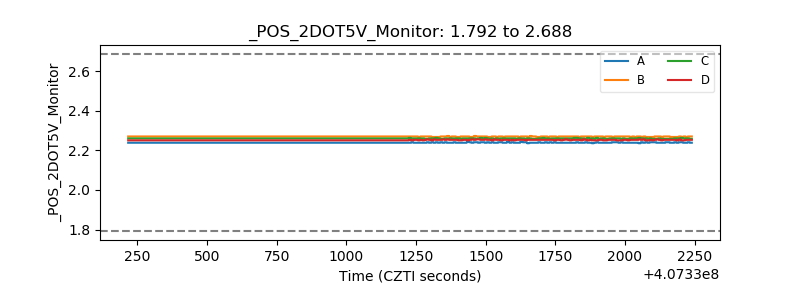 |
| +5 Volts monitor |  |
| _ROLL_ROT | 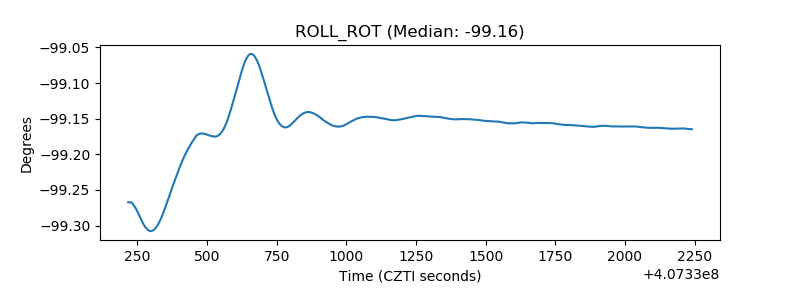 |
| _Roll_DEC | 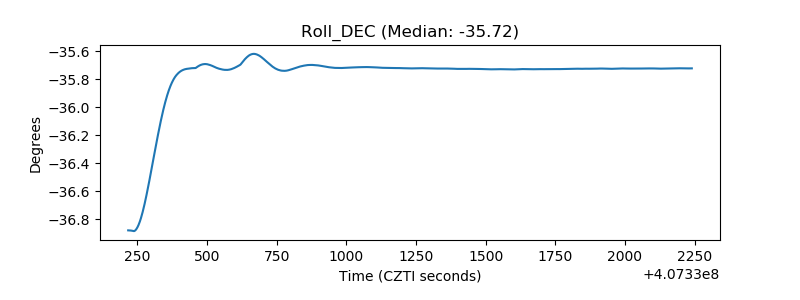 |
| _Roll_RA | 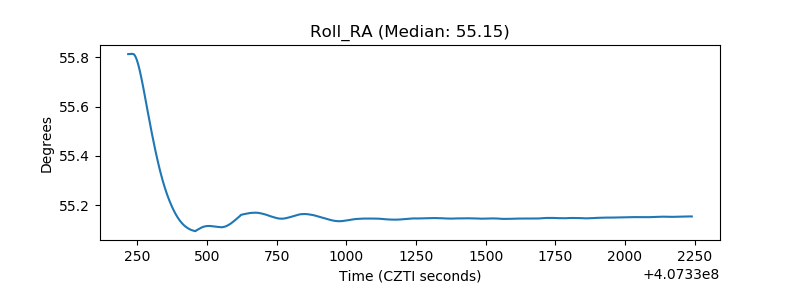 |
| Veto Counter | 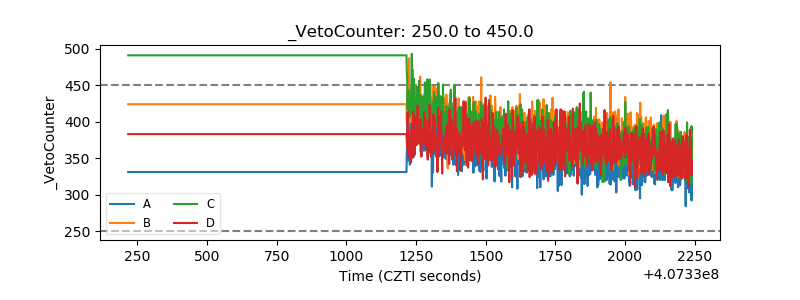 |