| Param | Original file | Final file |
|---|---|---|
| Filename | modeM0/AS1A12_051T01_9000005394_38760cztM0_level2.fits | modeM0/AS1A12_051T01_9000005394_38760cztM0_level2_quad_clean.evt |
| Size (bytes) | 876,571,200 | 211,904,640 |
| Size | 836.0 MB | 202.1 MB |
| Events in quadrant A | 6,585,229 | 1,429,760 |
| Events in quadrant B | 5,804,206 | 1,463,652 |
| Events in quadrant C | 6,120,761 | 1,388,066 |
| Events in quadrant D | 12,917,884 | 1,224,765 |
| Mode SS | |||
|---|---|---|---|
| Quadrant | BADHDUFLAG | Total packets | Discarded packets |
| A | 0 | 266 | 0 |
| B | 0 | 266 | 0 |
| C | 0 | 266 | 0 |
| D | 0 | 266 | 0 |
| Mode M0 | |||
|---|---|---|---|
| Quadrant | BADHDUFLAG | Total packets | Discarded packets |
| A | 0 | 28052 | 3 |
| B | 0 | 26574 | 2 |
| C | 0 | 26890 | 2 |
| D | 0 | 47686 | 2 |
| Mode M9 | |||
|---|---|---|---|
| Quadrant | BADHDUFLAG | Total packets | Discarded packets |
| A | 0 | 38 | 0 |
| B | 0 | 38 | 0 |
| C | 0 | 38 | 0 |
| D | 0 | 38 | 0 |
| Quadrant | Total seconds | Saturated seconds | Saturation percentage |
|---|---|---|---|
| A | 13172 | 40 | 0.303674% |
| B | 13172 | 17 | 0.129062% |
| C | 13172 | 21 | 0.159429% |
| D | 13172 | 956 | 7.257820% |
Noise dominated data is calculated using 1-second bins in cleaned event files. If a bin has >2000 counts, and if more than 50% of those come from <1% of pixels, then it is considered to be noise-dominated and hence unusable.
| Quadrant | # 1 sec bins | Bins with >0 counts | Bins with >2000 counts | High rate bins dominated by noise | Noise dominated (total time) | Noise dominated (detector-on time) | Marked lightcurve |
|---|---|---|---|---|---|---|---|
| A | 15889 | 13174 | 20 | 20 | 0.13% | 0.15% | 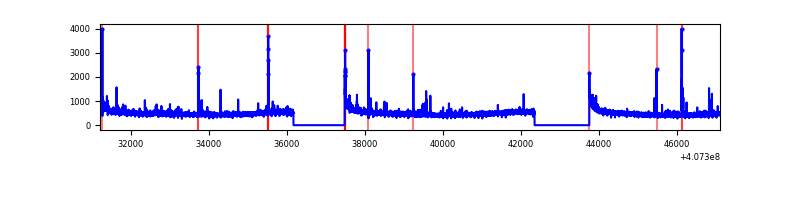 |
| B | 15889 | 13174 | 0 | 0 | 0.00% | 0.00% | 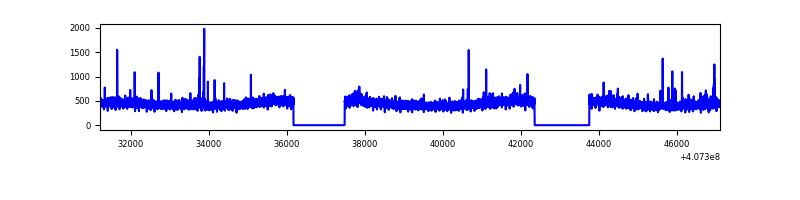 |
| C | 15889 | 13174 | 7 | 7 | 0.04% | 0.05% | 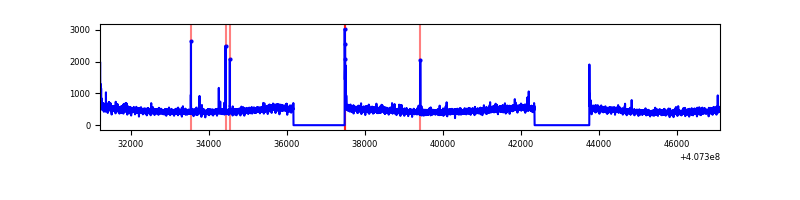 |
| D | 15889 | 13174 | 965 | 965 | 6.07% | 7.33% | 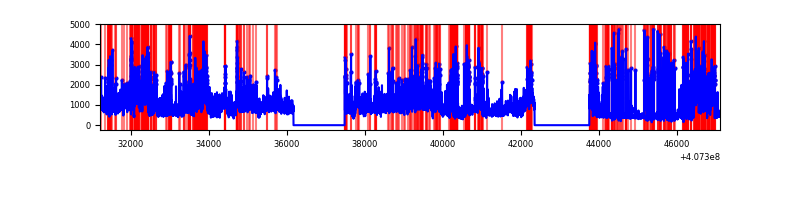 |
Top three noisy pixels from each quadrant. If the there are fewer than three noisy pixels in the level2.evt file, extra rows are filled as -1
| Pixel properties | Quadrant properties | ||||||
|---|---|---|---|---|---|---|---|
| Quadrant | DetID | PixID | Counts | Sigma | Mean | Median | Sigma |
| A | 10 | 83 | 810855 | 2801.61 | 1429 | 1399 | 288.9 |
| A | 9 | 143 | 132496 | 453.74 | 1429 | 1399 | 288.9 |
| A | 7 | 3 | 68059 | 230.72 | 1429 | 1399 | 288.9 |
| B | 5 | 200 | 58729 | 209.18 | 1427 | 1384 | 274.1 |
| B | 4 | 171 | 54387 | 193.34 | 1427 | 1384 | 274.1 |
| B | 12 | 111 | 36374 | 127.63 | 1427 | 1384 | 274.1 |
| C | 15 | 214 | 577020 | 1784.62 | 1386 | 1394 | 322.5 |
| C | 0 | 10 | 65050 | 197.35 | 1386 | 1394 | 322.5 |
| C | 15 | 208 | 48161 | 144.99 | 1386 | 1394 | 322.5 |
| D | 2 | 16 | 4027169 | 12221.09 | 1350 | 1313 | 329.4 |
| D | 5 | 222 | 1866885 | 5663.22 | 1350 | 1313 | 329.4 |
| D | 2 | 250 | 784133 | 2376.37 | 1350 | 1313 | 329.4 |
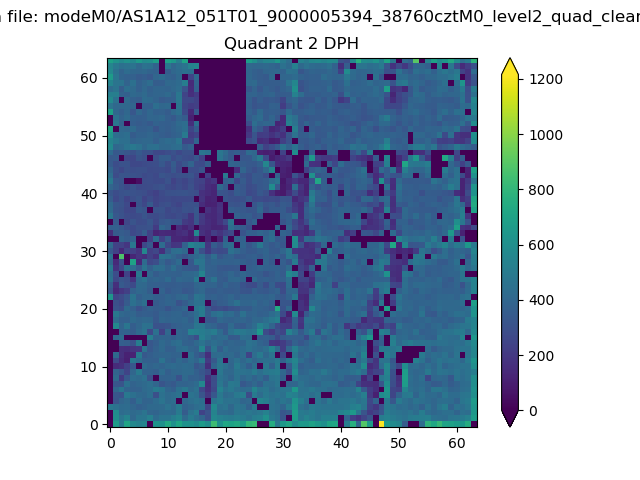
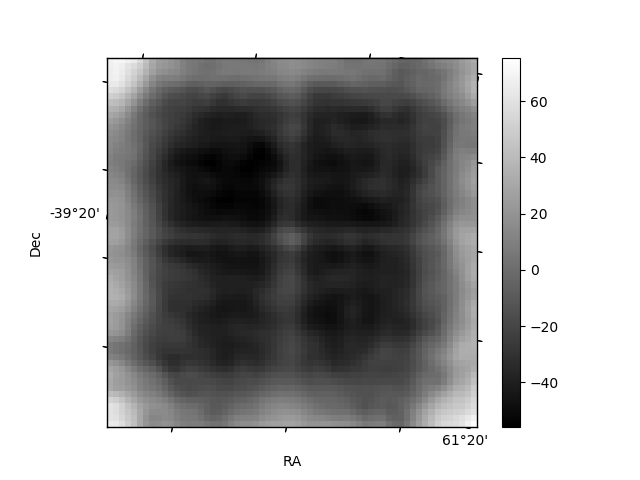
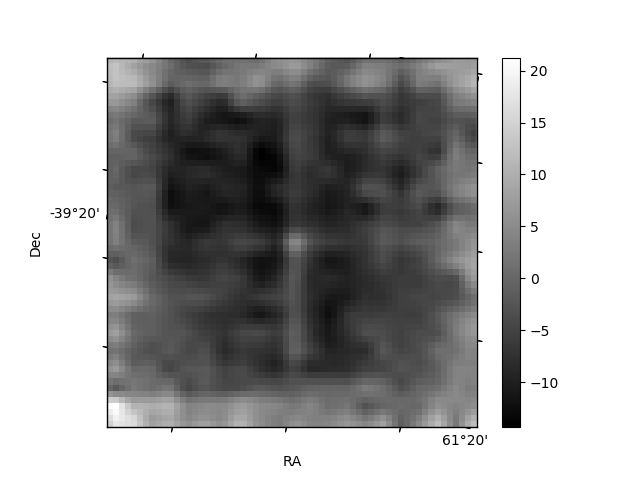
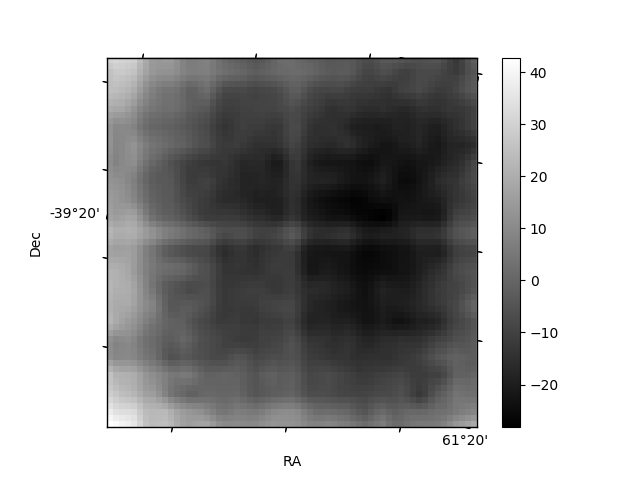
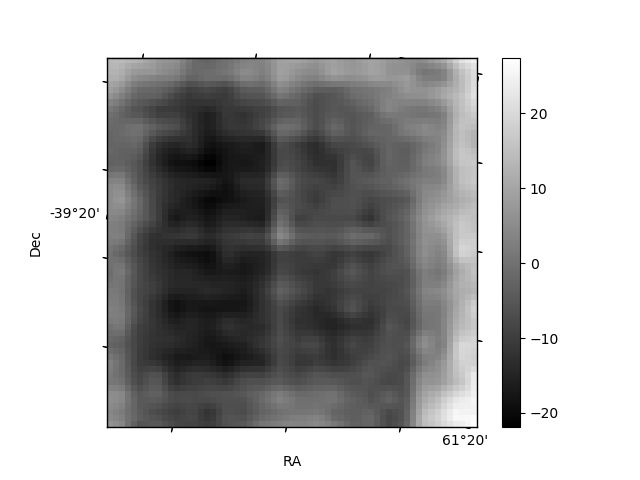
Histogram calculated using DETX and DETY for each event in the final _common_clean file
| Quadrant A | 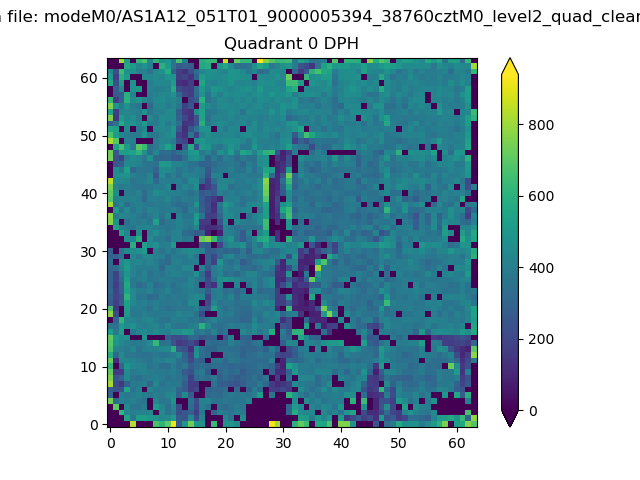 |
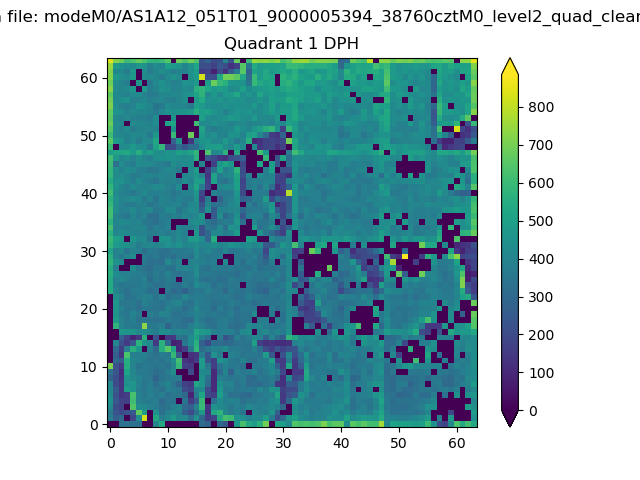 |
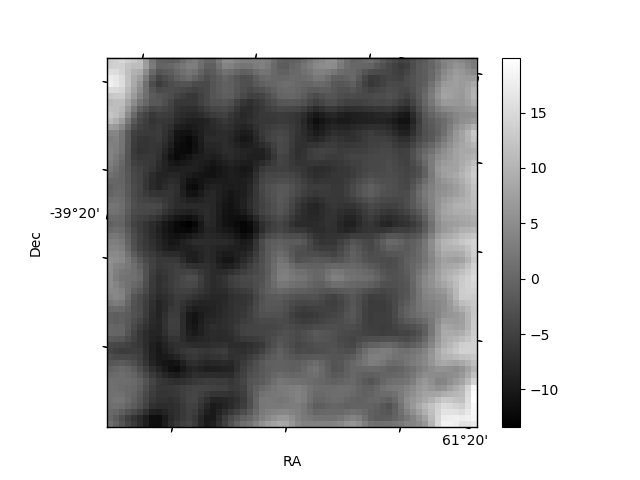
Quadrant B |
|---|---|---|---|
| Quadrant D | 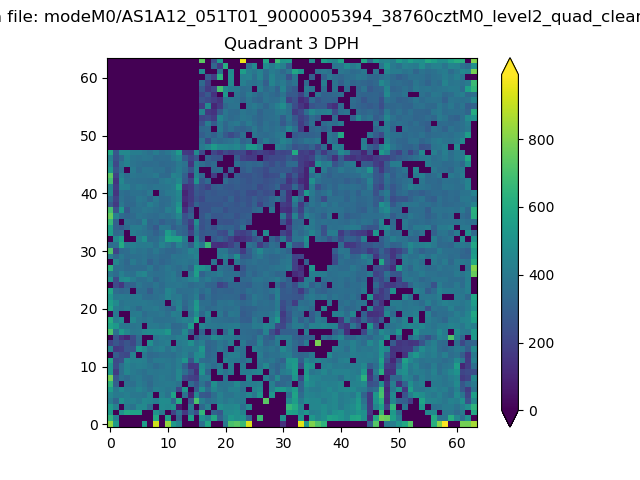 |
 |
Quadrant C |
| Plot type | Count rate plots | Images |
|---|---|---|
| Comparison with Poisson distribution Blue bars denote a histogram of data divided into 1 sec bins. Red curve is a Poisson curve with rate = median count rate of data. |
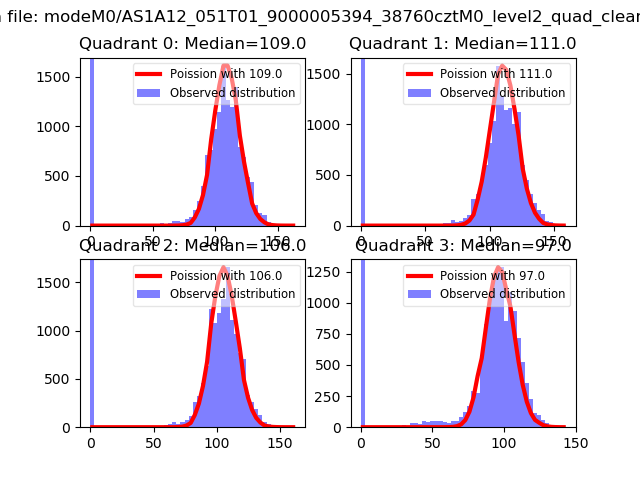 |
 |
| Quadrant-wise count rates Data is divided into 100 sec bins |
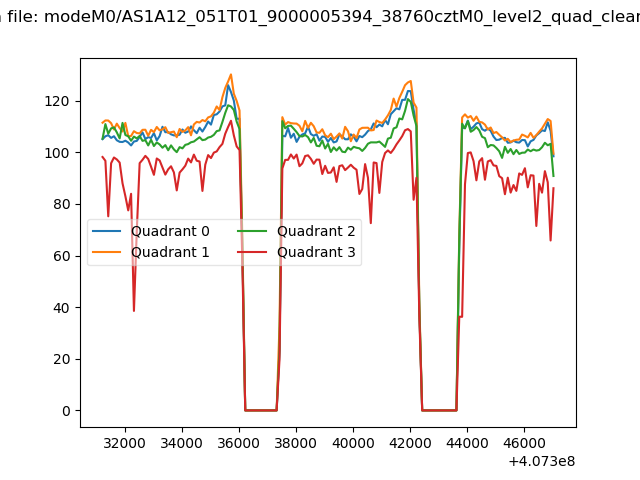 |
|
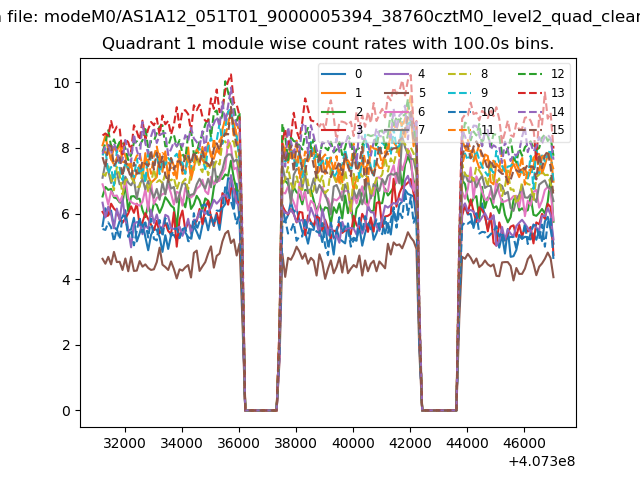
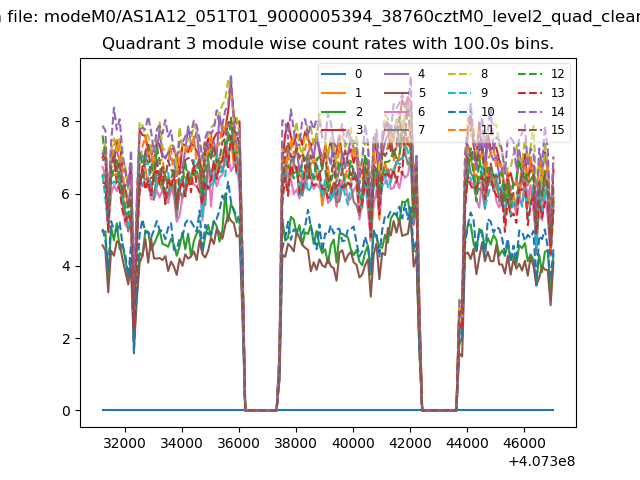
| Module-wise count rates for Quadrant A Data is divided into 100 sec bins |
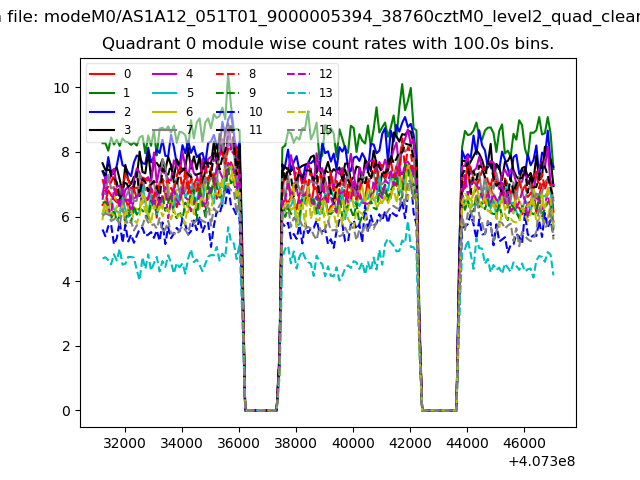 |
 |
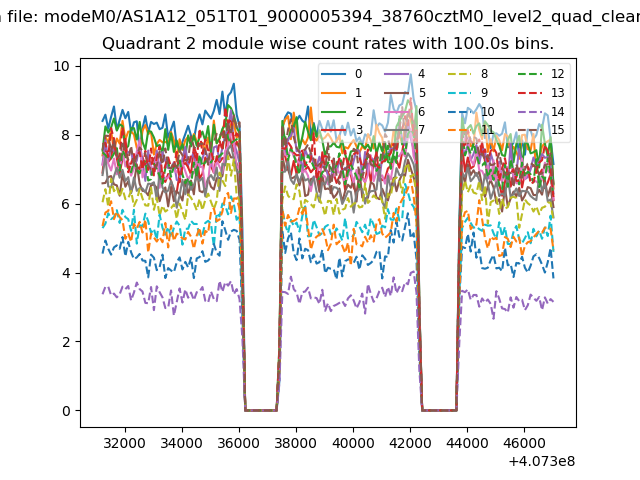
| Module-wise count rates for Quadrant B Data is divided into 100 sec bins |
 |
 |
| Module-wise count rates for Quadrant C Data is divided into 100 sec bins |
 |
 |
| Module-wise count rates for Quadrant D Data is divided into 100 sec bins |
 |
 |
| Parameter | Plot |
|---|---|
| CZT HV Monitor | 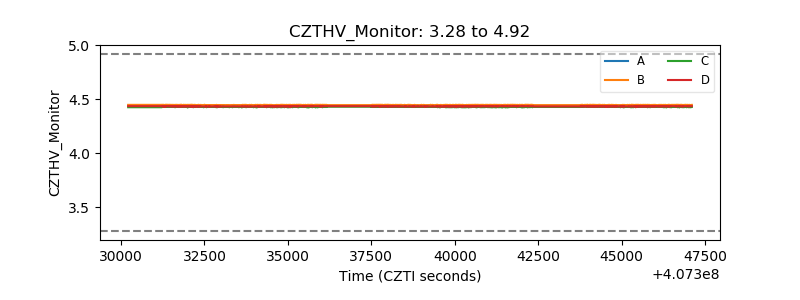 |
| D_VDD | 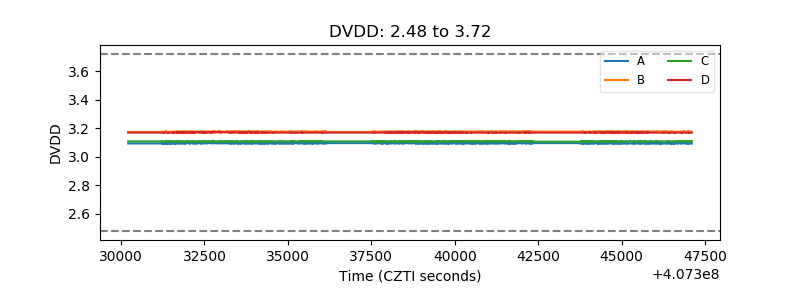 |
| Temperature 1 | 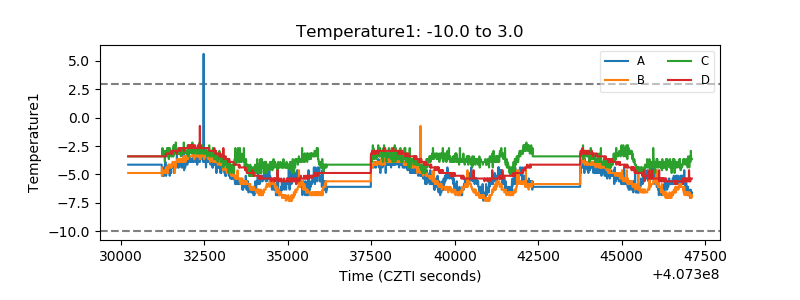 |
| Veto HV Monitor | 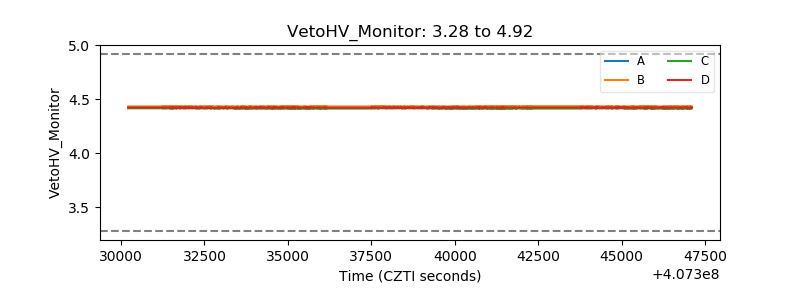 |
| Veto LLD | 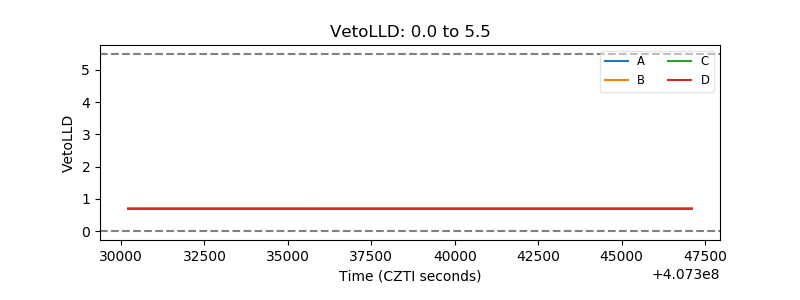 |
| Alpha Counter | 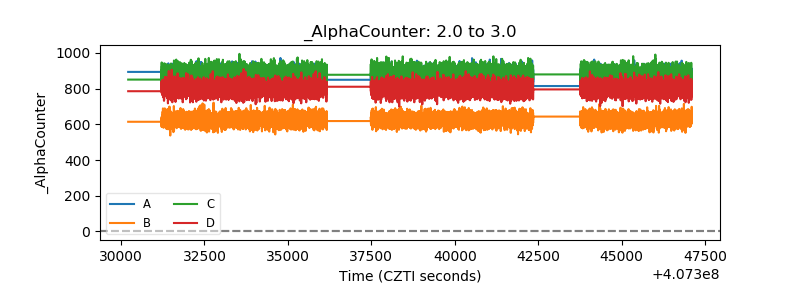 |
| _CPM_Rate | 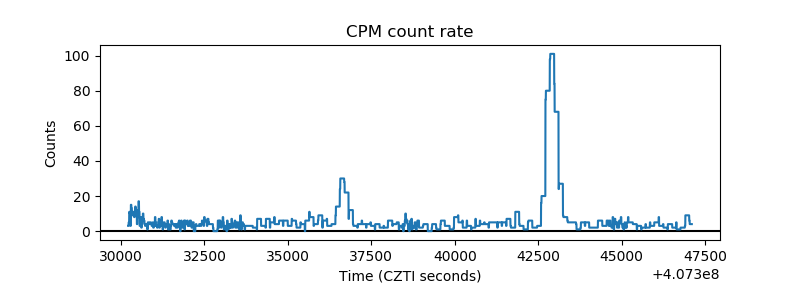 |
| CZT Counter | 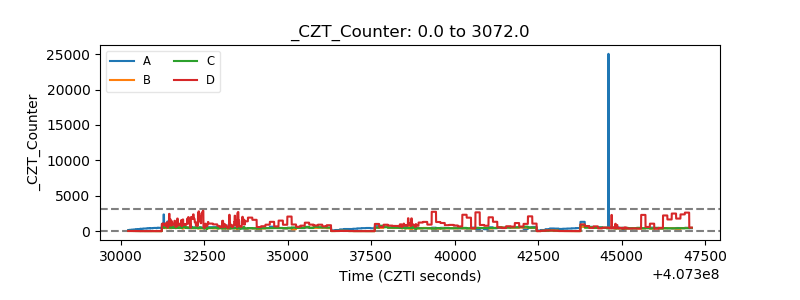 |
| +2.5 Volts monitor | 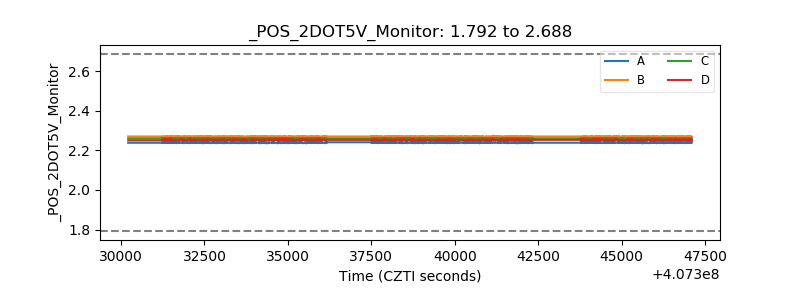 |
| +5 Volts monitor | 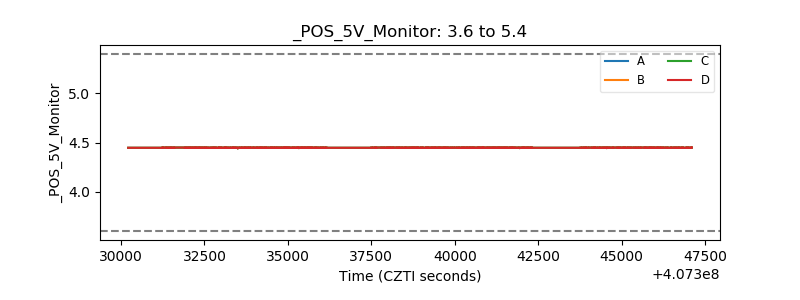 |
| _ROLL_ROT | 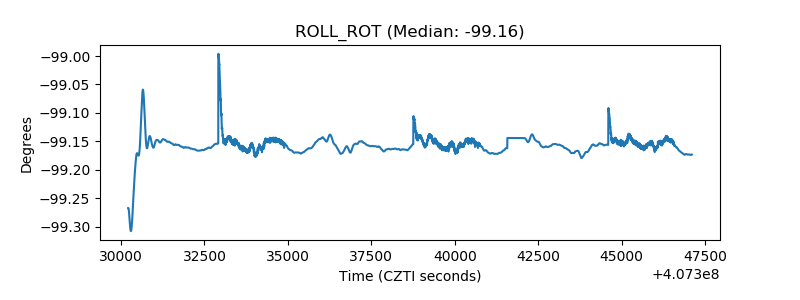 |
| _Roll_DEC | 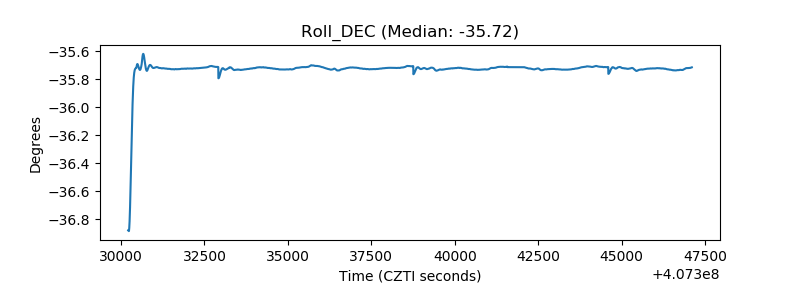 |
| _Roll_RA | 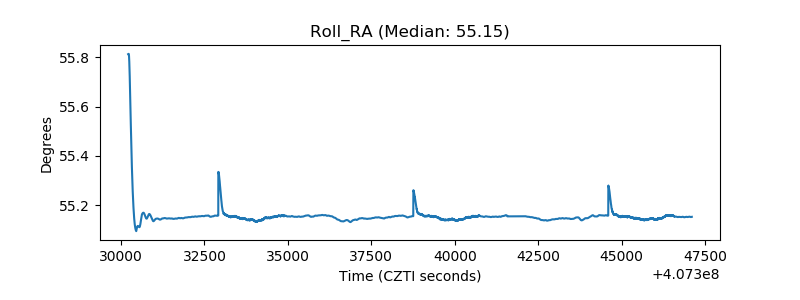 |
| Veto Counter | 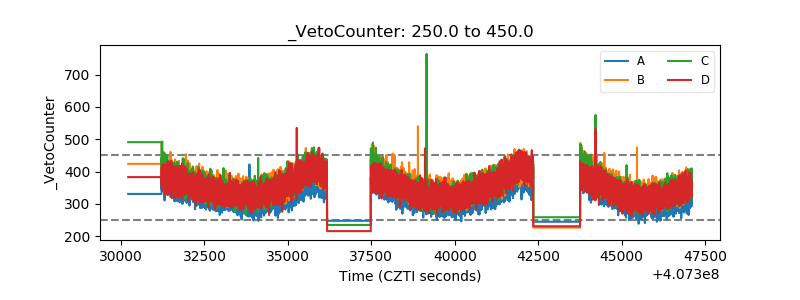 |