| Param | Original file | Final file |
|---|---|---|
| Filename | modeM0/AS1A12_051T01_9000005394_38761cztM0_level2.fits | modeM0/AS1A12_051T01_9000005394_38761cztM0_level2_quad_clean.evt |
| Size (bytes) | 477,976,320 | 130,489,920 |
| Size | 455.8 MB | 124.4 MB |
| Events in quadrant A | 4,091,856 | 879,387 |
| Events in quadrant B | 3,695,543 | 909,525 |
| Events in quadrant C | 3,913,872 | 845,927 |
| Events in quadrant D | 5,383,798 | 772,301 |
| Mode SS | |||
|---|---|---|---|
| Quadrant | BADHDUFLAG | Total packets | Discarded packets |
| A | 0 | 160 | 0 |
| B | 0 | 160 | 0 |
| C | 0 | 160 | 0 |
| D | 0 | 160 | 0 |
| Mode M0 | |||
|---|---|---|---|
| Quadrant | BADHDUFLAG | Total packets | Discarded packets |
| A | 0 | 17192 | 3 |
| B | 0 | 16241 | 2 |
| C | 0 | 16602 | 2 |
| D | 0 | 21269 | 2 |
| Mode M9 | |||
|---|---|---|---|
| Quadrant | BADHDUFLAG | Total packets | Discarded packets |
| A | 0 | 32 | 0 |
| B | 0 | 32 | 0 |
| C | 0 | 32 | 0 |
| D | 0 | 32 | 0 |
| Quadrant | Total seconds | Saturated seconds | Saturation percentage |
|---|---|---|---|
| A | 7827 | 66 | 0.843235% |
| B | 7827 | 16 | 0.204421% |
| C | 7827 | 42 | 0.536604% |
| D | 7827 | 284 | 3.628466% |
Noise dominated data is calculated using 1-second bins in cleaned event files. If a bin has >2000 counts, and if more than 50% of those come from <1% of pixels, then it is considered to be noise-dominated and hence unusable.
| Quadrant | # 1 sec bins | Bins with >0 counts | Bins with >2000 counts | High rate bins dominated by noise | Noise dominated (total time) | Noise dominated (detector-on time) | Marked lightcurve |
|---|---|---|---|---|---|---|---|
| A | 10993 | 7829 | 39 | 39 | 0.35% | 0.50% | 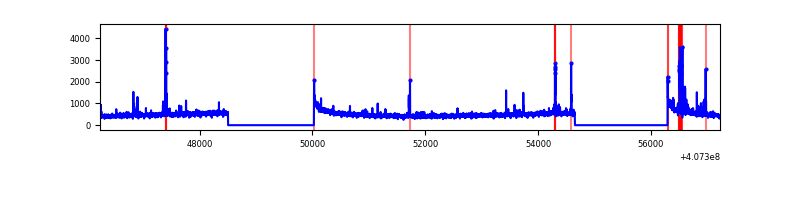 |
| B | 10993 | 7829 | 3 | 3 | 0.03% | 0.04% | 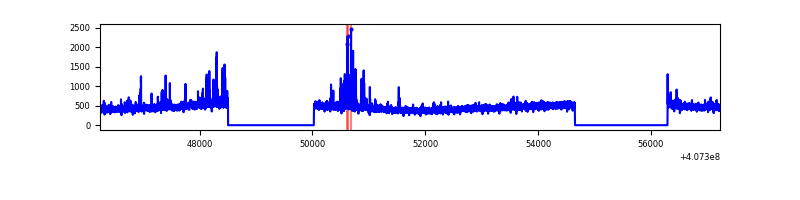 |
| C | 10993 | 7829 | 36 | 36 | 0.33% | 0.46% | 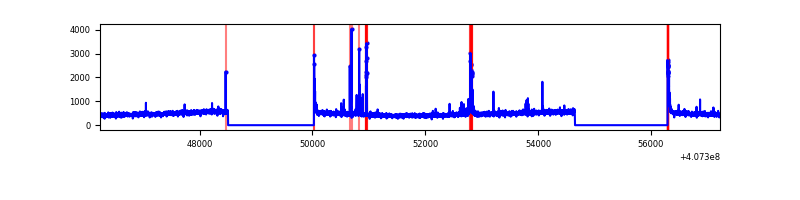 |
| D | 10993 | 7829 | 289 | 289 | 2.63% | 3.69% | 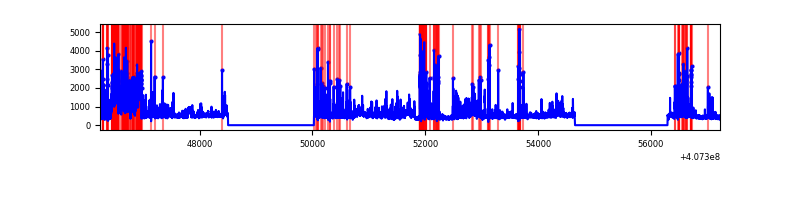 |
Top three noisy pixels from each quadrant. If the there are fewer than three noisy pixels in the level2.evt file, extra rows are filled as -1
| Pixel properties | Quadrant properties | ||||||
|---|---|---|---|---|---|---|---|
| Quadrant | DetID | PixID | Counts | Sigma | Mean | Median | Sigma |
| A | 10 | 83 | 494300 | 2814.92 | 868 | 853 | 175.3 |
| A | 9 | 143 | 95607 | 540.53 | 868 | 853 | 175.3 |
| A | 13 | 248 | 74679 | 421.15 | 868 | 853 | 175.3 |
| B | 5 | 200 | 160558 | 934.25 | 871 | 845 | 171.0 |
| B | 4 | 171 | 57056 | 328.81 | 871 | 845 | 171.0 |
| B | 0 | 190 | 38785 | 221.93 | 871 | 845 | 171.0 |
| C | 15 | 214 | 342980 | 1703.15 | 852 | 858 | 200.9 |
| C | 0 | 10 | 83289 | 410.36 | 852 | 858 | 200.9 |
| C | 14 | 254 | 68052 | 334.51 | 852 | 858 | 200.9 |
| D | 2 | 250 | 940209 | 4629.21 | 836 | 814 | 202.9 |
| D | 2 | 16 | 817258 | 4023.32 | 836 | 814 | 202.9 |
| D | 13 | 249 | 174427 | 855.54 | 836 | 814 | 202.9 |
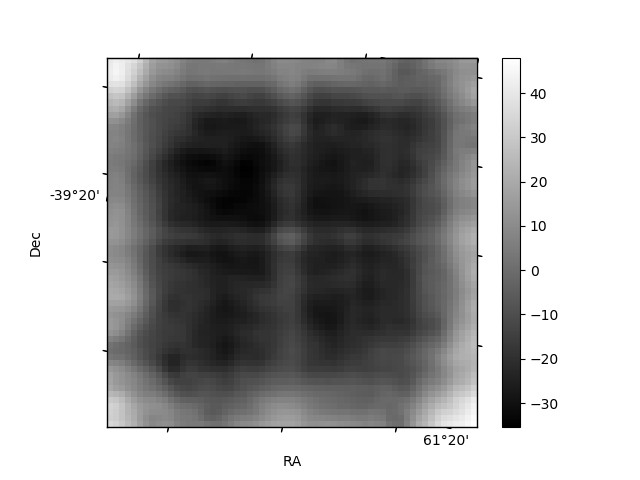
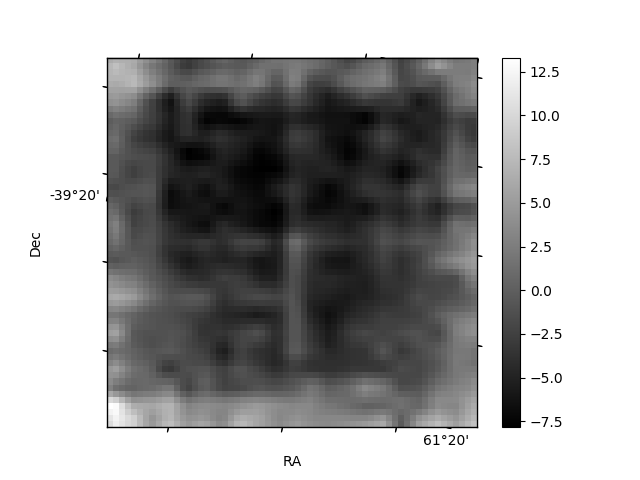
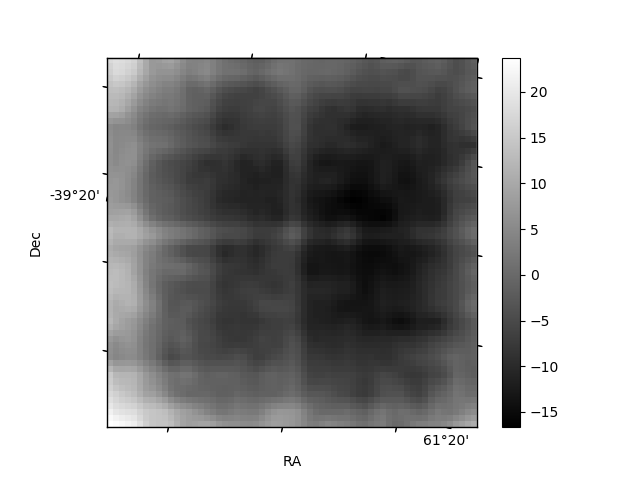
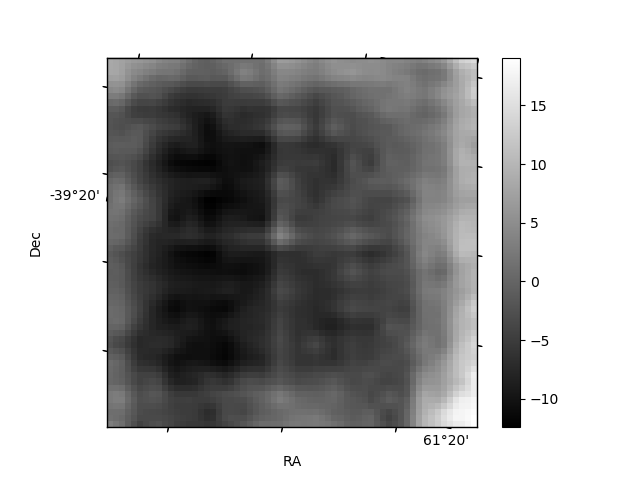
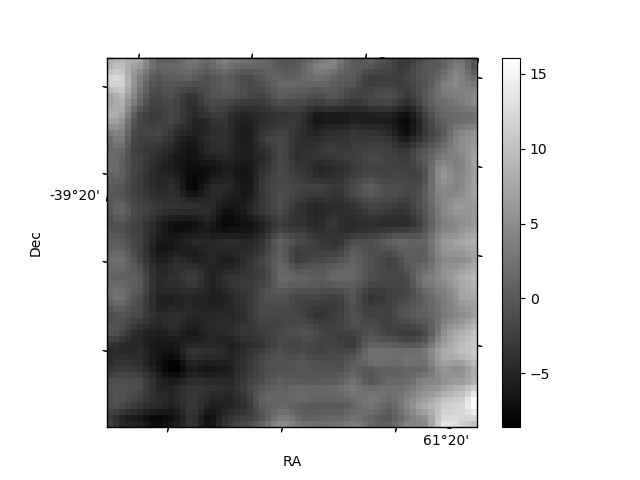
Histogram calculated using DETX and DETY for each event in the final _common_clean file
| Quadrant A | 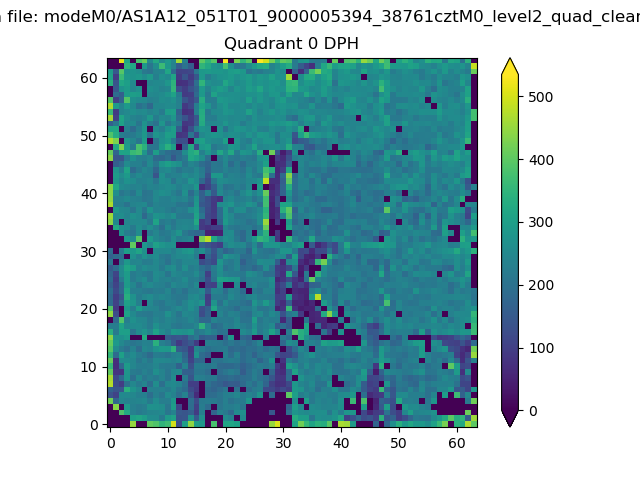 |
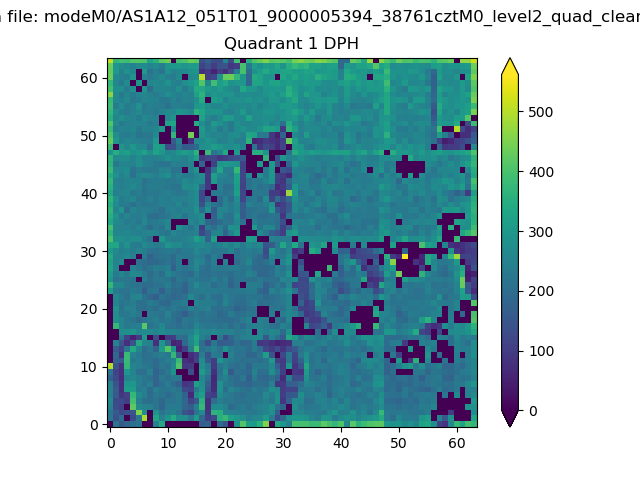 |
Quadrant B |
|---|---|---|---|
| Quadrant D | 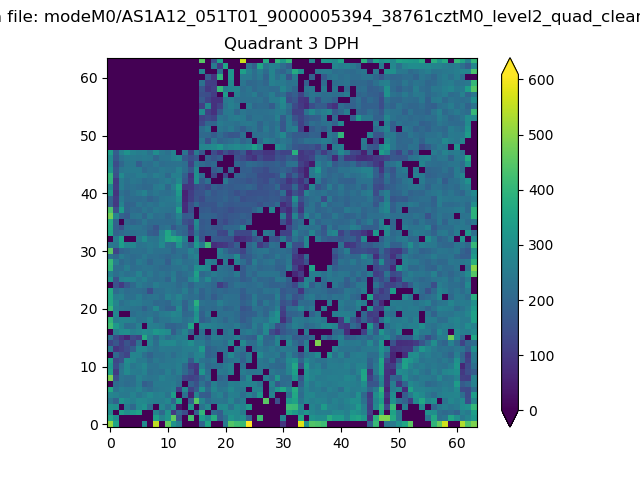 |
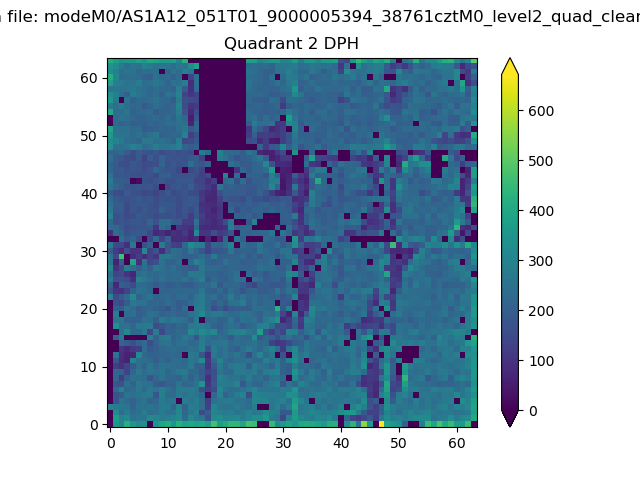 |
Quadrant C |
| Plot type | Count rate plots | Images |
|---|---|---|
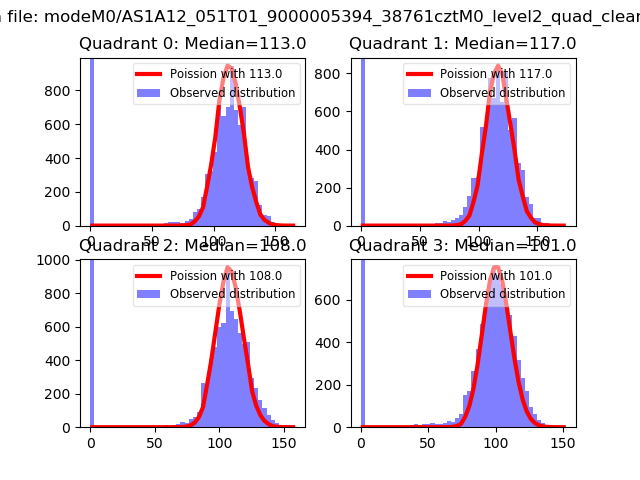
| Comparison with Poisson distribution Blue bars denote a histogram of data divided into 1 sec bins. Red curve is a Poisson curve with rate = median count rate of data. |
 |
 |
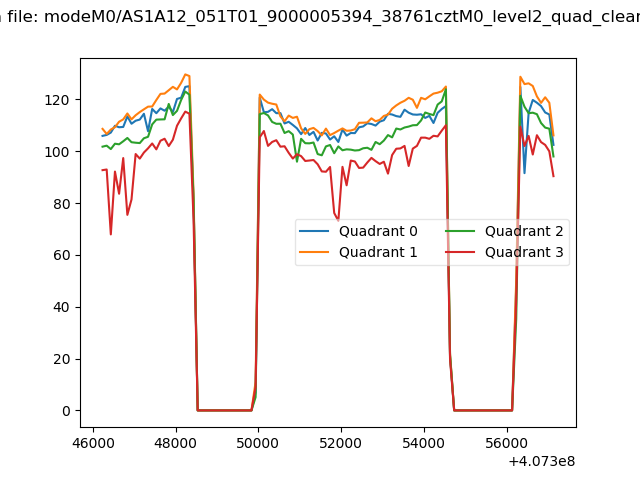
| Quadrant-wise count rates Data is divided into 100 sec bins |
 |
|
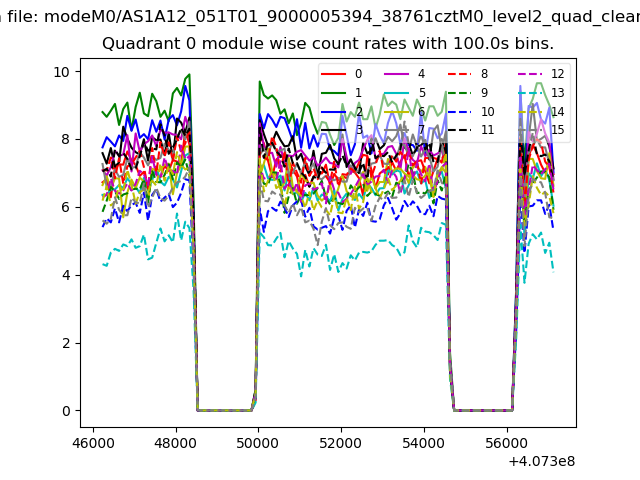
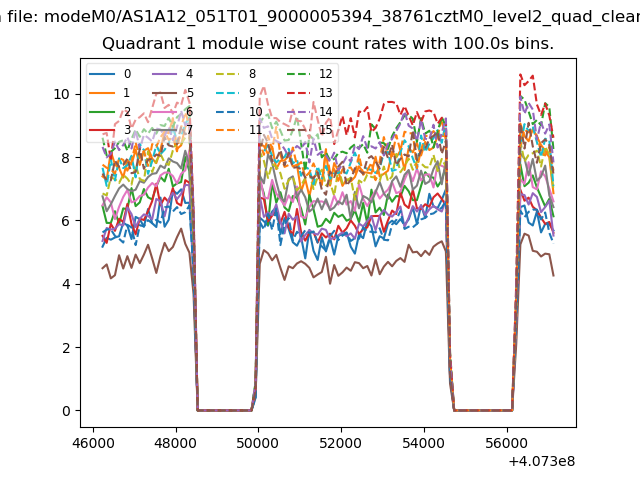
| Module-wise count rates for Quadrant A Data is divided into 100 sec bins |
 |
 |
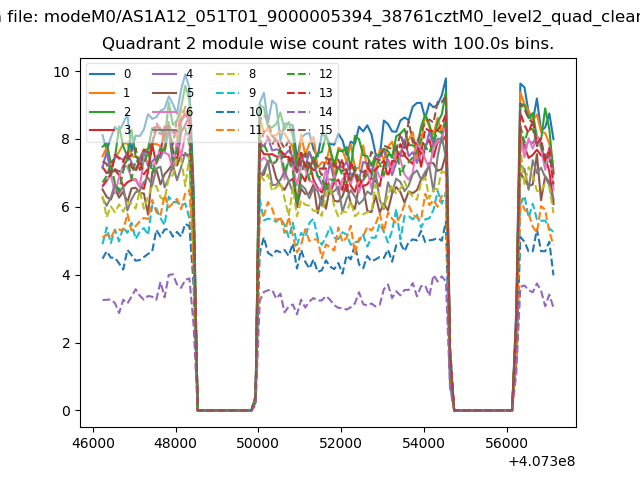
| Module-wise count rates for Quadrant B Data is divided into 100 sec bins |
 |
 |
| Module-wise count rates for Quadrant C Data is divided into 100 sec bins |
 |
 |
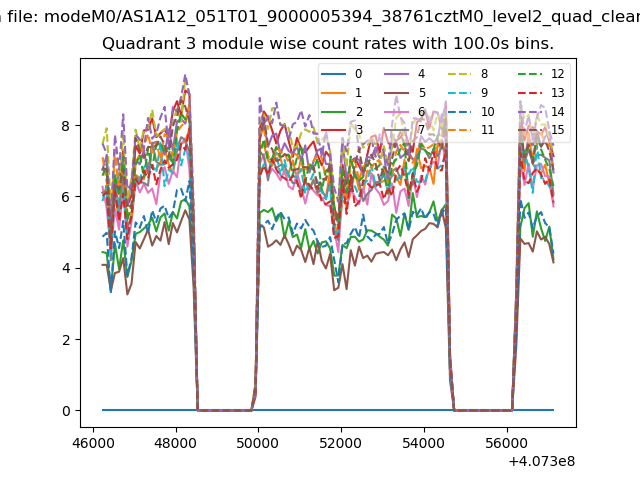
| Module-wise count rates for Quadrant D Data is divided into 100 sec bins |
 |
 |
| Parameter | Plot |
|---|---|
| CZT HV Monitor | 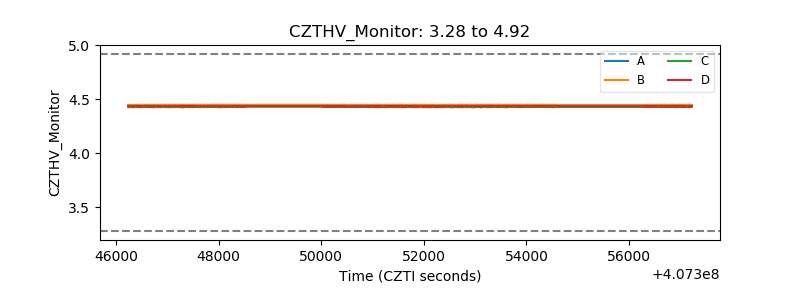 |
| D_VDD | 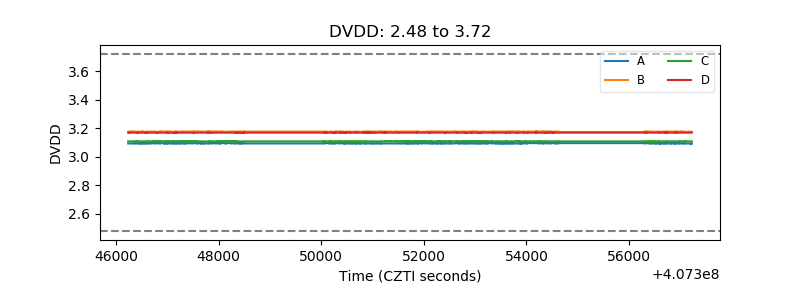 |
| Temperature 1 | 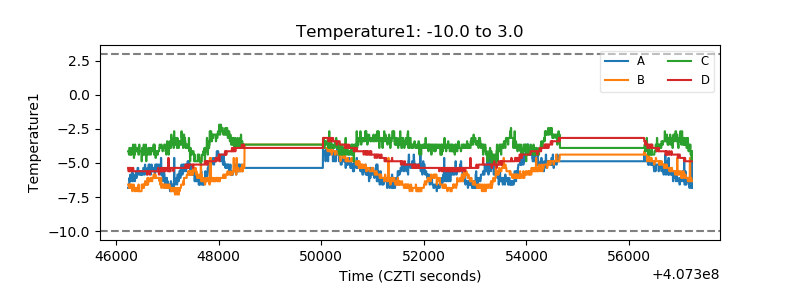 |
| Veto HV Monitor | 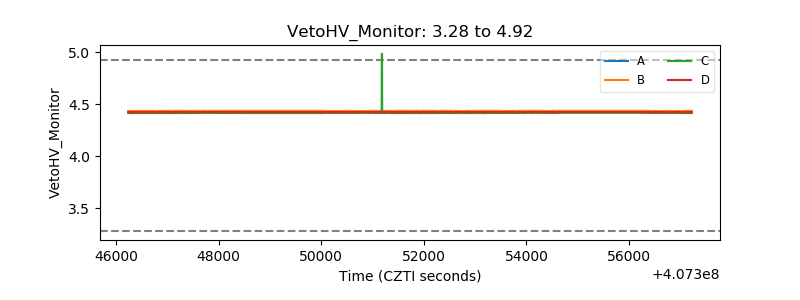 |
| Veto LLD | 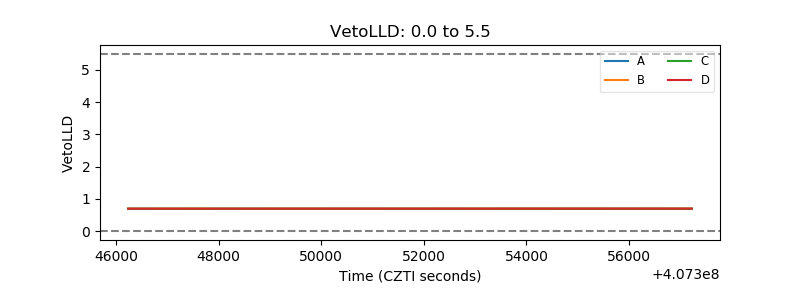 |
| Alpha Counter | 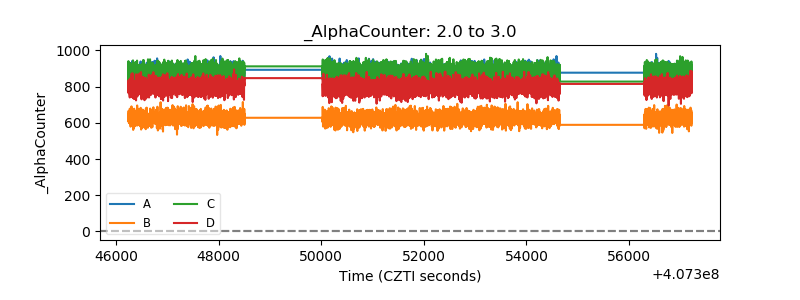 |
| _CPM_Rate | 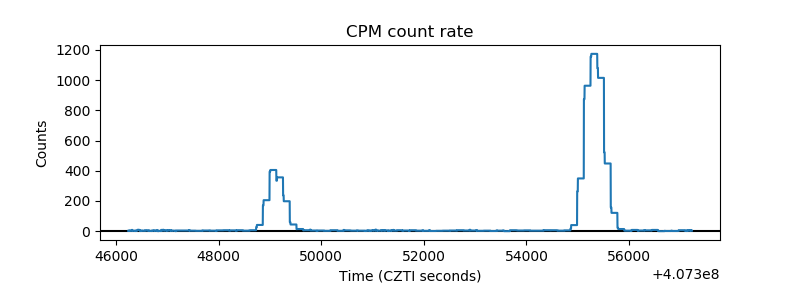 |
| CZT Counter | 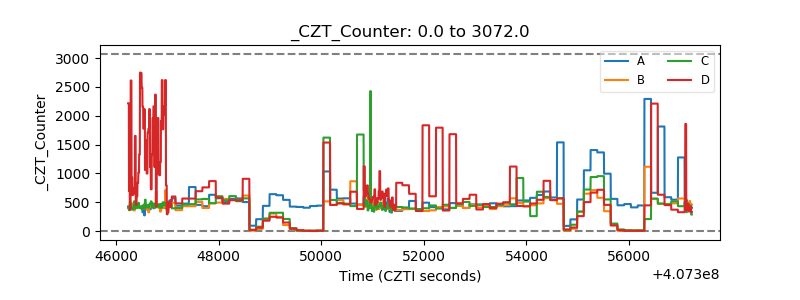 |
| +2.5 Volts monitor | 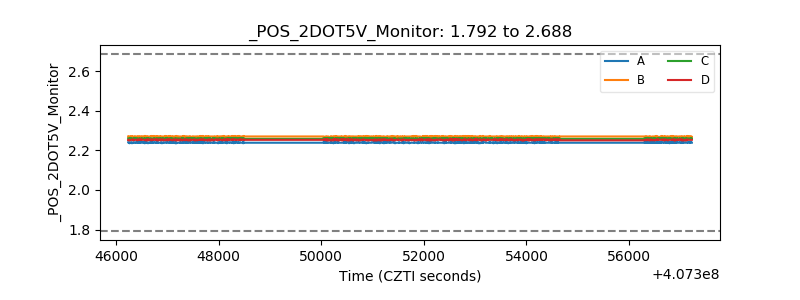 |
| +5 Volts monitor | 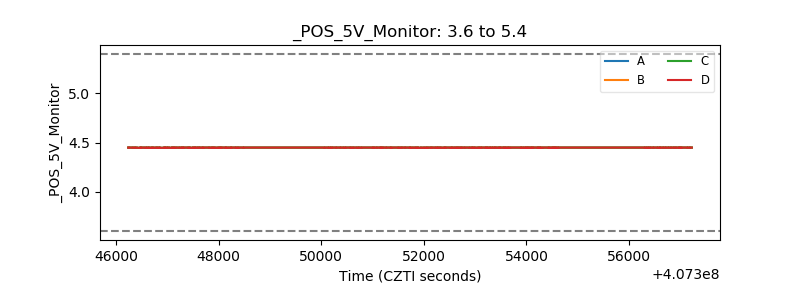 |
| _ROLL_ROT | 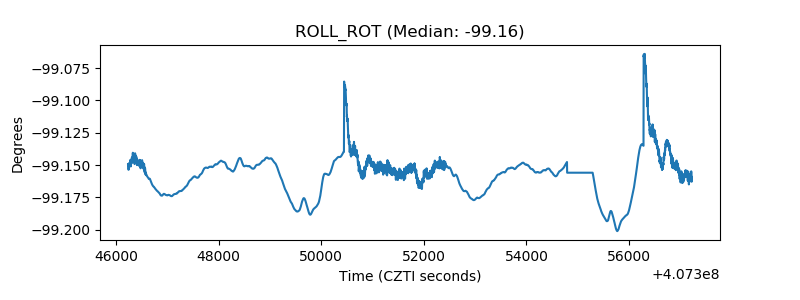 |
| _Roll_DEC | 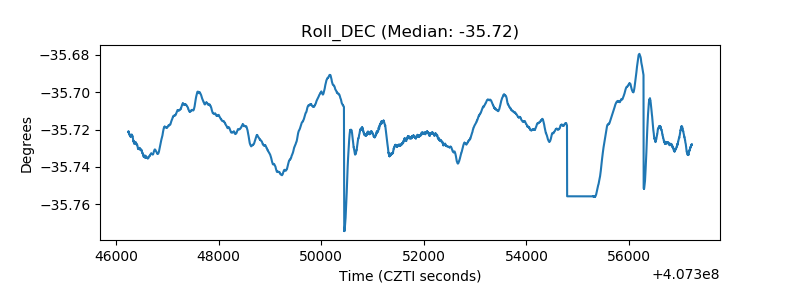 |
| _Roll_RA | 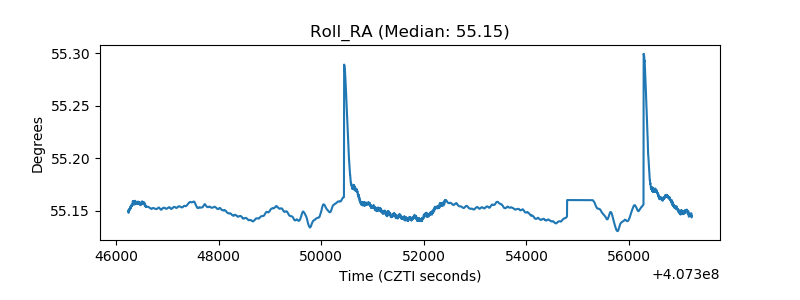 |
| Veto Counter | 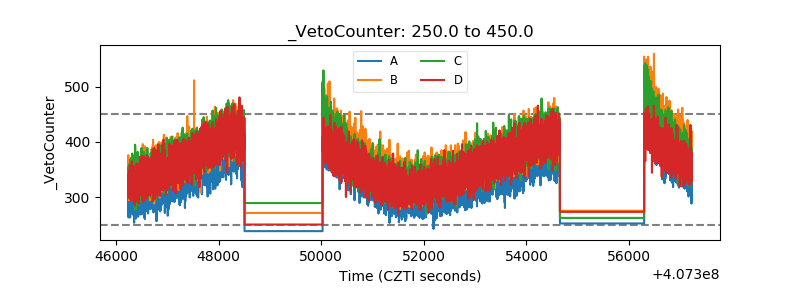 |