| Param | Original file | Final file |
|---|---|---|
| Filename | modeM0/AS1A12_051T01_9000005394_38764cztM0_level2.fits | modeM0/AS1A12_051T01_9000005394_38764cztM0_level2_quad_clean.evt |
| Size (bytes) | 371,401,920 | 92,352,960 |
| Size | 354.2 MB | 88.1 MB |
| Events in quadrant A | 2,801,018 | 633,816 |
| Events in quadrant B | 2,492,170 | 659,395 |
| Events in quadrant C | 2,760,878 | 610,749 |
| Events in quadrant D | 5,286,278 | 525,331 |
| Mode SS | |||
|---|---|---|---|
| Quadrant | BADHDUFLAG | Total packets | Discarded packets |
| A | 0 | 108 | 0 |
| B | 0 | 108 | 0 |
| C | 0 | 108 | 0 |
| D | 0 | 108 | 0 |
| Mode M0 | |||
|---|---|---|---|
| Quadrant | BADHDUFLAG | Total packets | Discarded packets |
| A | 0 | 11513 | 3 |
| B | 0 | 10786 | 2 |
| C | 0 | 11287 | 2 |
| D | 0 | 19351 | 2 |
| Mode M9 | |||
|---|---|---|---|
| Quadrant | BADHDUFLAG | Total packets | Discarded packets |
| A | 0 | 33 | 0 |
| B | 0 | 33 | 0 |
| C | 0 | 33 | 0 |
| D | 0 | 34 | 0 |
| Quadrant | Total seconds | Saturated seconds | Saturation percentage |
|---|---|---|---|
| A | 5240 | 19 | 0.362595% |
| B | 5240 | 21 | 0.400763% |
| C | 5240 | 24 | 0.458015% |
| D | 5240 | 494 | 9.427481% |
Noise dominated data is calculated using 1-second bins in cleaned event files. If a bin has >2000 counts, and if more than 50% of those come from <1% of pixels, then it is considered to be noise-dominated and hence unusable.
| Quadrant | # 1 sec bins | Bins with >0 counts | Bins with >2000 counts | High rate bins dominated by noise | Noise dominated (total time) | Noise dominated (detector-on time) | Marked lightcurve |
|---|---|---|---|---|---|---|---|
| A | 7153 | 5241 | 13 | 13 | 0.18% | 0.25% | 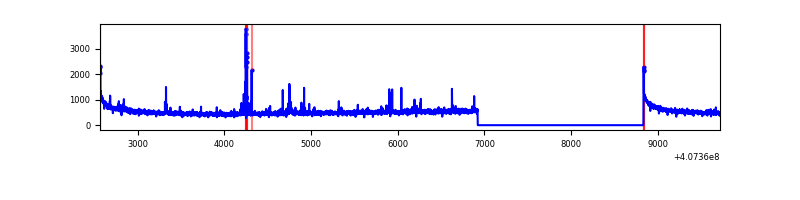 |
| B | 7153 | 5241 | 12 | 12 | 0.17% | 0.23% | 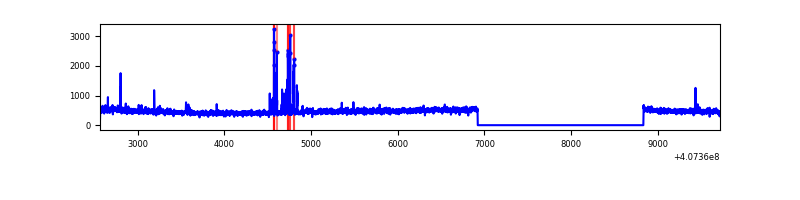 |
| C | 7153 | 5241 | 15 | 15 | 0.21% | 0.29% | 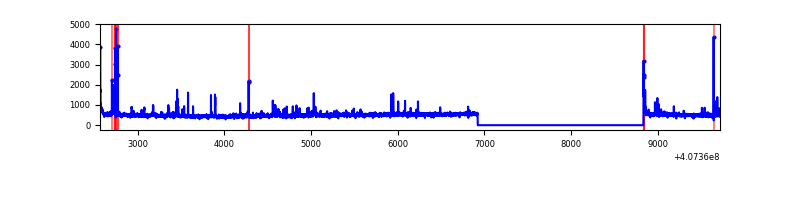 |
| D | 7153 | 5241 | 541 | 541 | 7.56% | 10.32% | 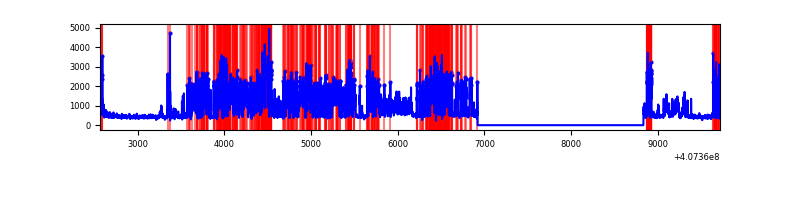 |
Top three noisy pixels from each quadrant. If the there are fewer than three noisy pixels in the level2.evt file, extra rows are filled as -1
| Pixel properties | Quadrant properties | ||||||
|---|---|---|---|---|---|---|---|
| Quadrant | DetID | PixID | Counts | Sigma | Mean | Median | Sigma |
| A | 10 | 83 | 385097 | 3178.39 | 595 | 584 | 121.0 |
| A | 13 | 248 | 106959 | 879.3 | 595 | 584 | 121.0 |
| A | 13 | 254 | 7715 | 58.94 | 595 | 584 | 121.0 |
| B | 4 | 171 | 95290 | 816.66 | 600 | 584 | 116.0 |
| B | 0 | 190 | 14360 | 118.79 | 600 | 584 | 116.0 |
| B | 12 | 111 | 14327 | 118.51 | 600 | 584 | 116.0 |
| C | 15 | 214 | 233299 | 1690.48 | 587 | 592 | 137.7 |
| C | 15 | 208 | 114346 | 826.35 | 587 | 592 | 137.7 |
| C | 14 | 254 | 54893 | 394.46 | 587 | 592 | 137.7 |
| D | 2 | 16 | 2713752 | 19971.42 | 559 | 543 | 135.9 |
| D | 5 | 222 | 232288 | 1705.83 | 559 | 543 | 135.9 |
| D | 10 | 118 | 173937 | 1276.32 | 559 | 543 | 135.9 |
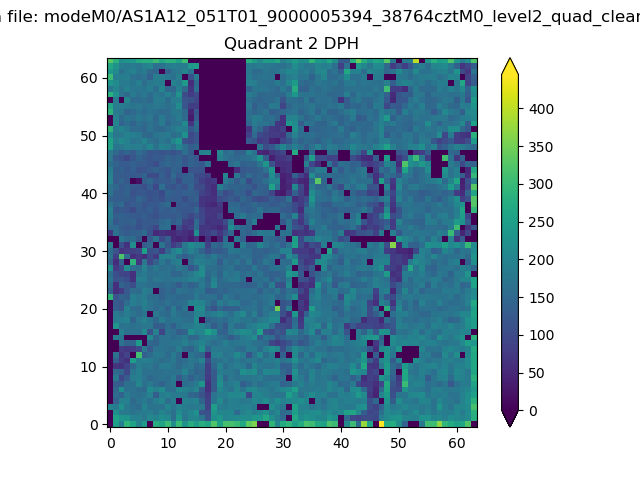
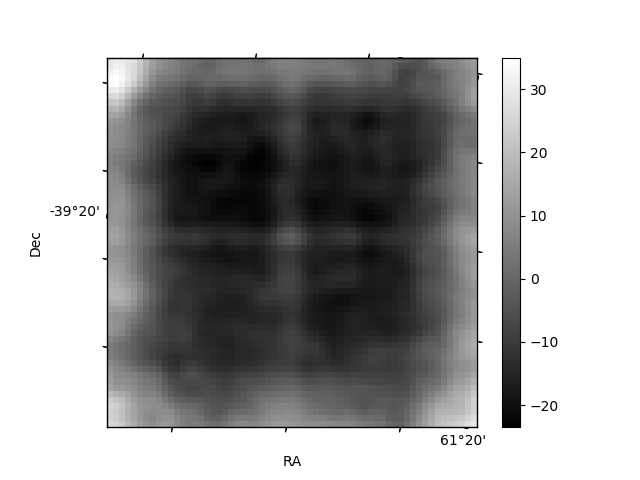
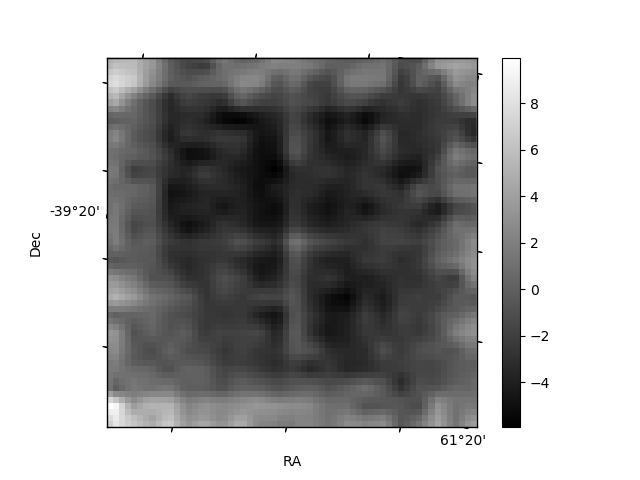
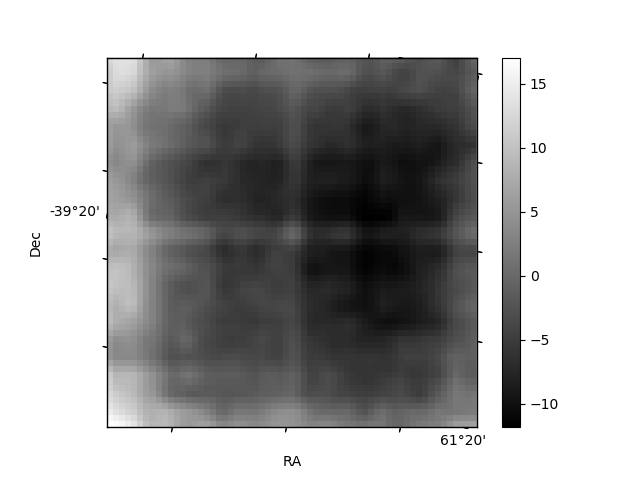
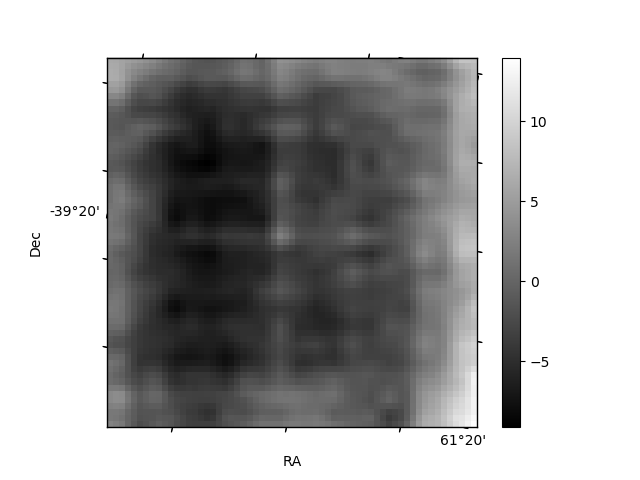
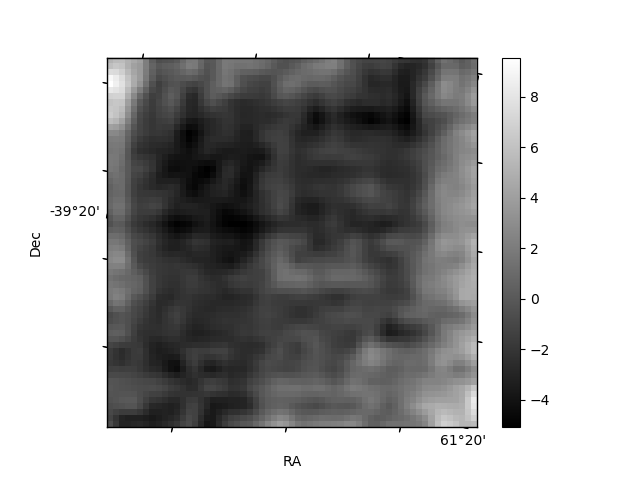
Histogram calculated using DETX and DETY for each event in the final _common_clean file
| Quadrant A | 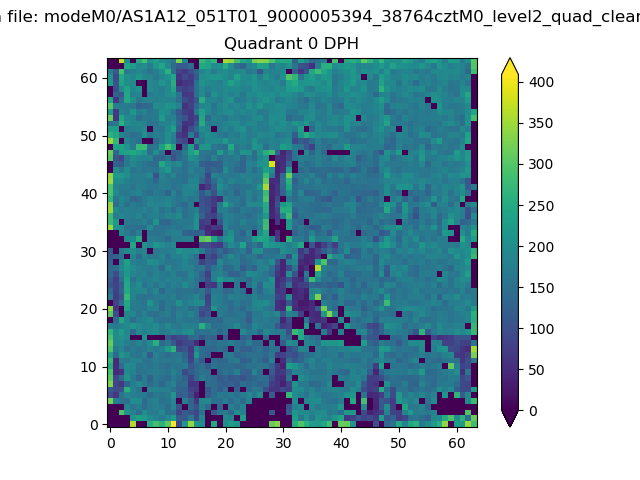 |
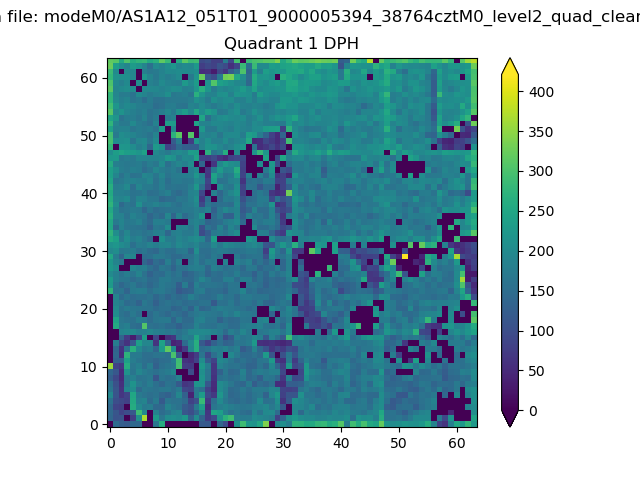 |
Quadrant B |
|---|---|---|---|
| Quadrant D | 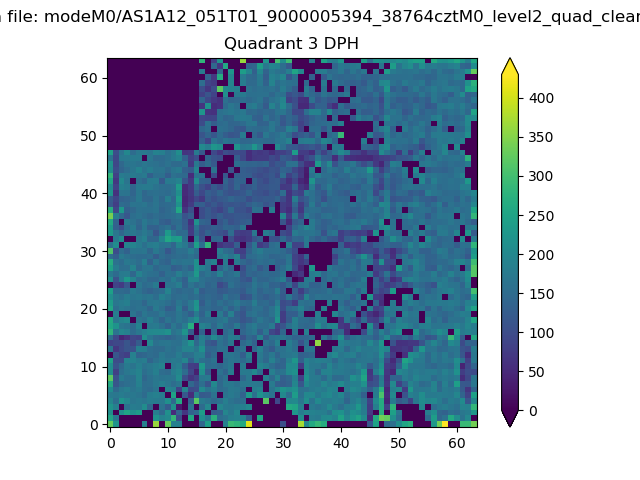 |
 |
Quadrant C |
| Plot type | Count rate plots | Images |
|---|---|---|
| Comparison with Poisson distribution Blue bars denote a histogram of data divided into 1 sec bins. Red curve is a Poisson curve with rate = median count rate of data. |
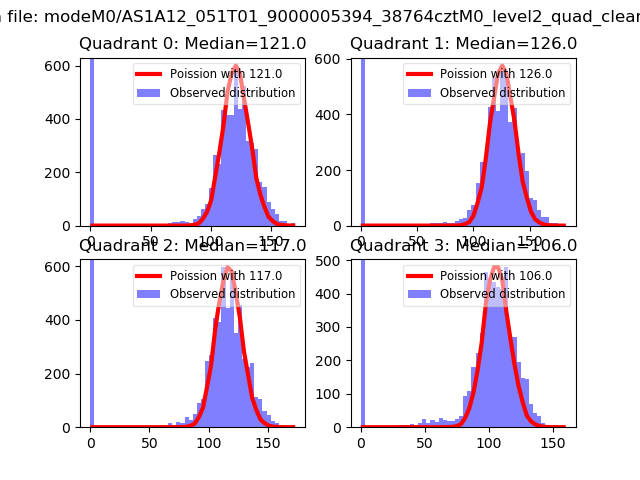 |
 |
| Quadrant-wise count rates Data is divided into 100 sec bins |
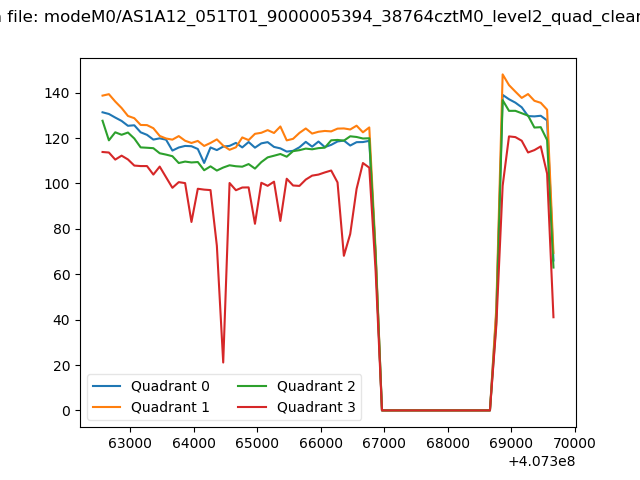 |
|
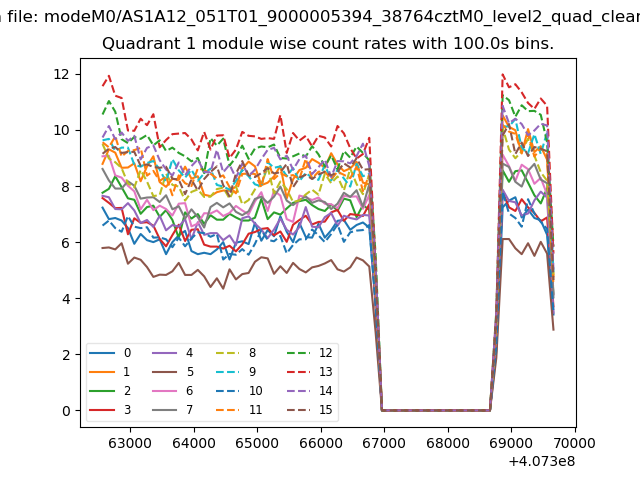
| Module-wise count rates for Quadrant A Data is divided into 100 sec bins |
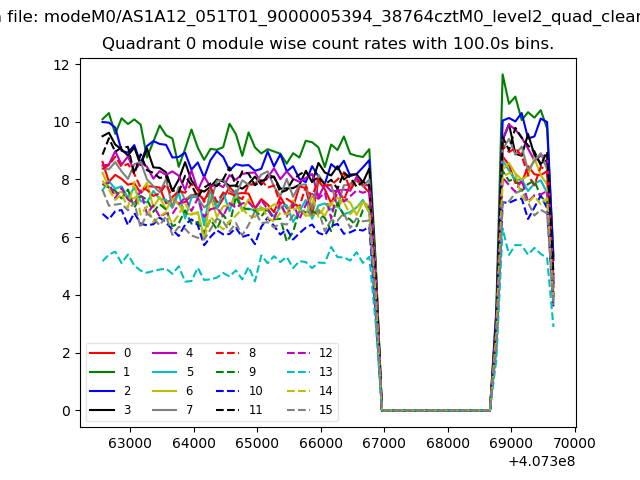 |
 |
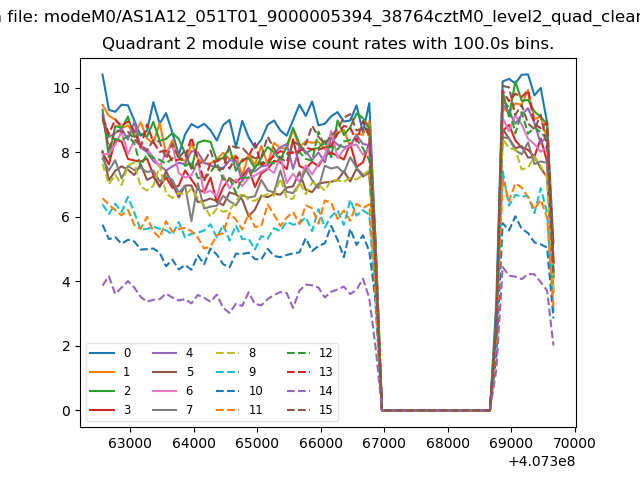
| Module-wise count rates for Quadrant B Data is divided into 100 sec bins |
 |
 |
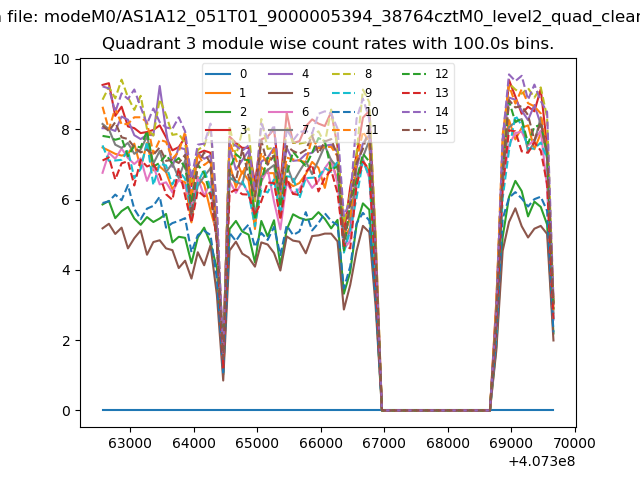
| Module-wise count rates for Quadrant C Data is divided into 100 sec bins |
 |
 |
| Module-wise count rates for Quadrant D Data is divided into 100 sec bins |
 |
 |
| Parameter | Plot |
|---|---|
| CZT HV Monitor | 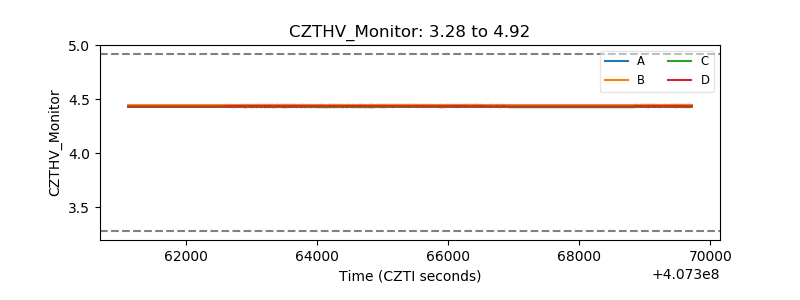 |
| D_VDD | 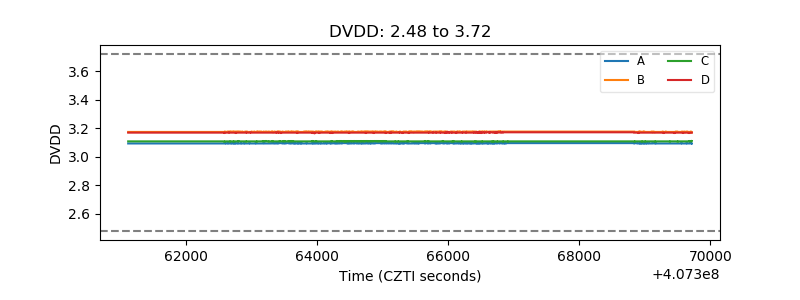 |
| Temperature 1 | 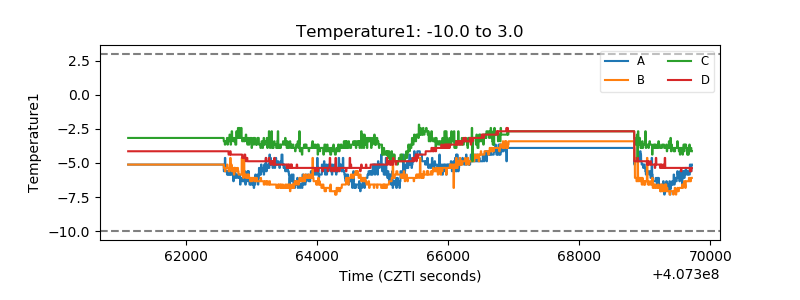 |
| Veto HV Monitor | 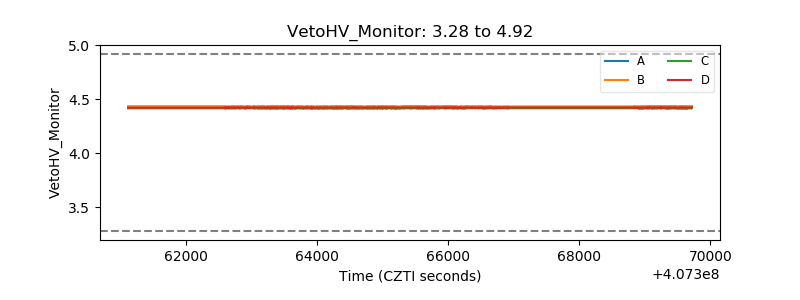 |
| Veto LLD | 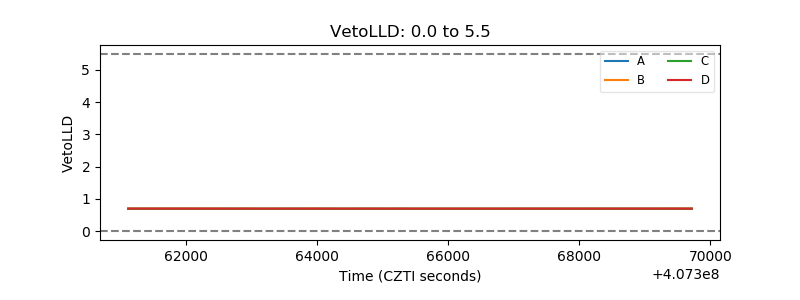 |
| Alpha Counter | 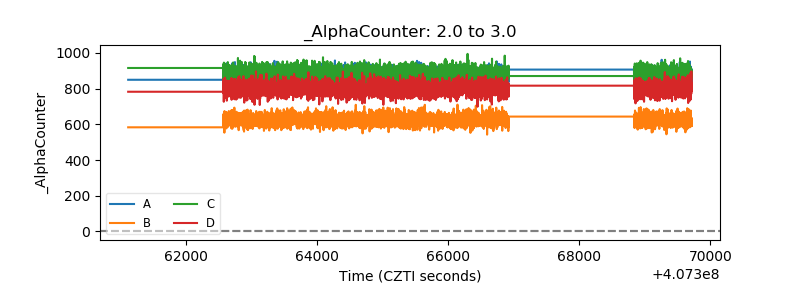 |
| _CPM_Rate | 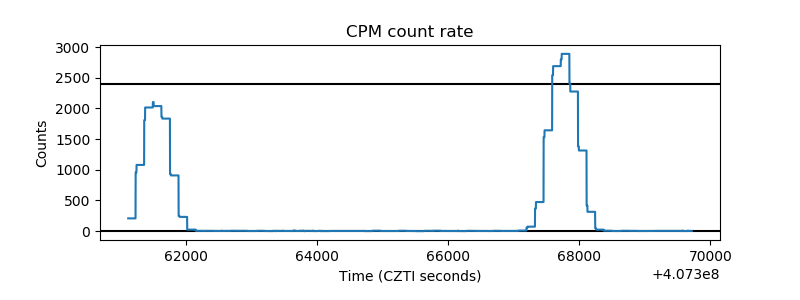 |
| CZT Counter | 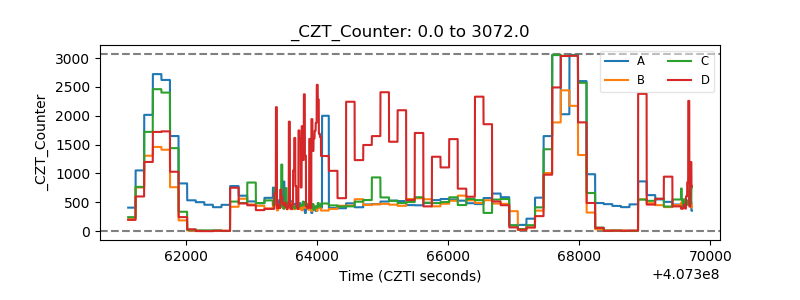 |
| +2.5 Volts monitor | 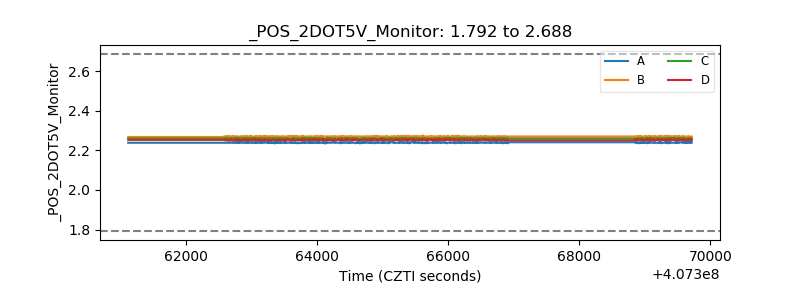 |
| +5 Volts monitor | 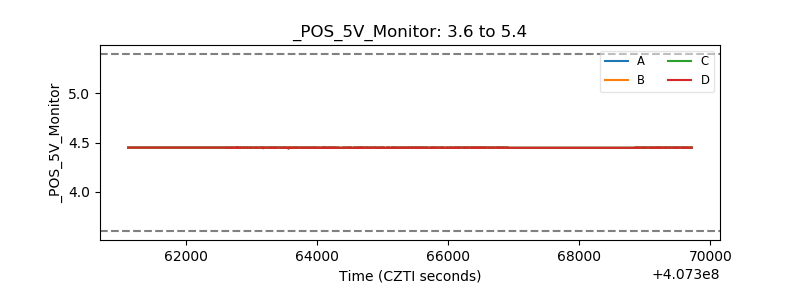 |
| _ROLL_ROT | 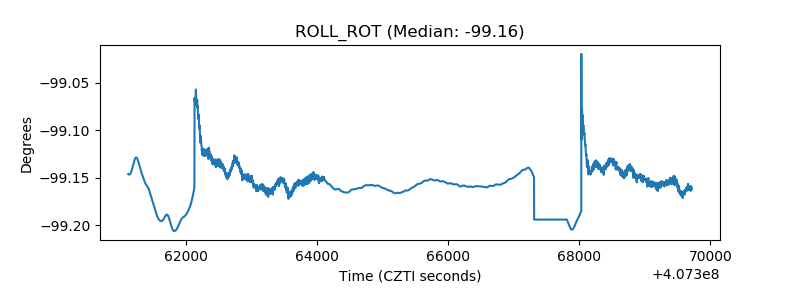 |
| _Roll_DEC | 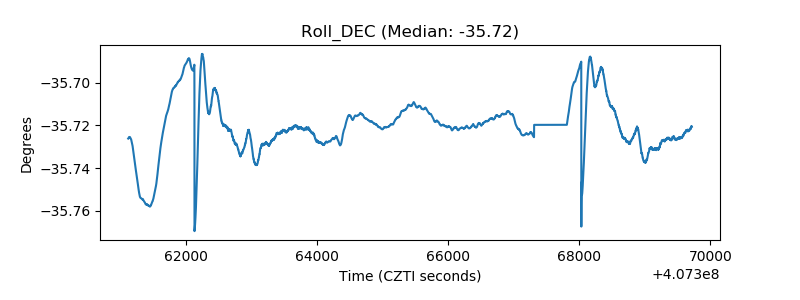 |
| _Roll_RA | 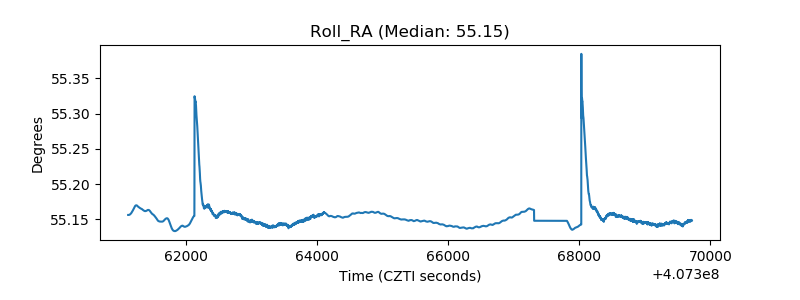 |
| Veto Counter | 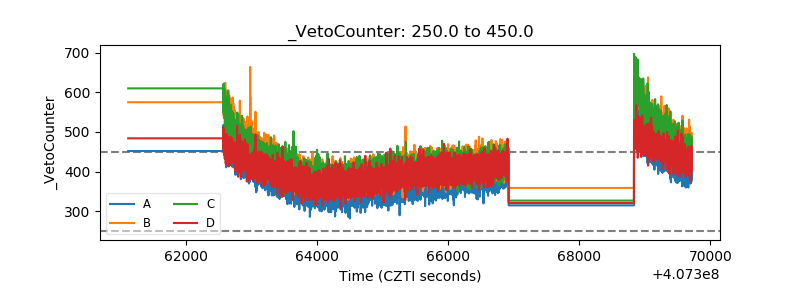 |