| Param | Original file | Final file |
|---|---|---|
| Filename | modeM0/AS1A12_051T01_9000005394_38766cztM0_level2.fits | modeM0/AS1A12_051T01_9000005394_38766cztM0_level2_quad_clean.evt |
| Size (bytes) | 555,125,760 | 169,914,240 |
| Size | 529.4 MB | 162.0 MB |
| Events in quadrant A | 4,911,163 | 1,150,198 |
| Events in quadrant B | 4,454,171 | 1,207,325 |
| Events in quadrant C | 4,912,655 | 1,130,173 |
| Events in quadrant D | 5,547,271 | 1,011,557 |
| Mode SS | |||
|---|---|---|---|
| Quadrant | BADHDUFLAG | Total packets | Discarded packets |
| A | 0 | 190 | 0 |
| B | 0 | 190 | 0 |
| C | 0 | 190 | 0 |
| D | 0 | 190 | 0 |
| Mode M0 | |||
|---|---|---|---|
| Quadrant | BADHDUFLAG | Total packets | Discarded packets |
| A | 0 | 19964 | 4 |
| B | 0 | 18952 | 3 |
| C | 0 | 19692 | 3 |
| D | 0 | 22884 | 3 |
| Mode M9 | |||
|---|---|---|---|
| Quadrant | BADHDUFLAG | Total packets | Discarded packets |
| A | 0 | 51 | 0 |
| B | 0 | 51 | 0 |
| C | 0 | 51 | 0 |
| D | 0 | 52 | 0 |
| Quadrant | Total seconds | Saturated seconds | Saturation percentage |
|---|---|---|---|
| A | 9322 | 17 | 0.182364% |
| B | 9322 | 10 | 0.107273% |
| C | 9322 | 53 | 0.568548% |
| D | 9322 | 229 | 2.456554% |
Noise dominated data is calculated using 1-second bins in cleaned event files. If a bin has >2000 counts, and if more than 50% of those come from <1% of pixels, then it is considered to be noise-dominated and hence unusable.
| Quadrant | # 1 sec bins | Bins with >0 counts | Bins with >2000 counts | High rate bins dominated by noise | Noise dominated (total time) | Noise dominated (detector-on time) | Marked lightcurve |
|---|---|---|---|---|---|---|---|
| A | 13478 | 9324 | 11 | 11 | 0.08% | 0.12% | 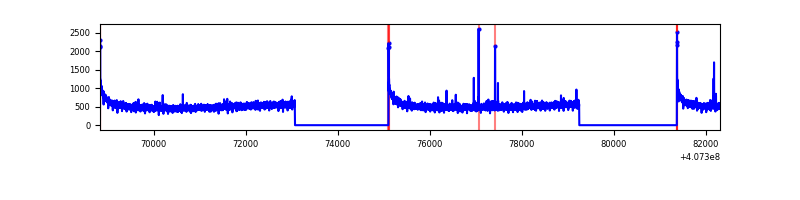 |
| B | 13478 | 9324 | 2 | 2 | 0.01% | 0.02% | 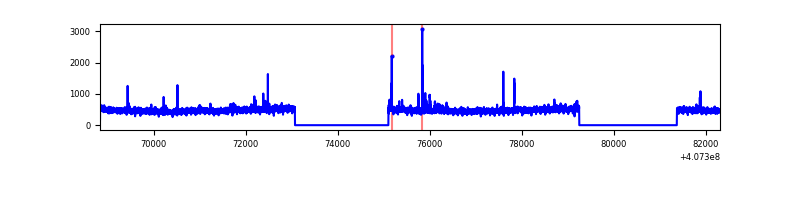 |
| C | 13478 | 9324 | 34 | 34 | 0.25% | 0.36% | 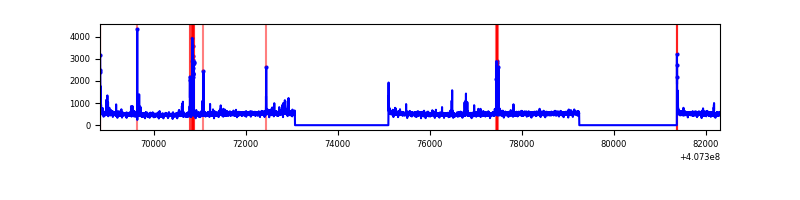 |
| D | 13478 | 9324 | 201 | 201 | 1.49% | 2.16% | 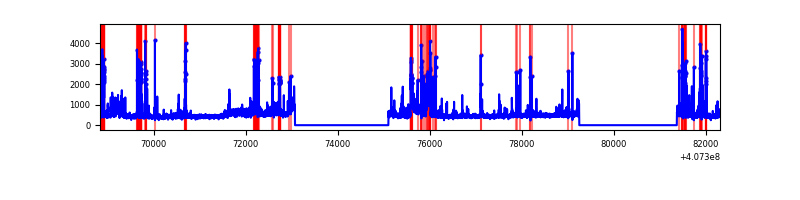 |
Top three noisy pixels from each quadrant. If the there are fewer than three noisy pixels in the level2.evt file, extra rows are filled as -1
| Pixel properties | Quadrant properties | ||||||
|---|---|---|---|---|---|---|---|
| Quadrant | DetID | PixID | Counts | Sigma | Mean | Median | Sigma |
| A | 10 | 83 | 647151 | 2973.19 | 1089 | 1070 | 217.3 |
| A | 13 | 248 | 36388 | 162.53 | 1089 | 1070 | 217.3 |
| A | 13 | 254 | 13234 | 55.98 | 1089 | 1070 | 217.3 |
| B | 4 | 171 | 45708 | 217.41 | 1100 | 1072 | 205.3 |
| B | 4 | 251 | 32109 | 151.17 | 1100 | 1072 | 205.3 |
| B | 0 | 230 | 28767 | 134.9 | 1100 | 1072 | 205.3 |
| C | 15 | 214 | 410557 | 1631.99 | 1086 | 1094 | 250.9 |
| C | 14 | 254 | 96319 | 379.54 | 1086 | 1094 | 250.9 |
| C | 0 | 239 | 57937 | 226.56 | 1086 | 1094 | 250.9 |
| D | 5 | 222 | 640215 | 2501.93 | 1059 | 1031 | 255.5 |
| D | 10 | 118 | 395675 | 1544.74 | 1059 | 1031 | 255.5 |
| D | 13 | 249 | 191303 | 744.77 | 1059 | 1031 | 255.5 |
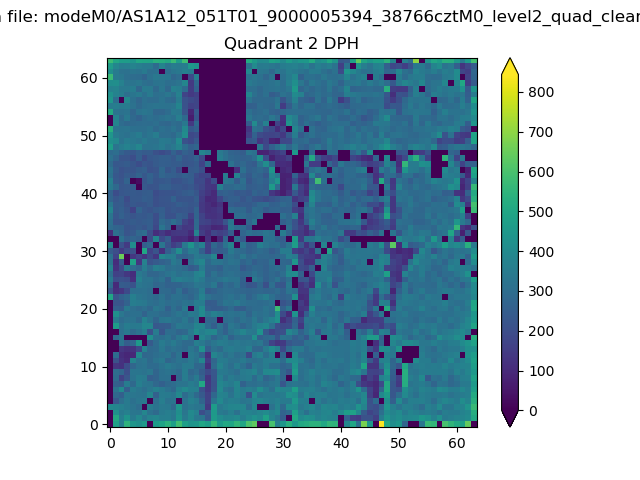
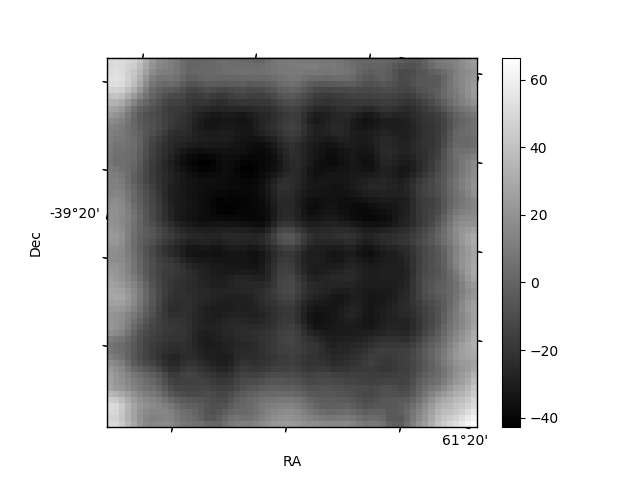
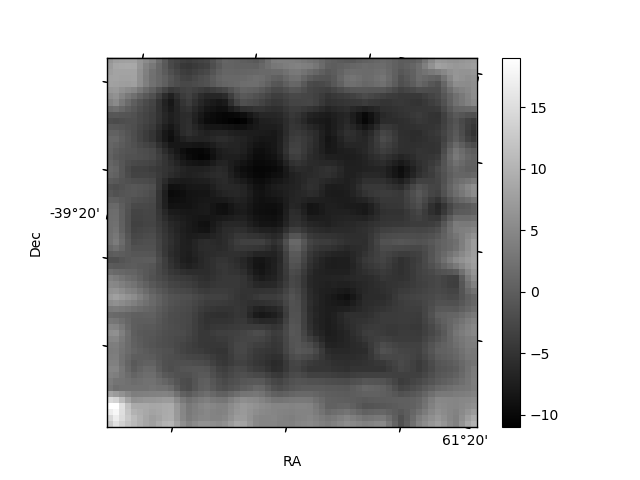
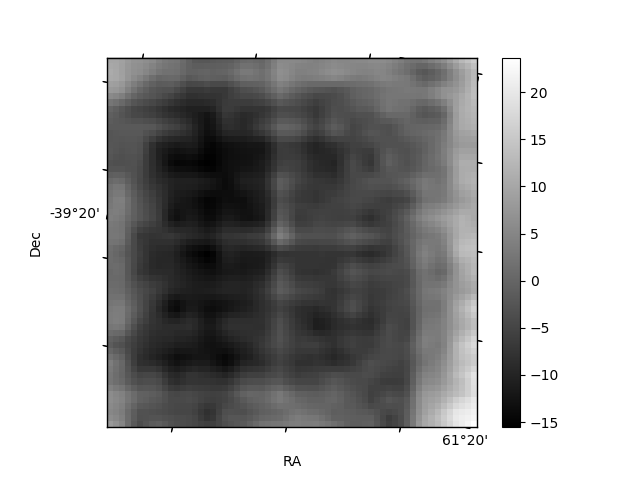
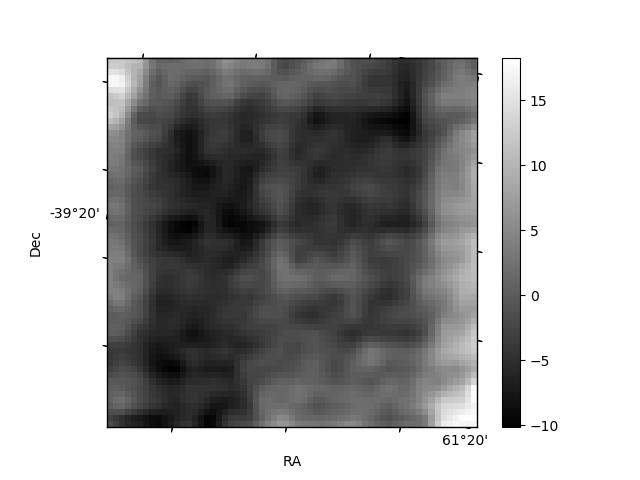
Histogram calculated using DETX and DETY for each event in the final _common_clean file
| Quadrant A | 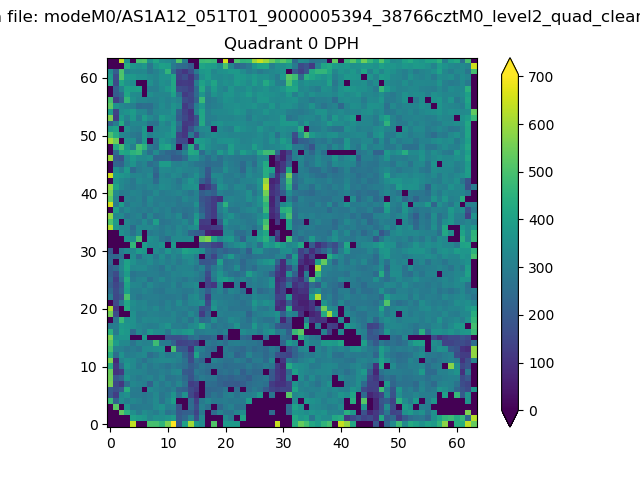 |
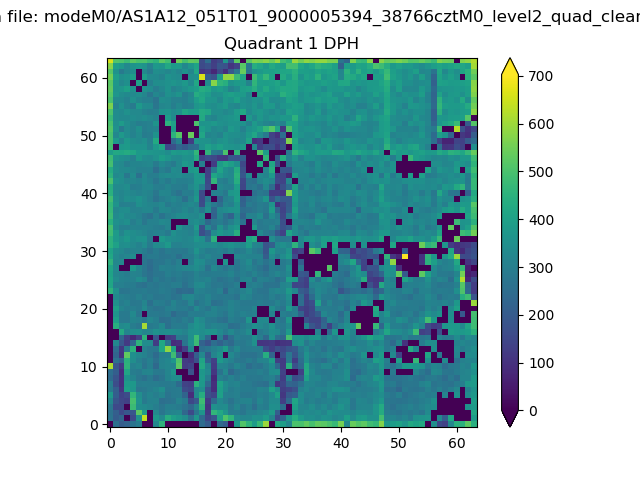 |
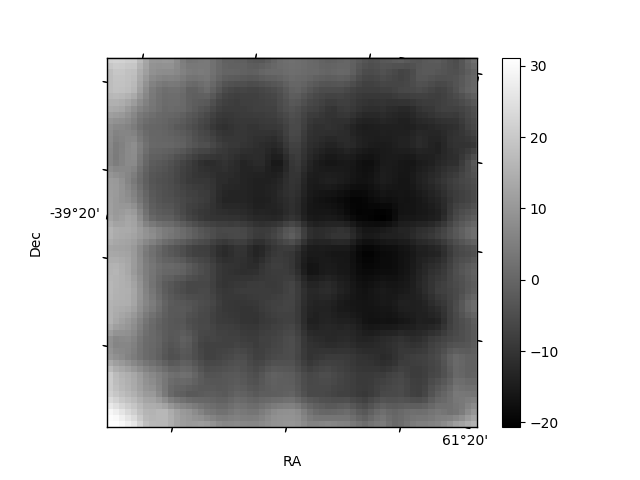
Quadrant B |
|---|---|---|---|
| Quadrant D | 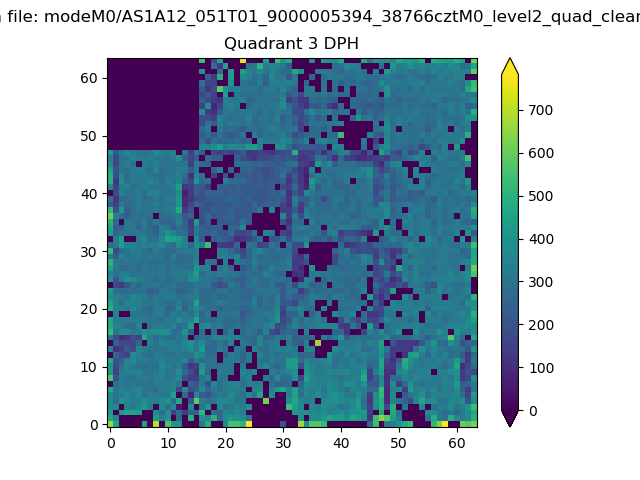 |
 |
Quadrant C |
| Plot type | Count rate plots | Images |
|---|---|---|
| Comparison with Poisson distribution Blue bars denote a histogram of data divided into 1 sec bins. Red curve is a Poisson curve with rate = median count rate of data. |
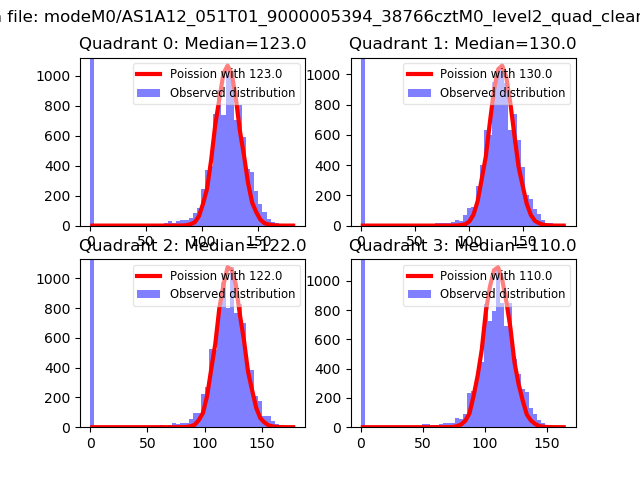 |
 |
| Quadrant-wise count rates Data is divided into 100 sec bins |
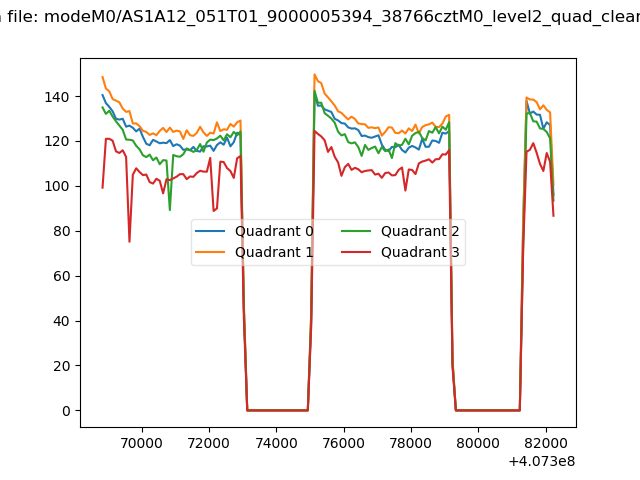 |
|
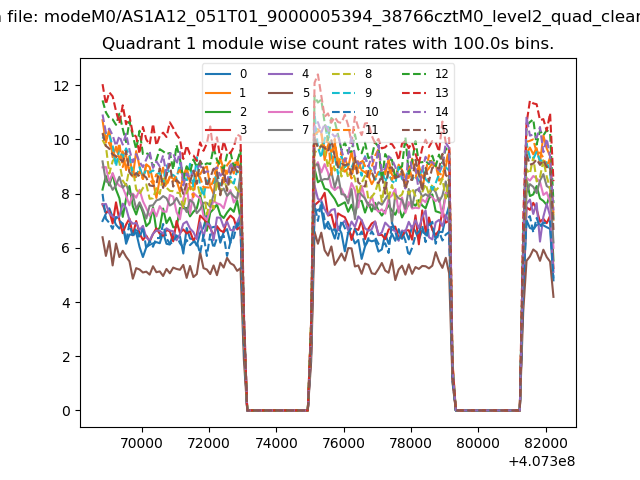
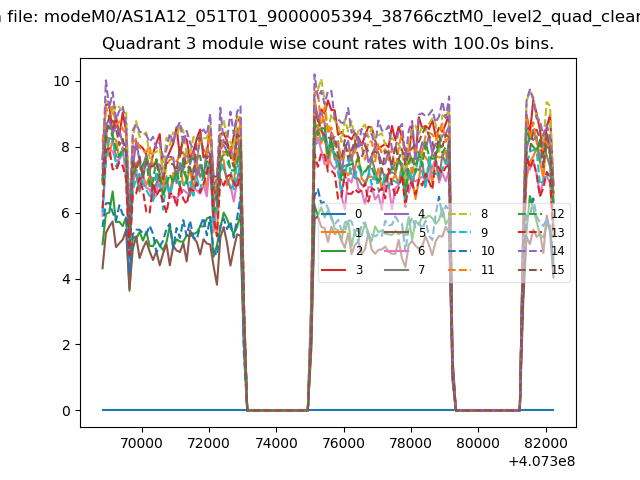
| Module-wise count rates for Quadrant A Data is divided into 100 sec bins |
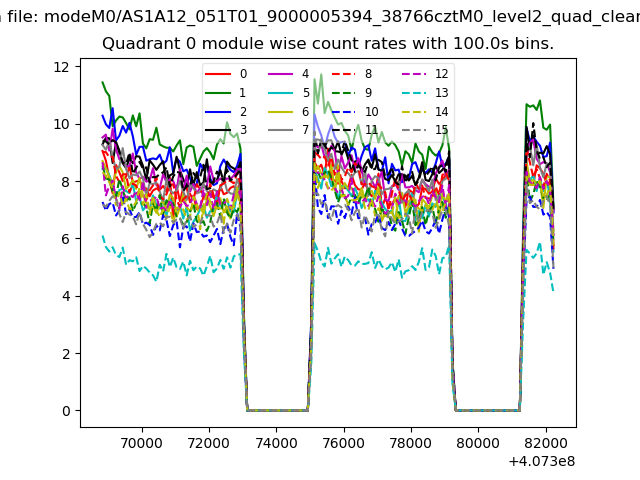 |
 |
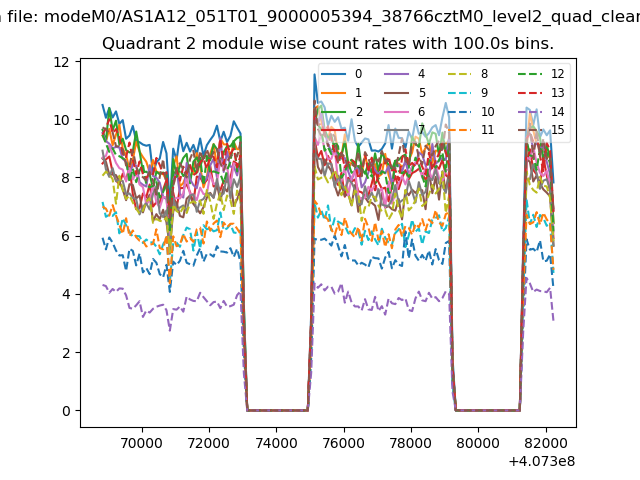
| Module-wise count rates for Quadrant B Data is divided into 100 sec bins |
 |
 |
| Module-wise count rates for Quadrant C Data is divided into 100 sec bins |
 |
 |
| Module-wise count rates for Quadrant D Data is divided into 100 sec bins |
 |
 |
| Parameter | Plot |
|---|---|
| CZT HV Monitor | 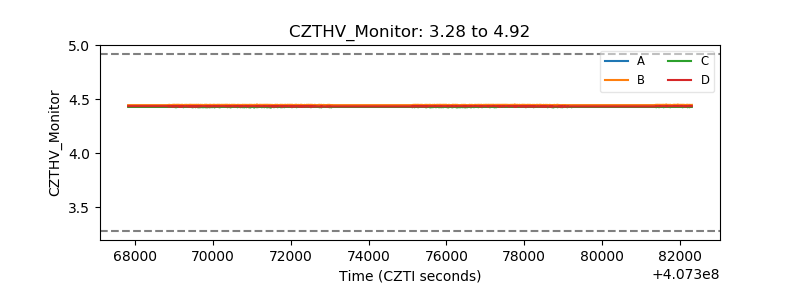 |
| D_VDD | 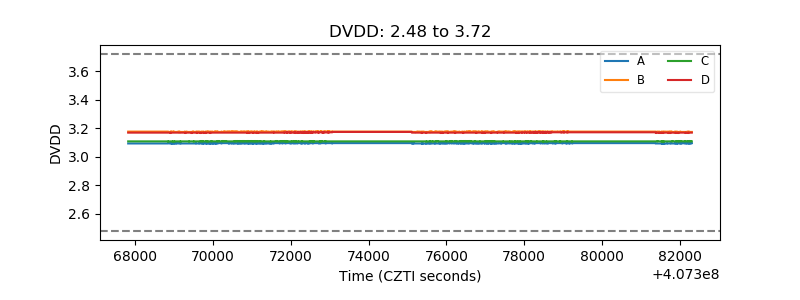 |
| Temperature 1 | 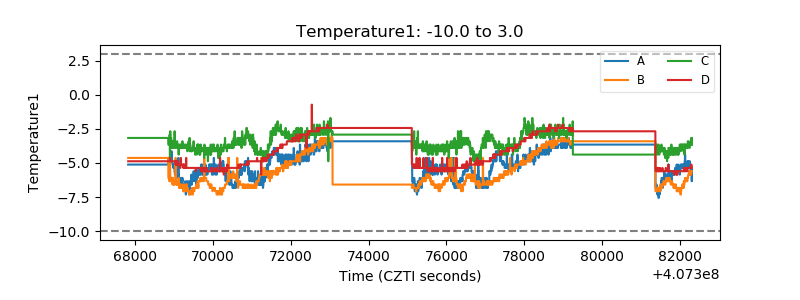 |
| Veto HV Monitor | 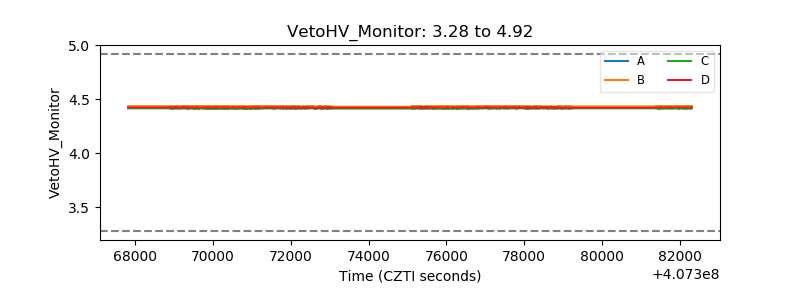 |
| Veto LLD | 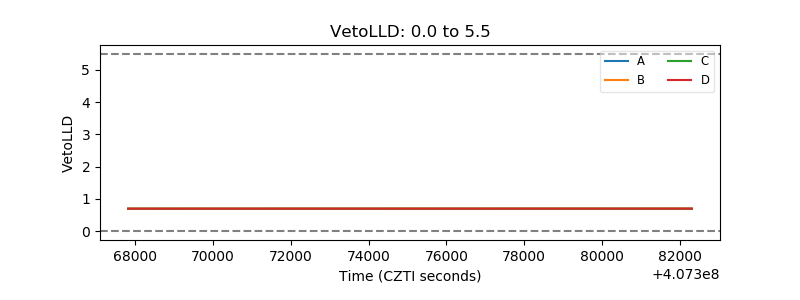 |
| Alpha Counter | 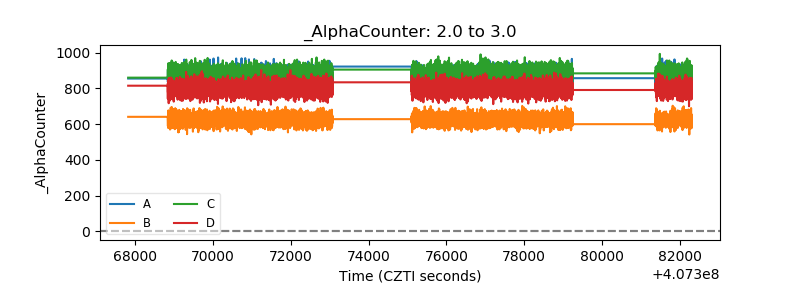 |
| _CPM_Rate |  |
| CZT Counter | 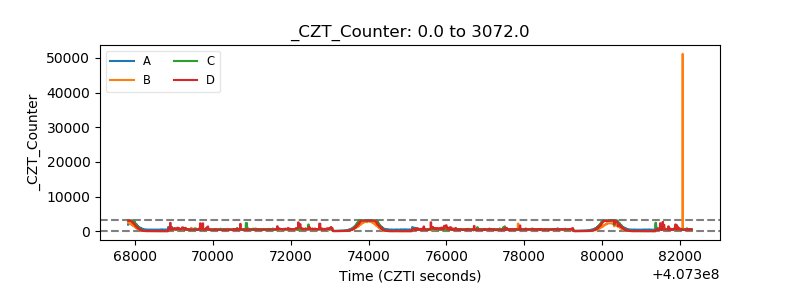 |
| +2.5 Volts monitor | 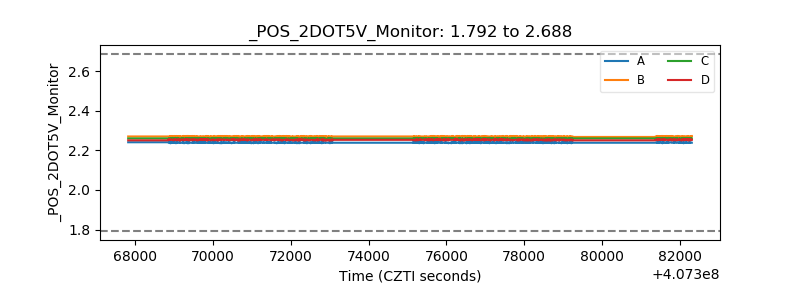 |
| +5 Volts monitor |  |
| _ROLL_ROT | 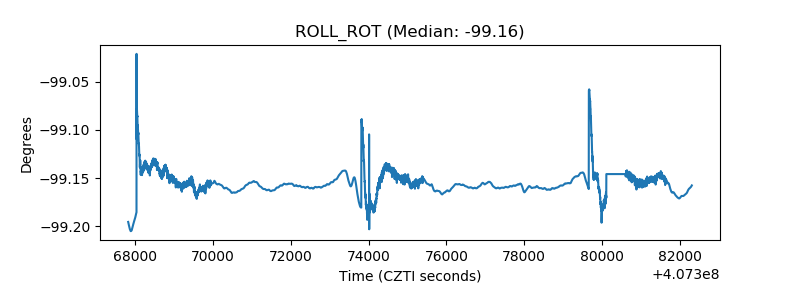 |
| _Roll_DEC | 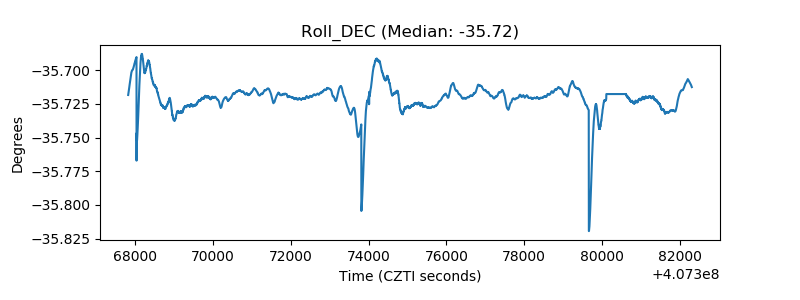 |
| _Roll_RA | 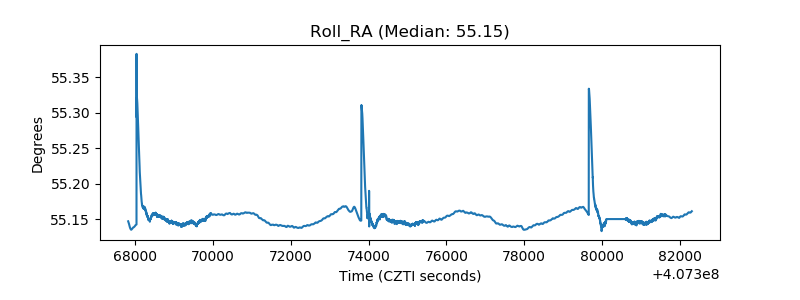 |
| Veto Counter | 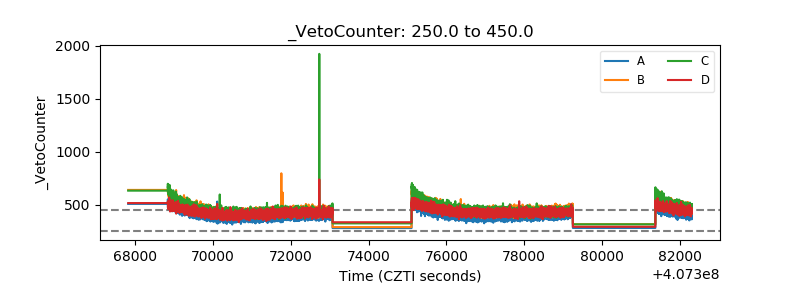 |