| Param | Original file | Final file |
|---|---|---|
| Filename | modeM0/AS1A12_051T01_9000005394_38767cztM0_level2.fits | modeM0/AS1A12_051T01_9000005394_38767cztM0_level2_quad_clean.evt |
| Size (bytes) | 303,678,720 | 88,107,840 |
| Size | 289.6 MB | 84.0 MB |
| Events in quadrant A | 2,627,222 | 593,873 |
| Events in quadrant B | 2,280,204 | 622,538 |
| Events in quadrant C | 2,944,431 | 581,525 |
| Events in quadrant D | 3,011,031 | 530,051 |
| Mode SS | |||
|---|---|---|---|
| Quadrant | BADHDUFLAG | Total packets | Discarded packets |
| A | 0 | 98 | 0 |
| B | 0 | 98 | 0 |
| C | 0 | 98 | 0 |
| D | 0 | 98 | 0 |
| Mode M0 | |||
|---|---|---|---|
| Quadrant | BADHDUFLAG | Total packets | Discarded packets |
| A | 0 | 10607 | 3 |
| B | 0 | 9802 | 2 |
| C | 0 | 11569 | 2 |
| D | 0 | 12115 | 2 |
| Mode M9 | |||
|---|---|---|---|
| Quadrant | BADHDUFLAG | Total packets | Discarded packets |
| A | 0 | 32 | 0 |
| B | 0 | 32 | 0 |
| C | 0 | 32 | 0 |
| D | 0 | 33 | 0 |
| Quadrant | Total seconds | Saturated seconds | Saturation percentage |
|---|---|---|---|
| A | 4853 | 5 | 0.103029% |
| B | 4853 | 8 | 0.164846% |
| C | 4853 | 86 | 1.772100% |
| D | 4853 | 91 | 1.875129% |
Noise dominated data is calculated using 1-second bins in cleaned event files. If a bin has >2000 counts, and if more than 50% of those come from <1% of pixels, then it is considered to be noise-dominated and hence unusable.
| Quadrant | # 1 sec bins | Bins with >0 counts | Bins with >2000 counts | High rate bins dominated by noise | Noise dominated (total time) | Noise dominated (detector-on time) | Marked lightcurve |
|---|---|---|---|---|---|---|---|
| A | 7006 | 4854 | 6 | 6 | 0.09% | 0.12% | 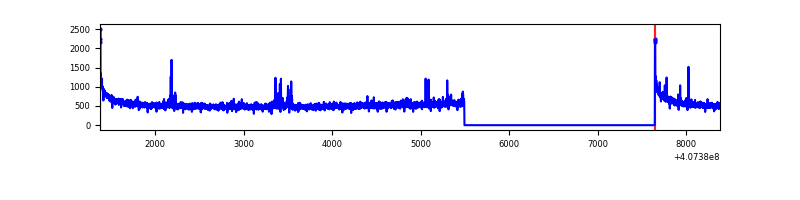 |
| B | 7006 | 4854 | 2 | 2 | 0.03% | 0.04% | 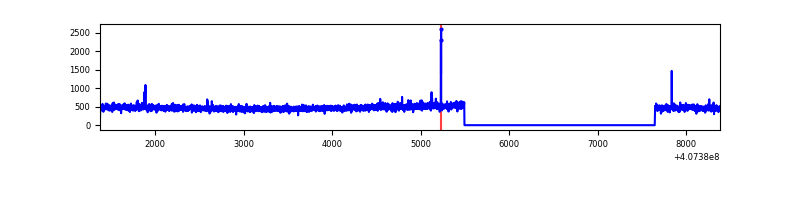 |
| C | 7006 | 4854 | 70 | 70 | 1.00% | 1.44% | 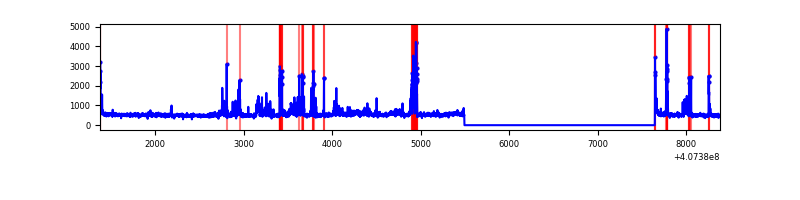 |
| D | 7006 | 4854 | 77 | 77 | 1.10% | 1.59% | 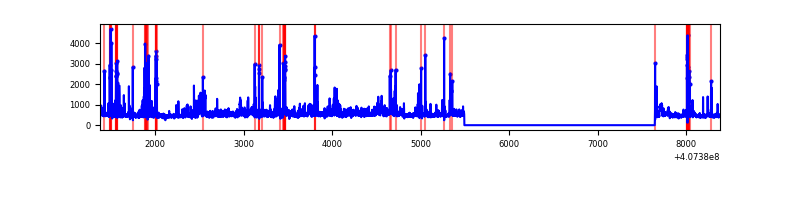 |
Top three noisy pixels from each quadrant. If the there are fewer than three noisy pixels in the level2.evt file, extra rows are filled as -1
| Pixel properties | Quadrant properties | ||||||
|---|---|---|---|---|---|---|---|
| Quadrant | DetID | PixID | Counts | Sigma | Mean | Median | Sigma |
| A | 10 | 83 | 368244 | 3224.29 | 565 | 553 | 114.0 |
| A | 13 | 248 | 62726 | 545.2 | 565 | 553 | 114.0 |
| A | 13 | 254 | 7141 | 57.77 | 565 | 553 | 114.0 |
| B | 0 | 230 | 13947 | 122.4 | 569 | 553 | 109.4 |
| B | 12 | 111 | 13452 | 117.88 | 569 | 553 | 109.4 |
| B | 11 | 111 | 12465 | 108.86 | 569 | 553 | 109.4 |
| C | 15 | 208 | 380251 | 2908.76 | 562 | 567 | 130.5 |
| C | 15 | 214 | 216792 | 1656.5 | 562 | 567 | 130.5 |
| C | 14 | 254 | 80817 | 614.79 | 562 | 567 | 130.5 |
| D | 10 | 118 | 219155 | 1638.79 | 554 | 539 | 133.4 |
| D | 2 | 16 | 215910 | 1614.46 | 554 | 539 | 133.4 |
| D | 5 | 222 | 163688 | 1223.0 | 554 | 539 | 133.4 |
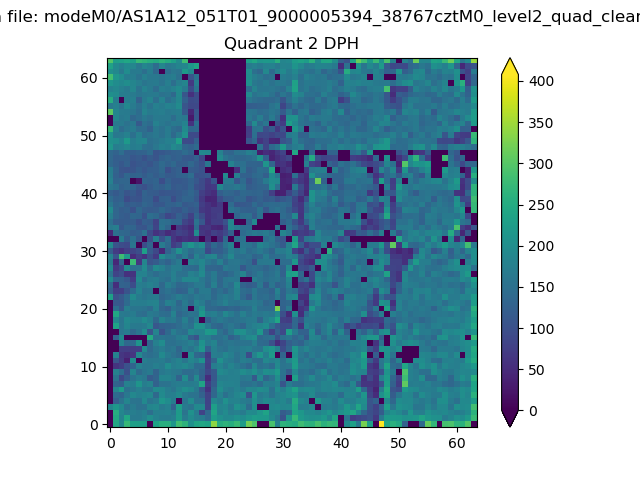
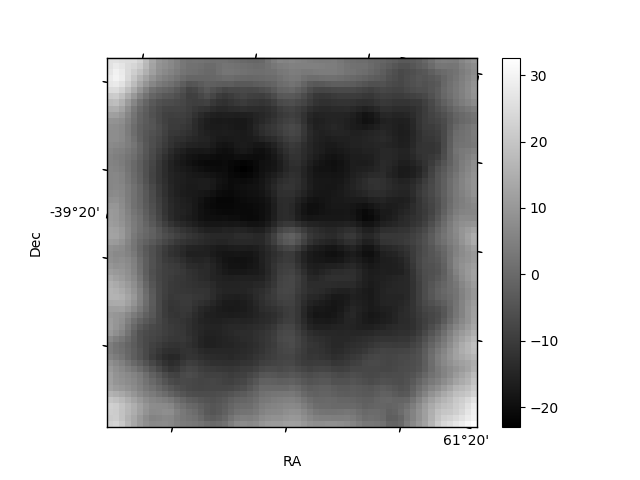
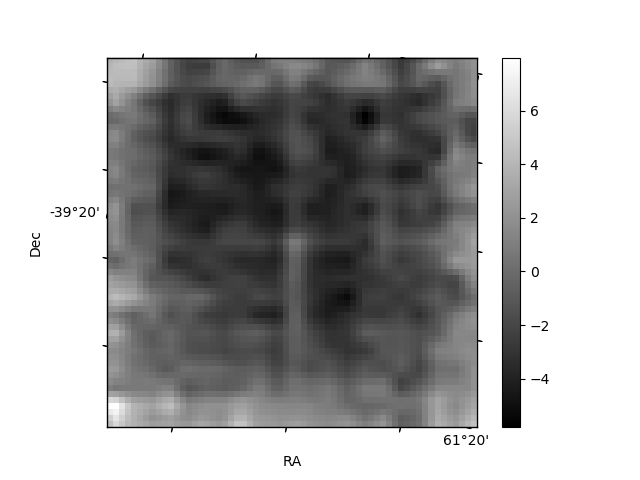
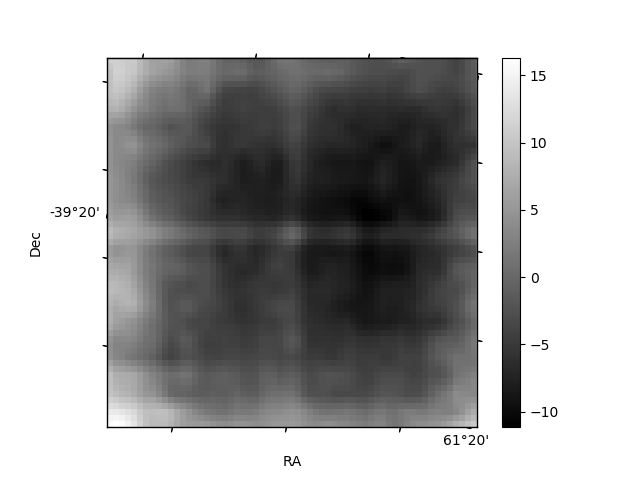
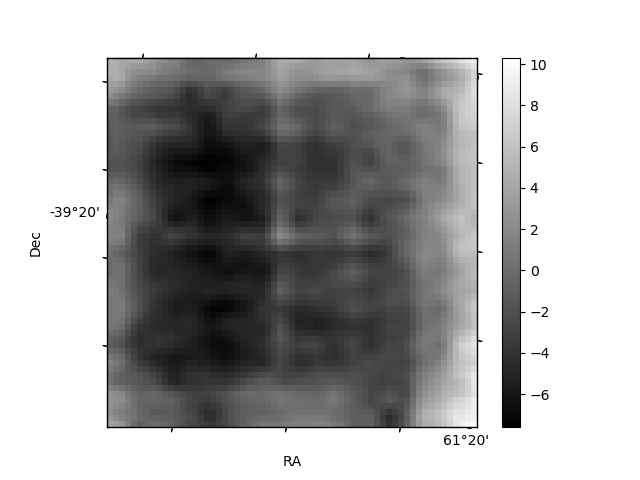
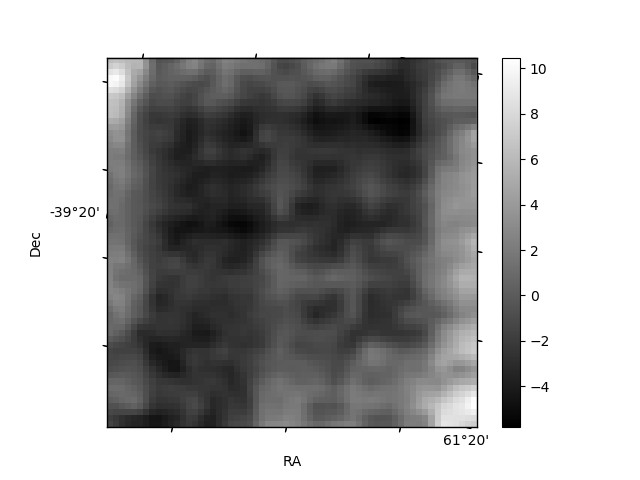
Histogram calculated using DETX and DETY for each event in the final _common_clean file
| Quadrant A | 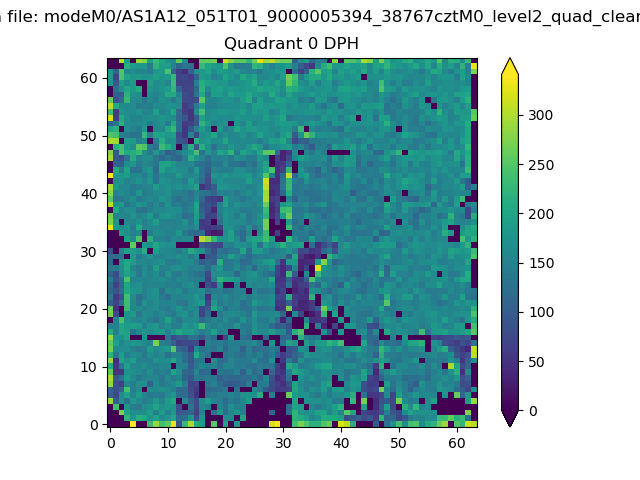 |
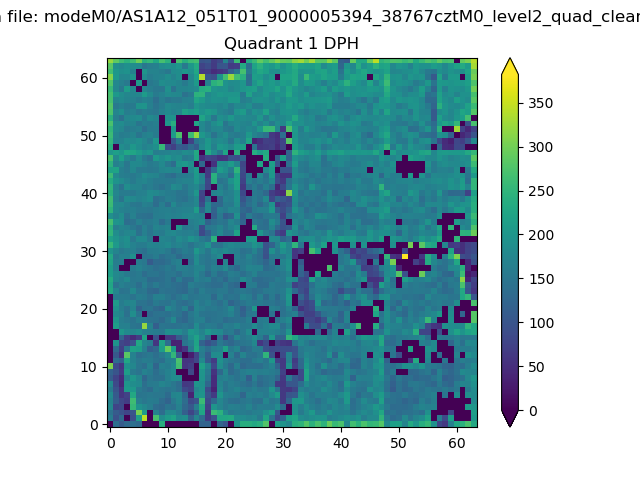 |
Quadrant B |
|---|---|---|---|
| Quadrant D | 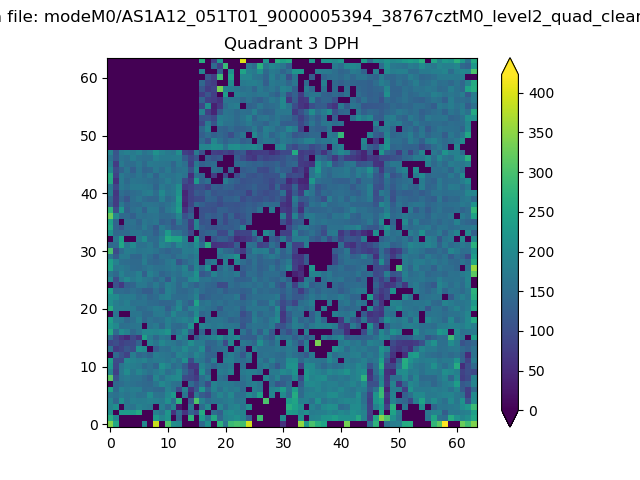 |
 |
Quadrant C |
| Plot type | Count rate plots | Images |
|---|---|---|
| Comparison with Poisson distribution Blue bars denote a histogram of data divided into 1 sec bins. Red curve is a Poisson curve with rate = median count rate of data. |
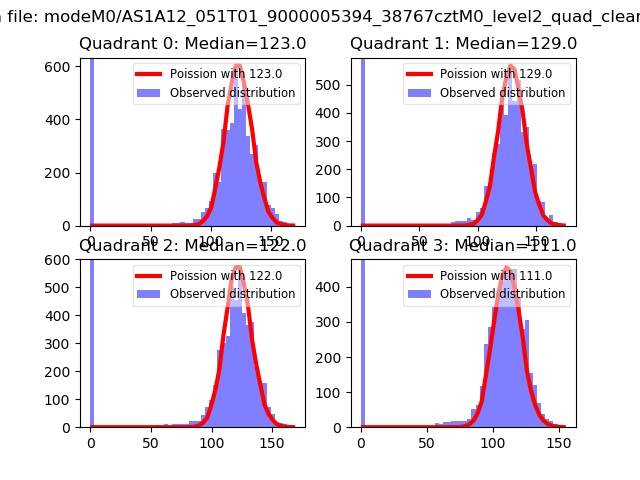 |
 |
| Quadrant-wise count rates Data is divided into 100 sec bins |
 |
|
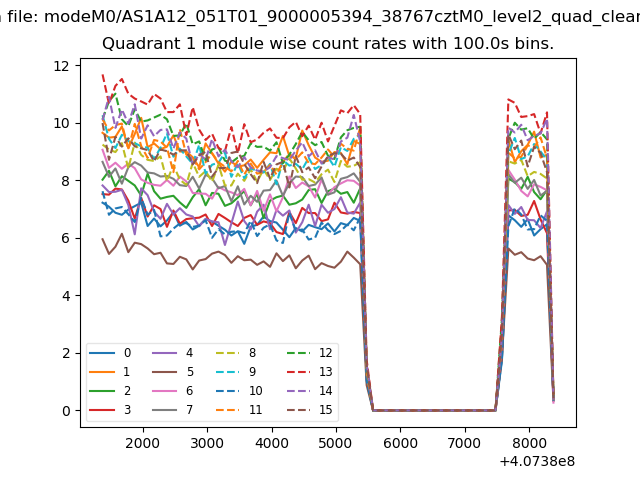
| Module-wise count rates for Quadrant A Data is divided into 100 sec bins |
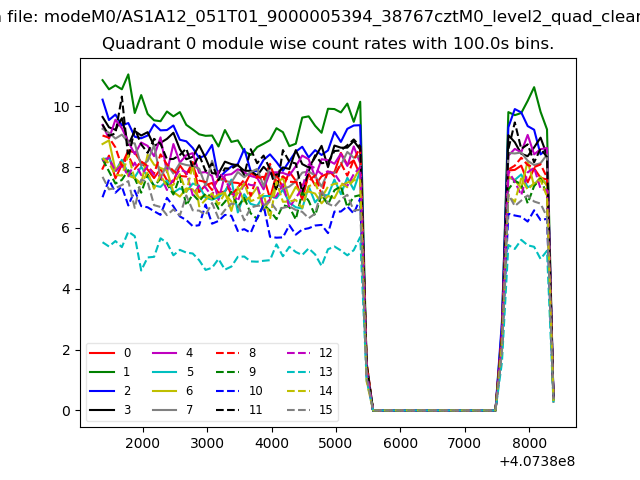 |
 |
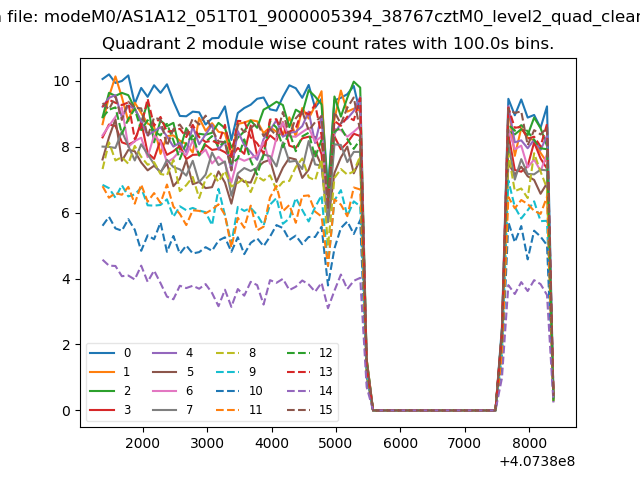
| Module-wise count rates for Quadrant B Data is divided into 100 sec bins |
 |
 |
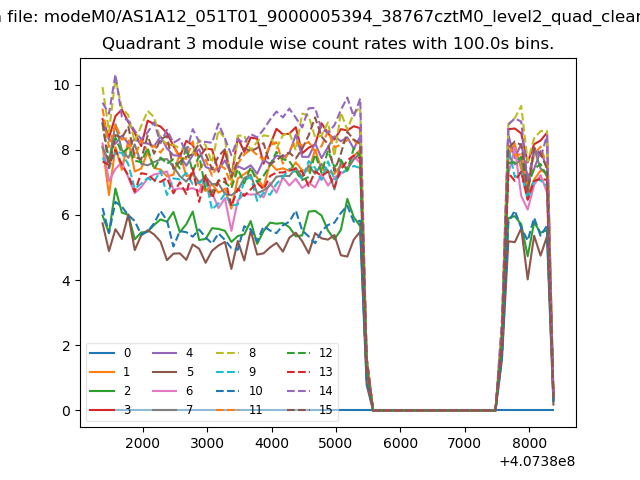
| Module-wise count rates for Quadrant C Data is divided into 100 sec bins |
 |
 |
| Module-wise count rates for Quadrant D Data is divided into 100 sec bins |
 |
 |
| Parameter | Plot |
|---|---|
| CZT HV Monitor | 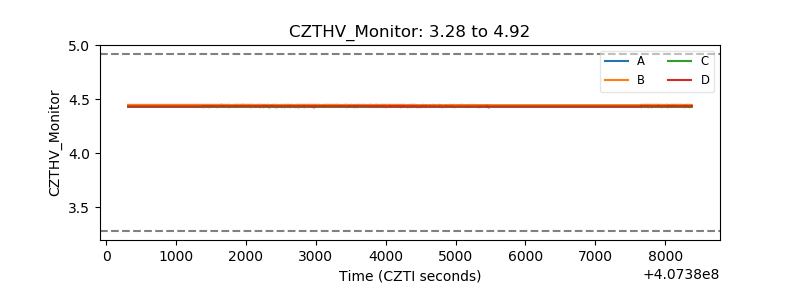 |
| D_VDD | 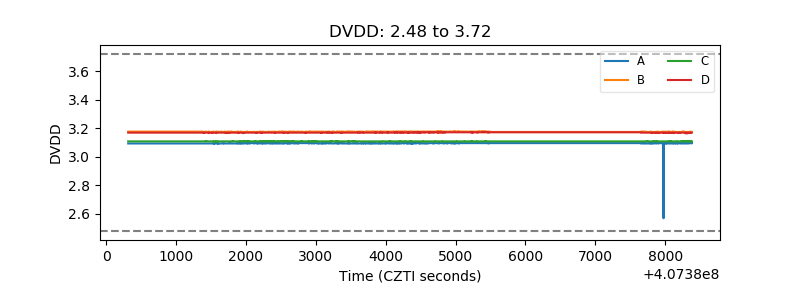 |
| Temperature 1 | 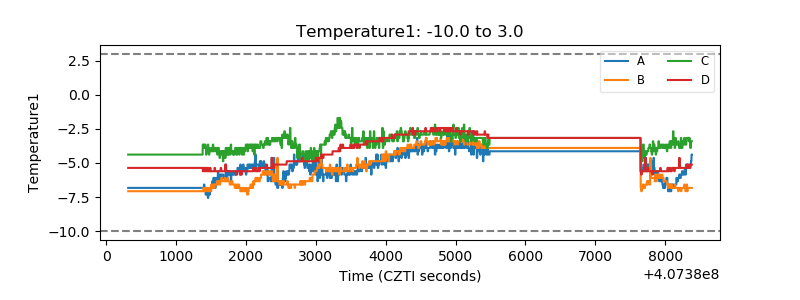 |
| Veto HV Monitor | 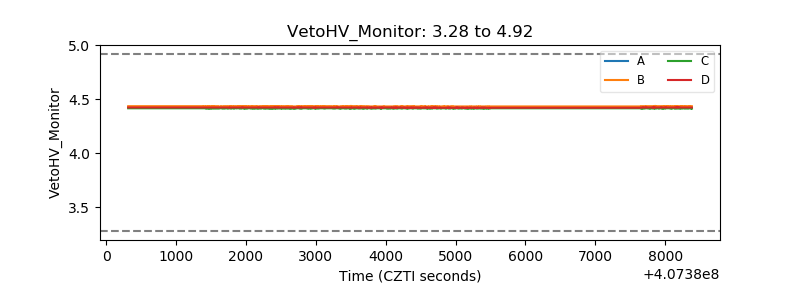 |
| Veto LLD | 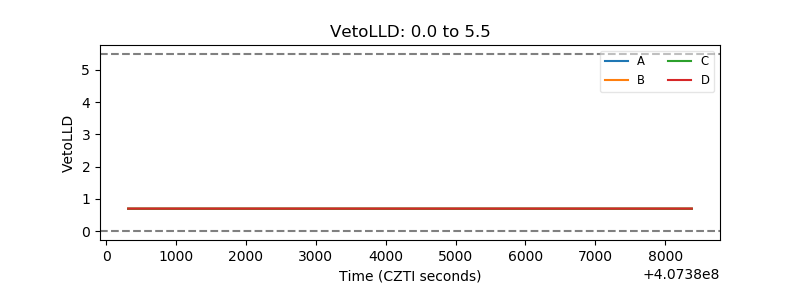 |
| Alpha Counter | 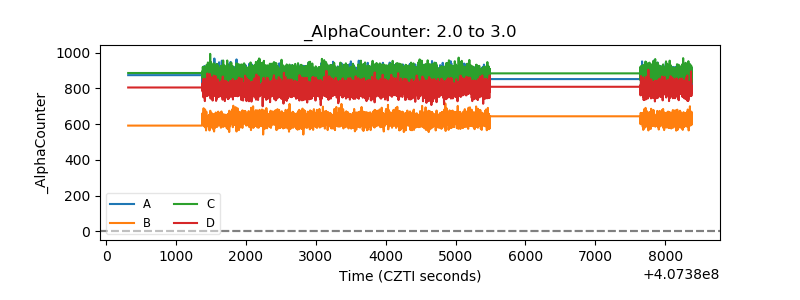 |
| _CPM_Rate | 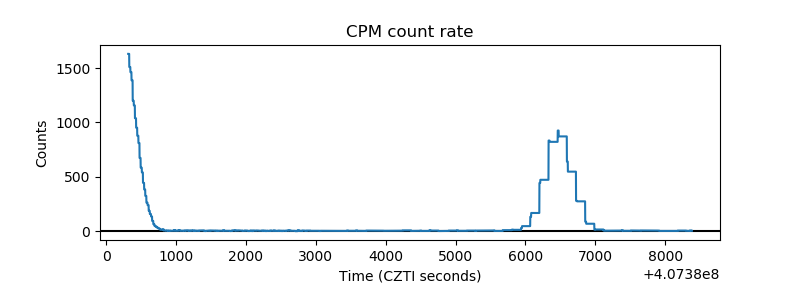 |
| CZT Counter | 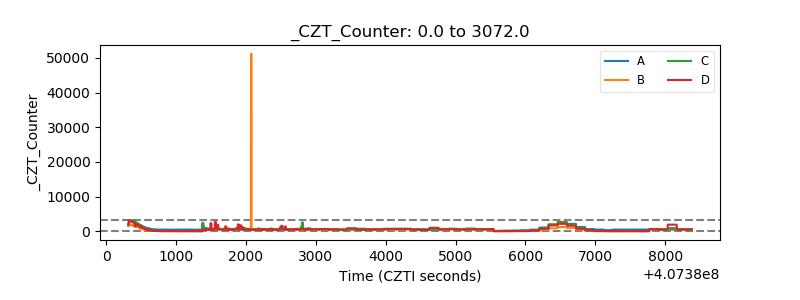 |
| +2.5 Volts monitor | 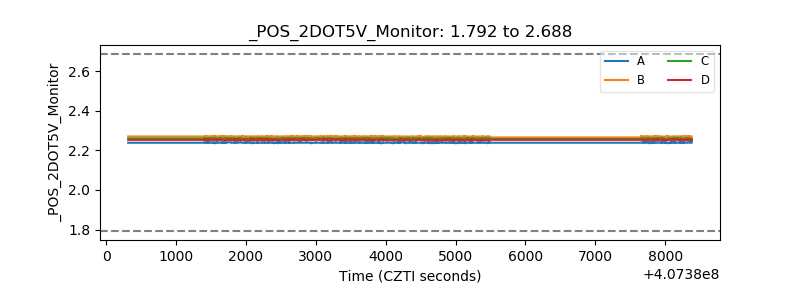 |
| +5 Volts monitor | 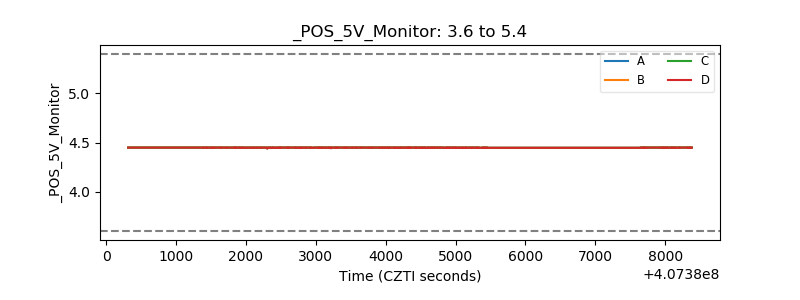 |
| _ROLL_ROT | 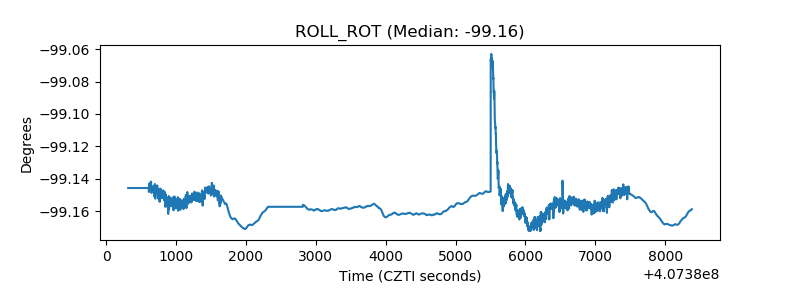 |
| _Roll_DEC | 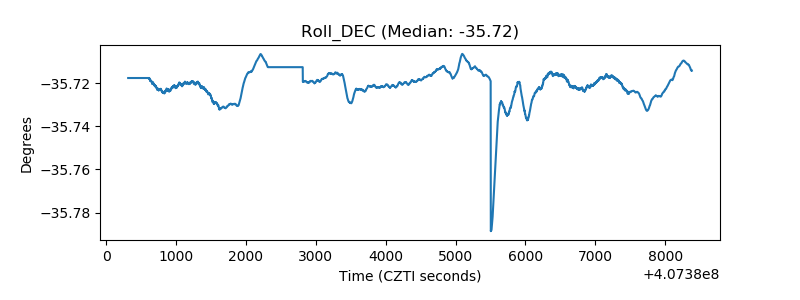 |
| _Roll_RA | 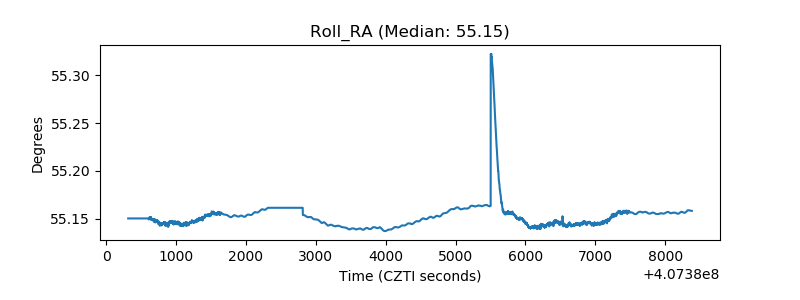 |
| Veto Counter | 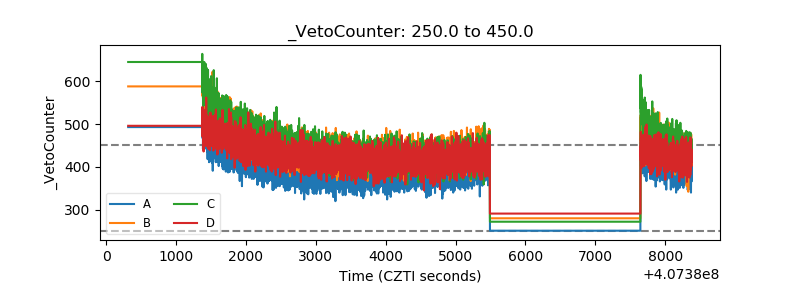 |