| Param | Original file | Final file |
|---|---|---|
| Filename | modeM0/AS1A12_051T01_9000005394_38769cztM0_level2.fits | modeM0/AS1A12_051T01_9000005394_38769cztM0_level2_quad_clean.evt |
| Size (bytes) | 368,472,960 | 87,992,640 |
| Size | 351.4 MB | 83.9 MB |
| Events in quadrant A | 2,951,832 | 606,168 |
| Events in quadrant B | 2,389,602 | 630,734 |
| Events in quadrant C | 3,554,986 | 576,680 |
| Events in quadrant D | 4,322,476 | 472,548 |
| Mode SS | |||
|---|---|---|---|
| Quadrant | BADHDUFLAG | Total packets | Discarded packets |
| A | 0 | 114 | 0 |
| B | 0 | 114 | 0 |
| C | 0 | 114 | 0 |
| D | 0 | 114 | 0 |
| Mode M0 | |||
|---|---|---|---|
| Quadrant | BADHDUFLAG | Total packets | Discarded packets |
| A | 0 | 12008 | 3 |
| B | 0 | 10821 | 2 |
| C | 0 | 13848 | 2 |
| D | 0 | 16580 | 2 |
| Mode M9 | |||
|---|---|---|---|
| Quadrant | BADHDUFLAG | Total packets | Discarded packets |
| A | 0 | 38 | 0 |
| B | 0 | 38 | 0 |
| C | 0 | 38 | 0 |
| D | 0 | 38 | 0 |
| Quadrant | Total seconds | Saturated seconds | Saturation percentage |
|---|---|---|---|
| A | 5399 | 35 | 0.648268% |
| B | 5399 | 4 | 0.074088% |
| C | 5399 | 274 | 5.075014% |
| D | 5399 | 801 | 14.836081% |
Noise dominated data is calculated using 1-second bins in cleaned event files. If a bin has >2000 counts, and if more than 50% of those come from <1% of pixels, then it is considered to be noise-dominated and hence unusable.
| Quadrant | # 1 sec bins | Bins with >0 counts | Bins with >2000 counts | High rate bins dominated by noise | Noise dominated (total time) | Noise dominated (detector-on time) | Marked lightcurve |
|---|---|---|---|---|---|---|---|
| A | 9313 | 5401 | 30 | 30 | 0.32% | 0.56% | 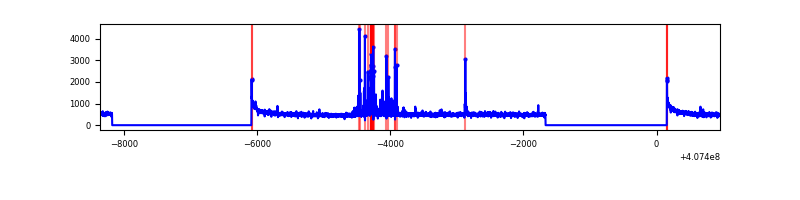 |
| B | 9313 | 5401 | 0 | 0 | 0.00% | 0.00% |  |
| C | 9313 | 5401 | 242 | 242 | 2.60% | 4.48% |  |
| D | 9313 | 5401 | 750 | 750 | 8.05% | 13.89% |  |
Top three noisy pixels from each quadrant. If the there are fewer than three noisy pixels in the level2.evt file, extra rows are filled as -1
| Pixel properties | Quadrant properties | ||||||
|---|---|---|---|---|---|---|---|
| Quadrant | DetID | PixID | Counts | Sigma | Mean | Median | Sigma |
| A | 10 | 83 | 395398 | 3201.14 | 602 | 590 | 123.3 |
| A | 13 | 248 | 220978 | 1786.93 | 602 | 590 | 123.3 |
| A | 13 | 254 | 8028 | 60.31 | 602 | 590 | 123.3 |
| B | 12 | 111 | 15158 | 124.21 | 603 | 588 | 117.3 |
| B | 11 | 111 | 13874 | 113.26 | 603 | 588 | 117.3 |
| B | 14 | 111 | 13429 | 109.47 | 603 | 588 | 117.3 |
| C | 14 | 254 | 628784 | 4660.62 | 578 | 582 | 134.8 |
| C | 0 | 239 | 390699 | 2894.27 | 578 | 582 | 134.8 |
| C | 15 | 214 | 236886 | 1753.14 | 578 | 582 | 134.8 |
| D | 2 | 16 | 1988180 | 15405.01 | 527 | 510 | 129.0 |
| D | 14 | 52 | 64189 | 493.53 | 527 | 510 | 129.0 |
| D | 12 | 128 | 50829 | 389.98 | 527 | 510 | 129.0 |
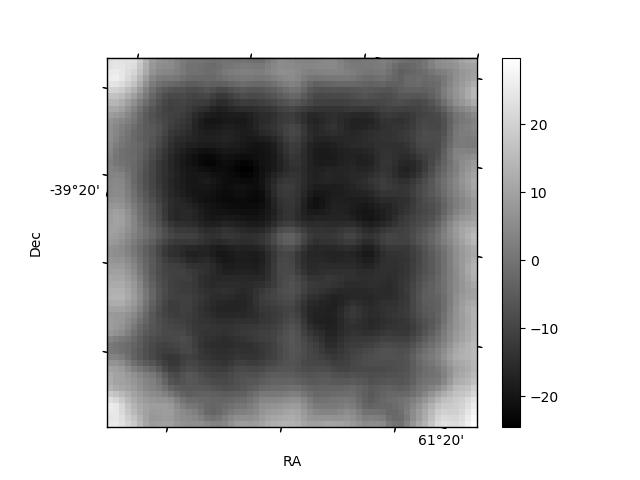
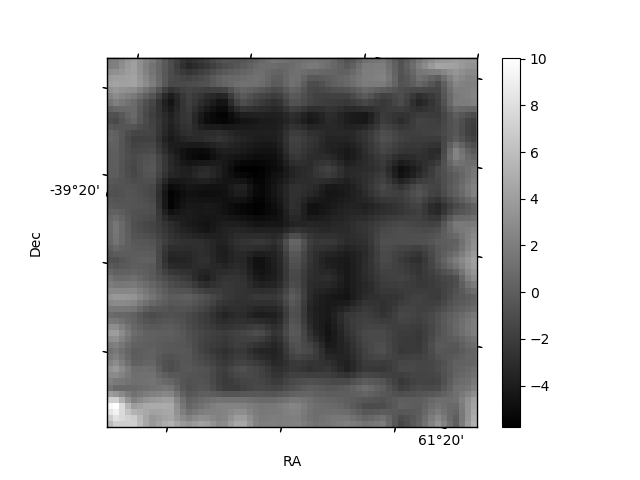
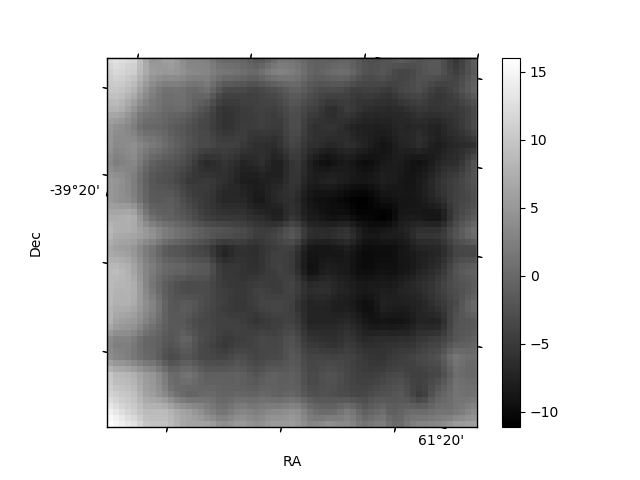
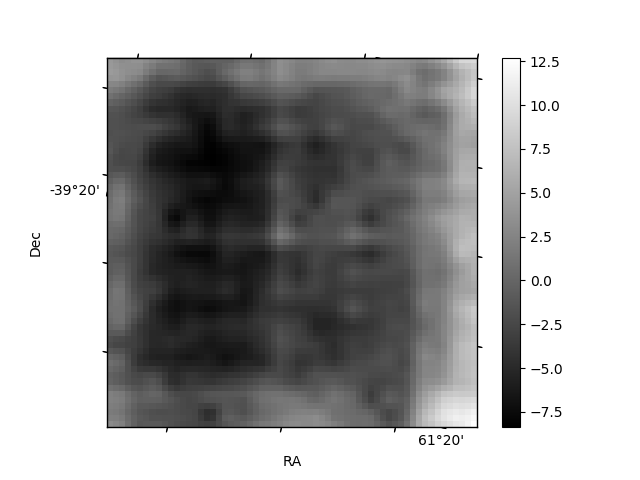
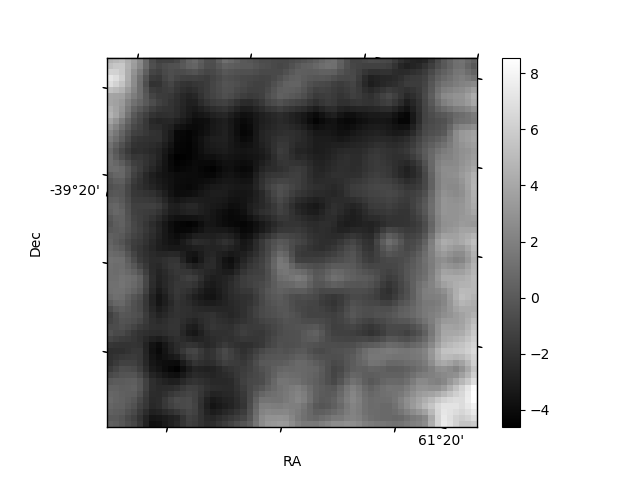
Histogram calculated using DETX and DETY for each event in the final _common_clean file
| Quadrant A | 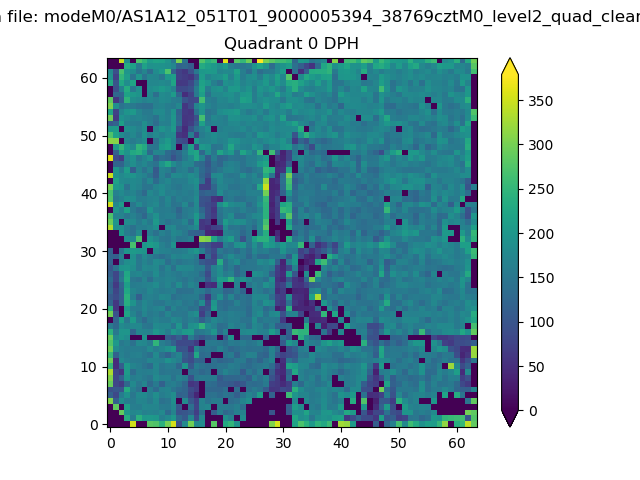 |
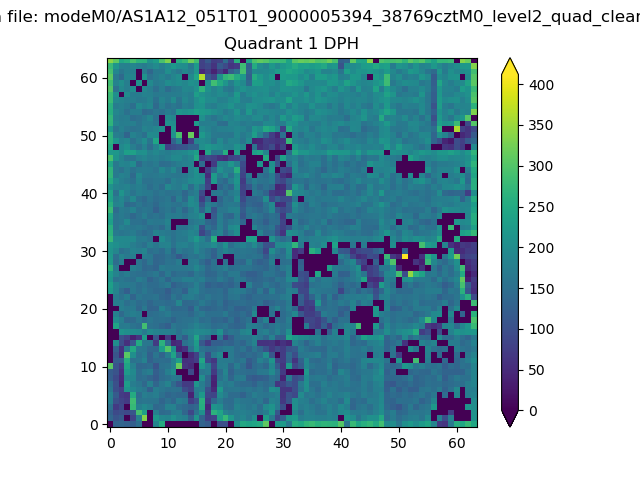 |
Quadrant B |
|---|---|---|---|
| Quadrant D | 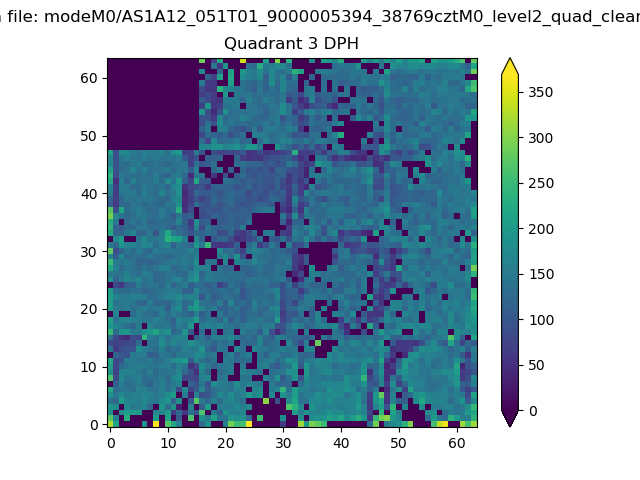 |
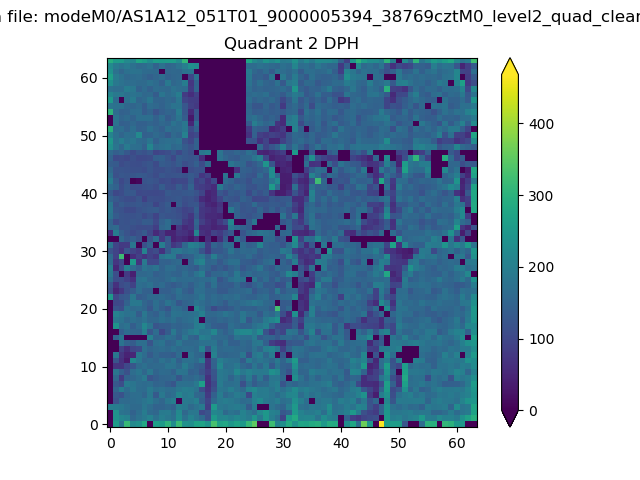 |
Quadrant C |
| Plot type | Count rate plots | Images |
|---|---|---|
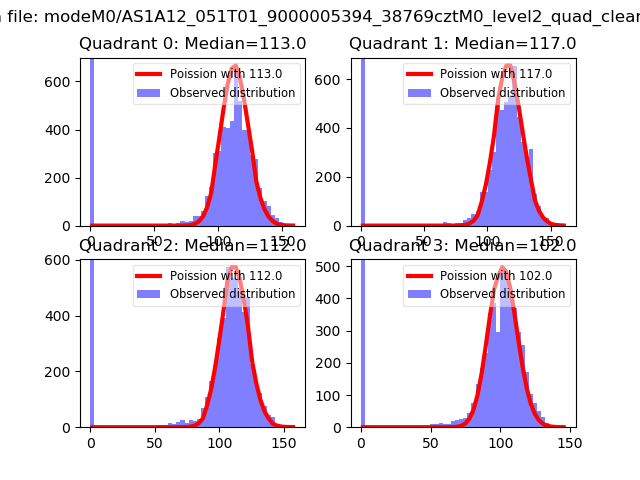
| Comparison with Poisson distribution Blue bars denote a histogram of data divided into 1 sec bins. Red curve is a Poisson curve with rate = median count rate of data. |
 |
 |
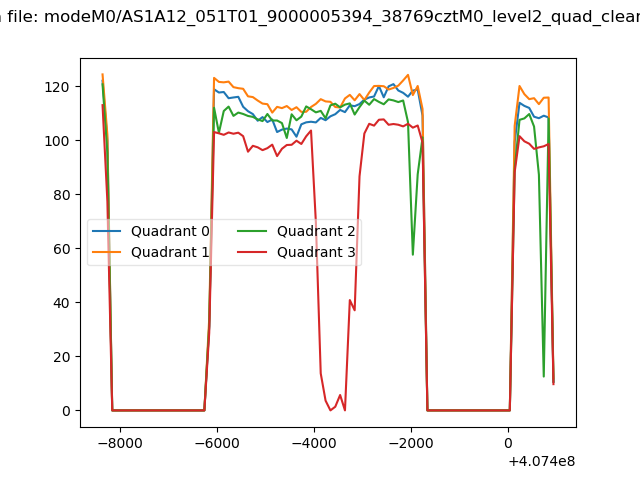
| Quadrant-wise count rates Data is divided into 100 sec bins |
 |
|
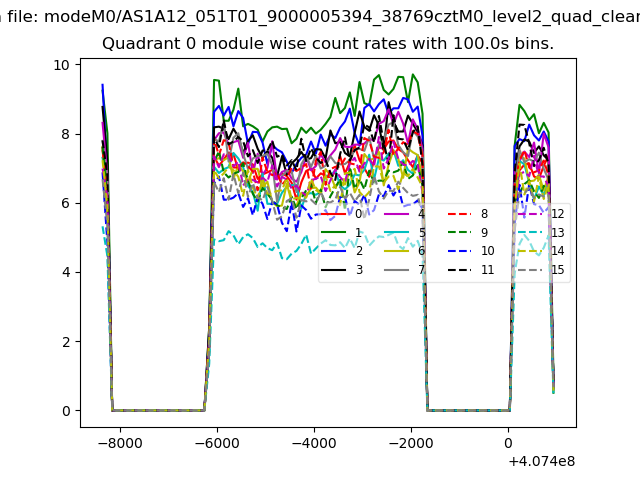
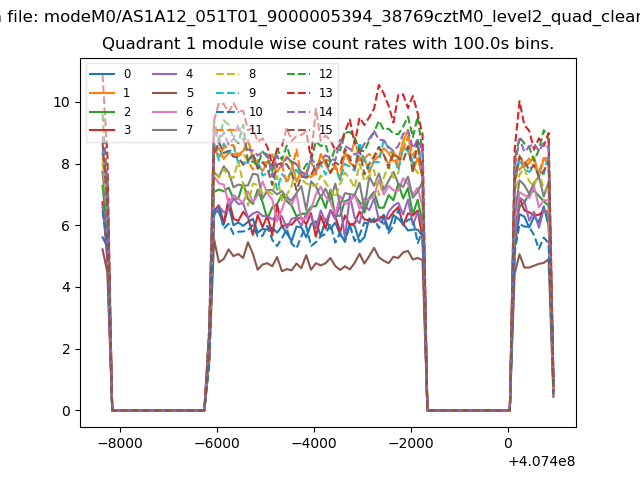
| Module-wise count rates for Quadrant A Data is divided into 100 sec bins |
 |
 |
| Module-wise count rates for Quadrant B Data is divided into 100 sec bins |
 |
 |
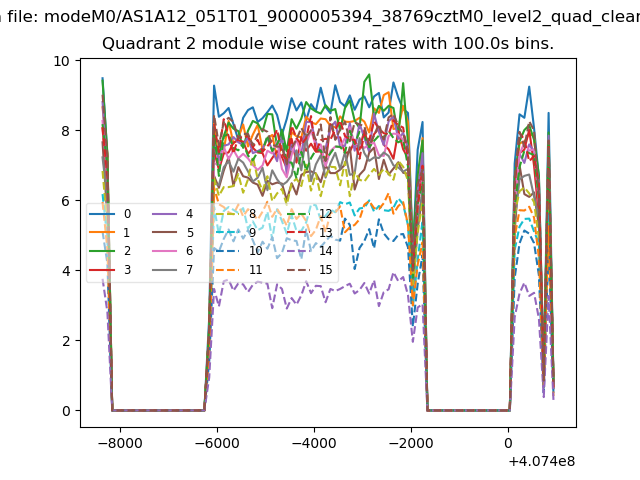
| Module-wise count rates for Quadrant C Data is divided into 100 sec bins |
 |
 |
| Module-wise count rates for Quadrant D Data is divided into 100 sec bins |
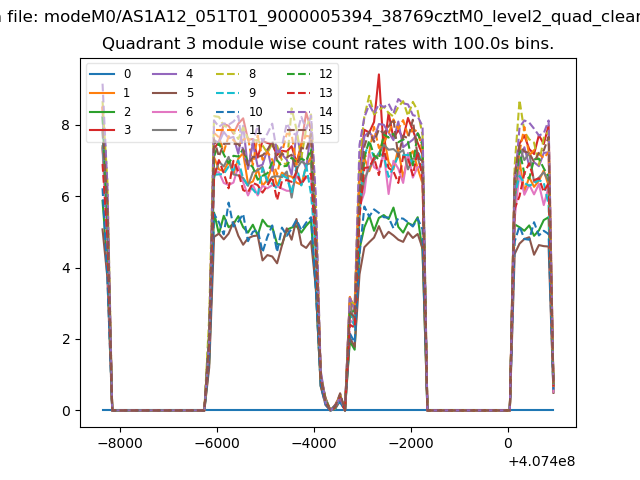 |
 |
| Parameter | Plot |
|---|---|
| CZT HV Monitor | 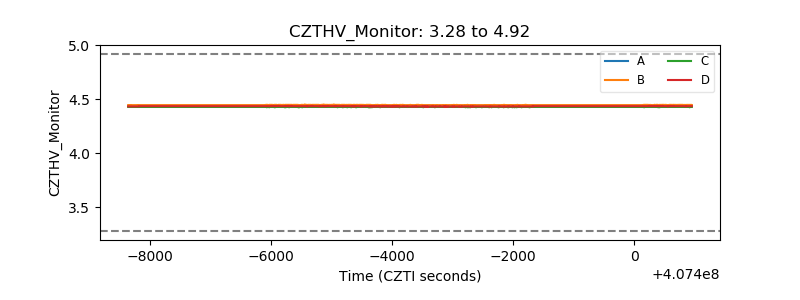 |
| D_VDD | 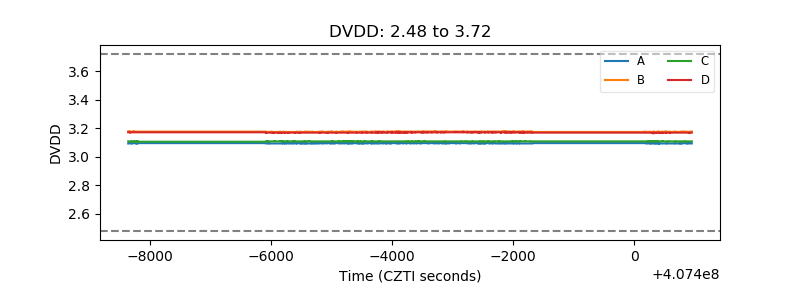 |
| Temperature 1 | 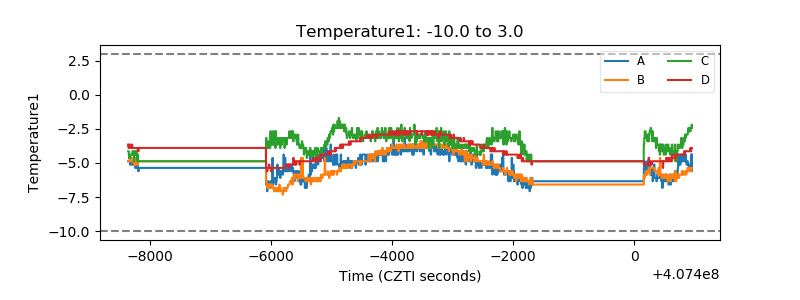 |
| Veto HV Monitor | 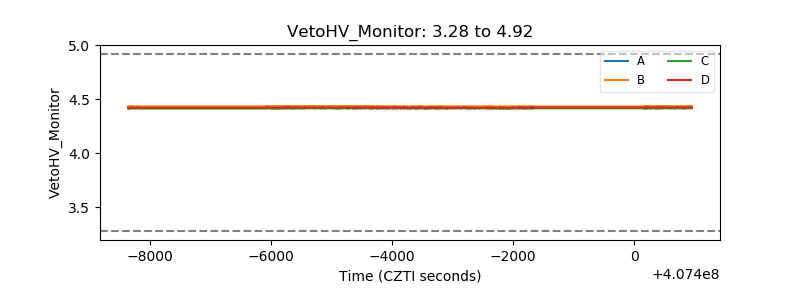 |
| Veto LLD | 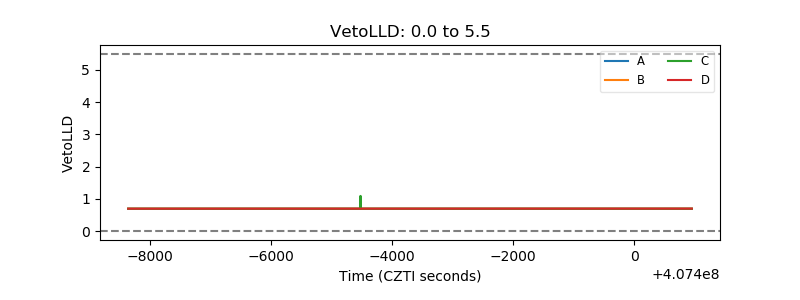 |
| Alpha Counter | 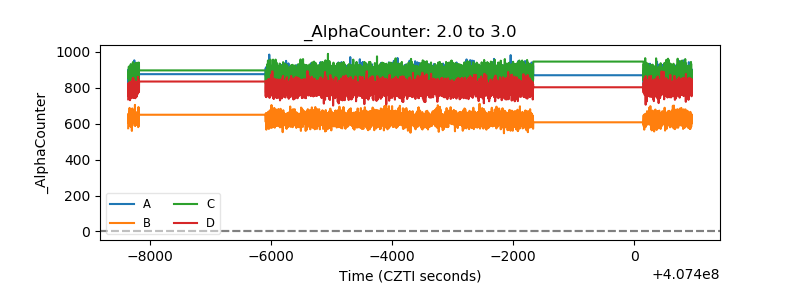 |
| _CPM_Rate | 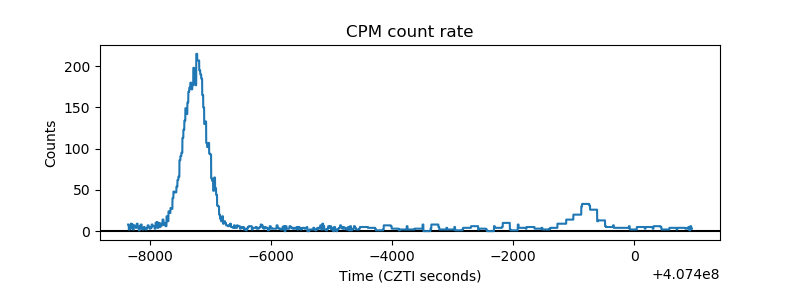 |
| CZT Counter | 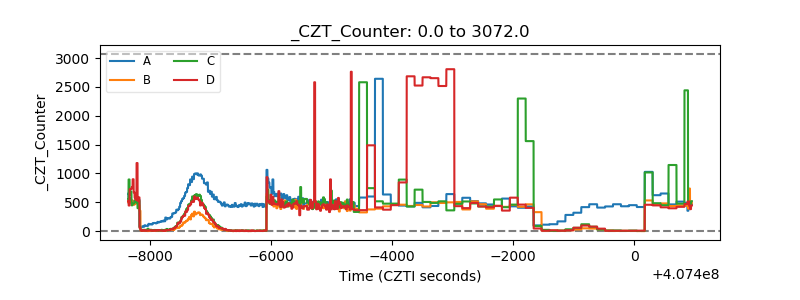 |
| +2.5 Volts monitor | 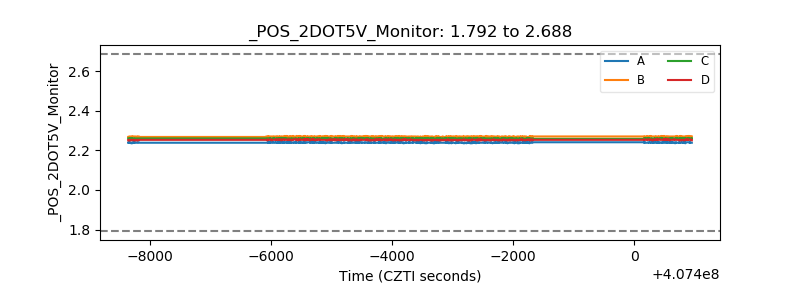 |
| +5 Volts monitor | 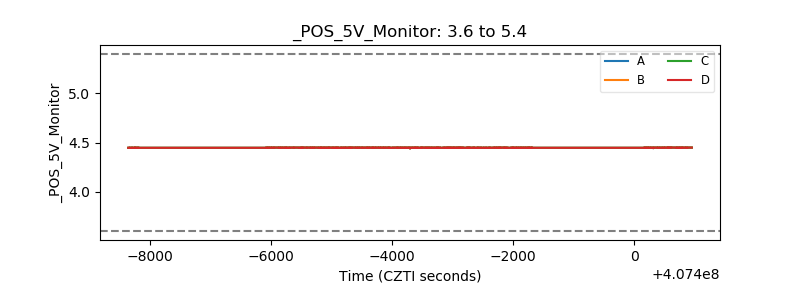 |
| _ROLL_ROT | 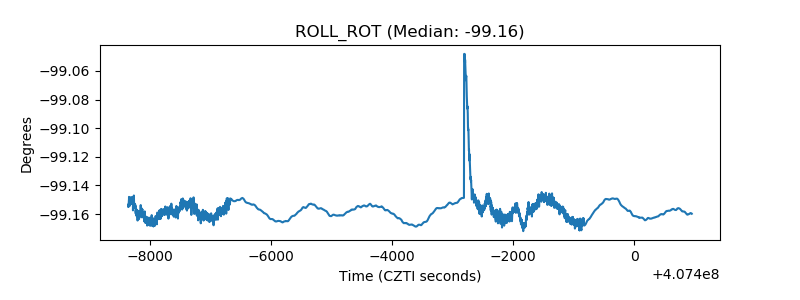 |
| _Roll_DEC | 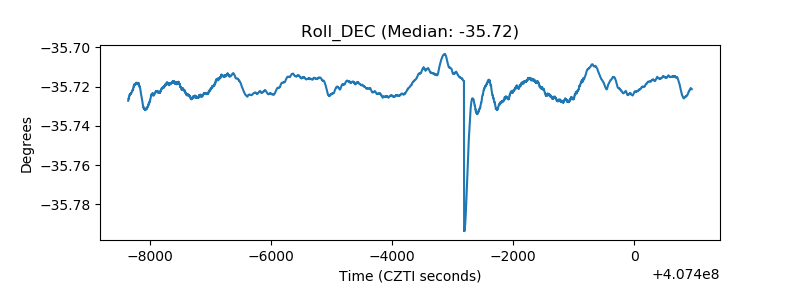 |
| _Roll_RA | 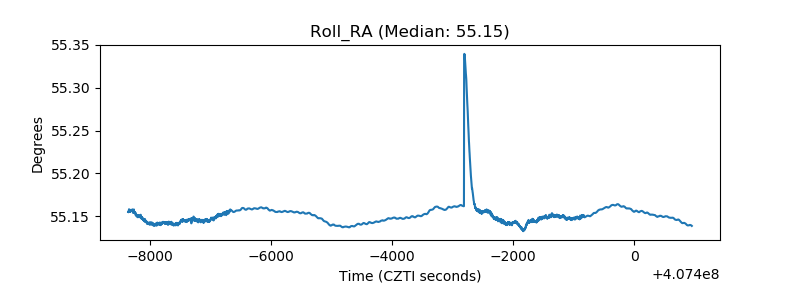 |
| Veto Counter | 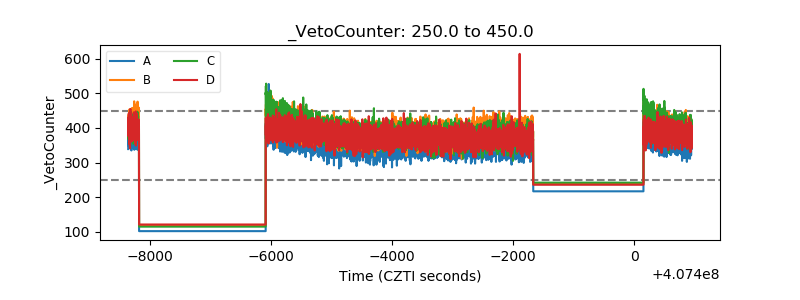 |