| Param | Original file | Final file |
|---|---|---|
| Filename | modeM0/AS1A12_051T01_9000005394_38770cztM0_level2.fits | modeM0/AS1A12_051T01_9000005394_38770cztM0_level2_quad_clean.evt |
| Size (bytes) | 357,134,400 | 105,808,320 |
| Size | 340.6 MB | 100.9 MB |
| Events in quadrant A | 3,185,266 | 709,179 |
| Events in quadrant B | 2,816,485 | 729,906 |
| Events in quadrant C | 3,642,962 | 676,806 |
| Events in quadrant D | 3,081,613 | 645,456 |
| Mode SS | |||
|---|---|---|---|
| Quadrant | BADHDUFLAG | Total packets | Discarded packets |
| A | 0 | 132 | 0 |
| B | 0 | 132 | 0 |
| C | 0 | 132 | 0 |
| D | 0 | 132 | 0 |
| Mode M0 | |||
|---|---|---|---|
| Quadrant | BADHDUFLAG | Total packets | Discarded packets |
| A | 0 | 13362 | 3 |
| B | 0 | 12766 | 2 |
| C | 0 | 14759 | 2 |
| D | 0 | 13584 | 2 |
| Mode M9 | |||
|---|---|---|---|
| Quadrant | BADHDUFLAG | Total packets | Discarded packets |
| A | 0 | 33 | 0 |
| B | 0 | 33 | 0 |
| C | 0 | 33 | 0 |
| D | 0 | 33 | 0 |
| Quadrant | Total seconds | Saturated seconds | Saturation percentage |
|---|---|---|---|
| A | 6338 | 8 | 0.126223% |
| B | 6338 | 10 | 0.157778% |
| C | 6338 | 228 | 3.597349% |
| D | 6338 | 23 | 0.362891% |
Noise dominated data is calculated using 1-second bins in cleaned event files. If a bin has >2000 counts, and if more than 50% of those come from <1% of pixels, then it is considered to be noise-dominated and hence unusable.
| Quadrant | # 1 sec bins | Bins with >0 counts | Bins with >2000 counts | High rate bins dominated by noise | Noise dominated (total time) | Noise dominated (detector-on time) | Marked lightcurve |
|---|---|---|---|---|---|---|---|
| A | 9653 | 6340 | 4 | 4 | 0.04% | 0.06% | 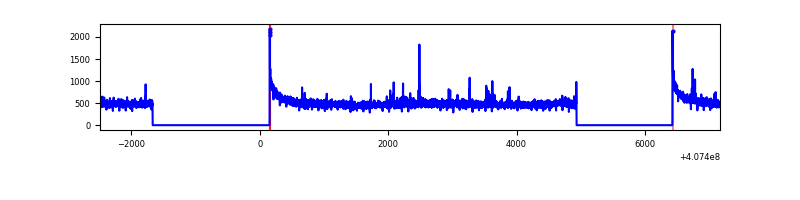 |
| B | 9653 | 6340 | 1 | 1 | 0.01% | 0.02% | 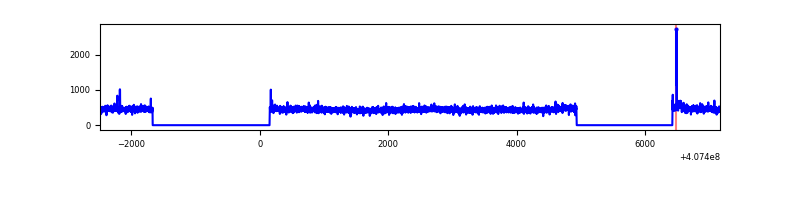 |
| C | 9653 | 6340 | 202 | 202 | 2.09% | 3.19% | 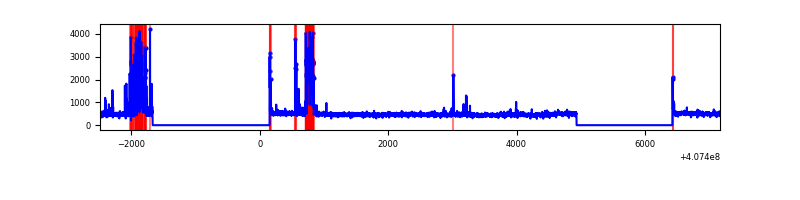 |
| D | 9653 | 6340 | 18 | 18 | 0.19% | 0.28% | 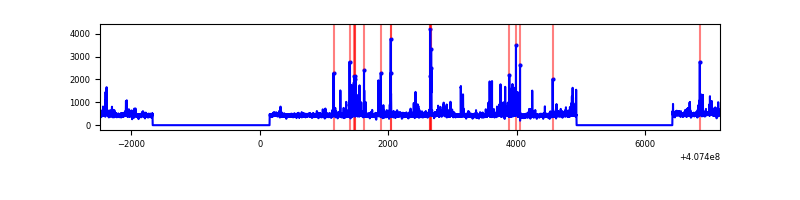 |
Top three noisy pixels from each quadrant. If the there are fewer than three noisy pixels in the level2.evt file, extra rows are filled as -1
| Pixel properties | Quadrant properties | ||||||
|---|---|---|---|---|---|---|---|
| Quadrant | DetID | PixID | Counts | Sigma | Mean | Median | Sigma |
| A | 10 | 83 | 430108 | 3022.77 | 700 | 687 | 142.1 |
| A | 13 | 248 | 40212 | 278.22 | 700 | 687 | 142.1 |
| A | 13 | 254 | 9603 | 62.76 | 700 | 687 | 142.1 |
| B | 0 | 230 | 25991 | 186.42 | 701 | 683 | 135.8 |
| B | 12 | 111 | 17676 | 125.17 | 701 | 683 | 135.8 |
| B | 11 | 111 | 16246 | 114.64 | 701 | 683 | 135.8 |
| C | 0 | 239 | 383496 | 2431.02 | 672 | 676 | 157.5 |
| C | 14 | 254 | 328403 | 2081.16 | 672 | 676 | 157.5 |
| C | 15 | 214 | 275792 | 1747.07 | 672 | 676 | 157.5 |
| D | 5 | 222 | 136635 | 817.55 | 683 | 664 | 166.3 |
| D | 2 | 250 | 135134 | 808.52 | 683 | 664 | 166.3 |
| D | 12 | 227 | 72000 | 428.92 | 683 | 664 | 166.3 |
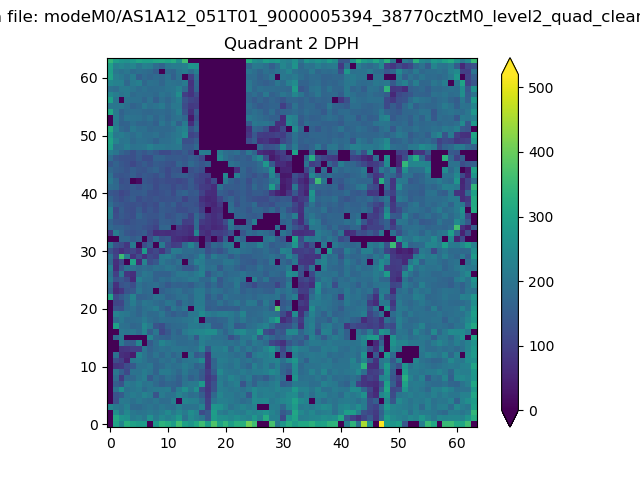
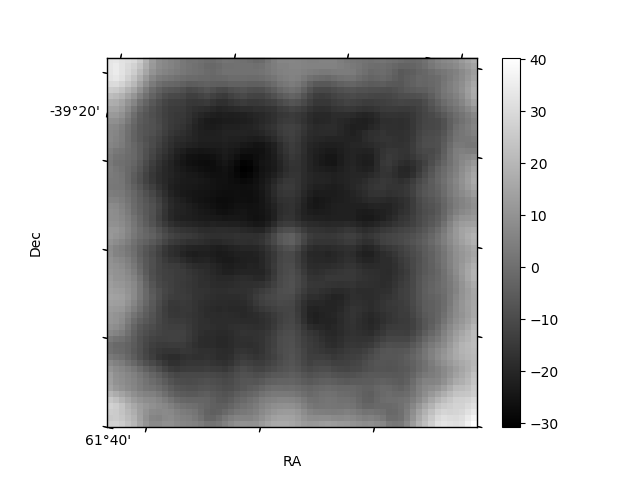
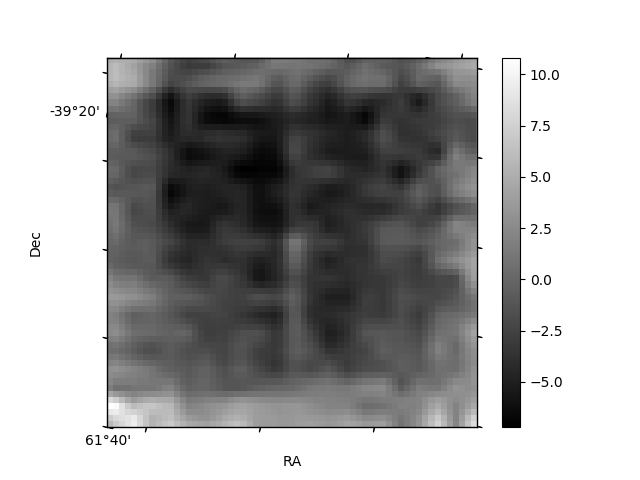
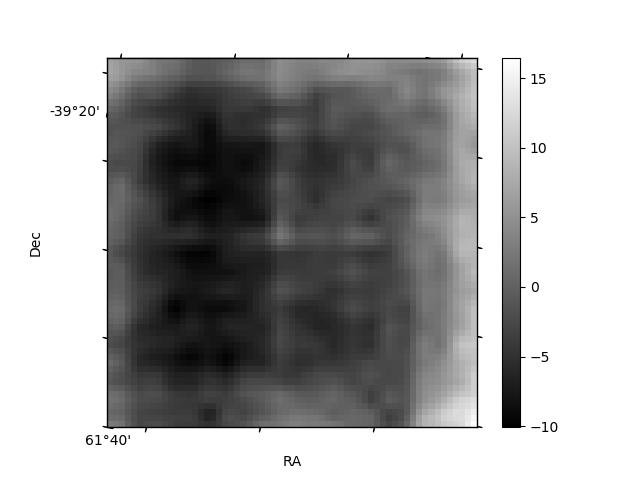
Histogram calculated using DETX and DETY for each event in the final _common_clean file
| Quadrant A | 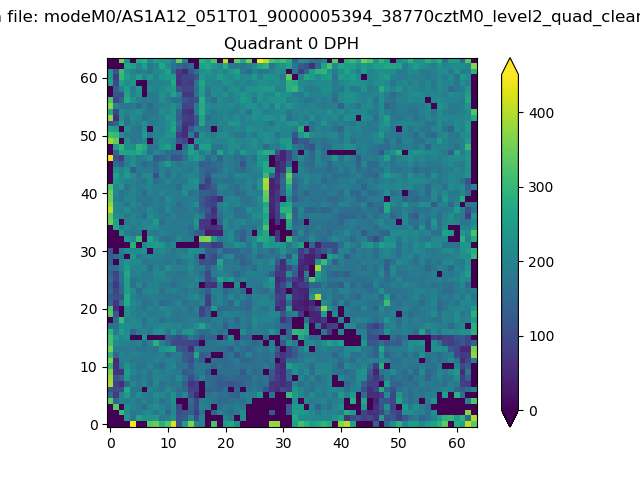 |
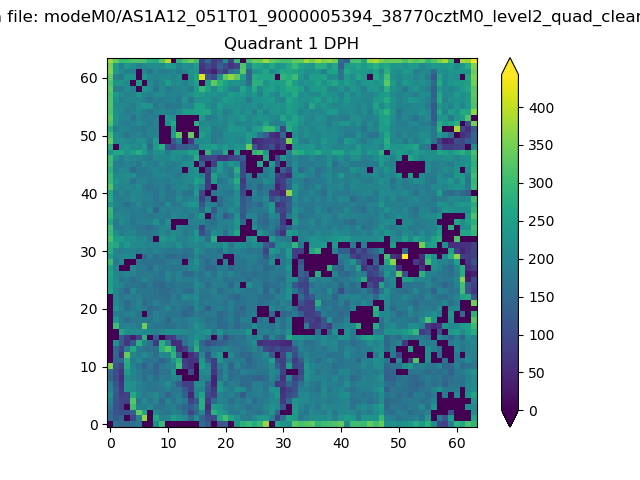 |
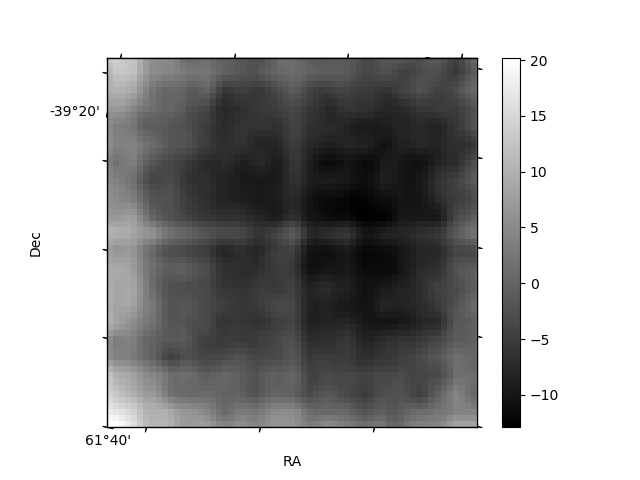
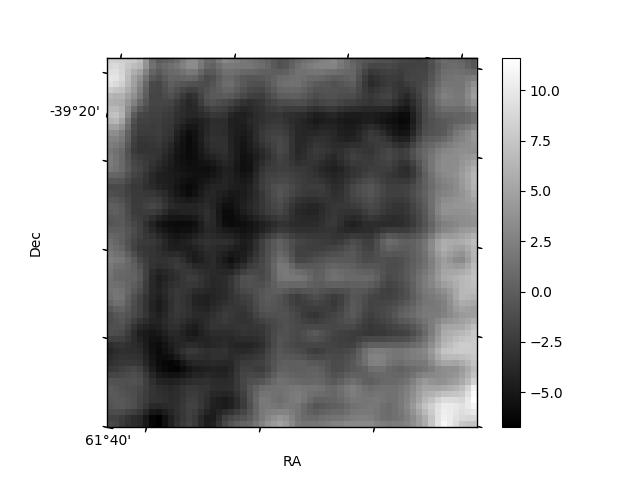
Quadrant B |
|---|---|---|---|
| Quadrant D | 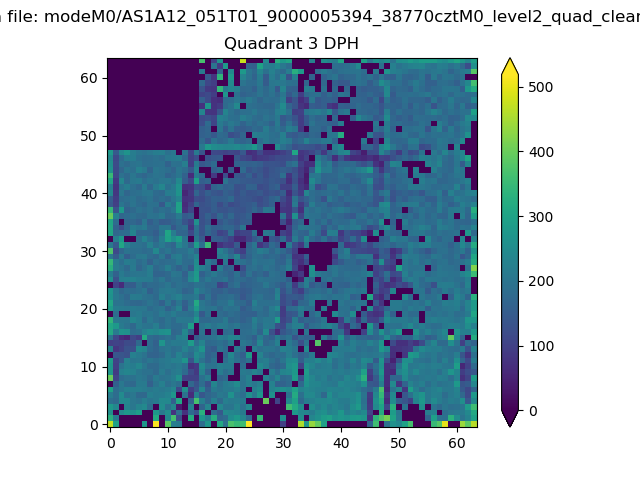 |
 |
Quadrant C |
| Plot type | Count rate plots | Images |
|---|---|---|
| Comparison with Poisson distribution Blue bars denote a histogram of data divided into 1 sec bins. Red curve is a Poisson curve with rate = median count rate of data. |
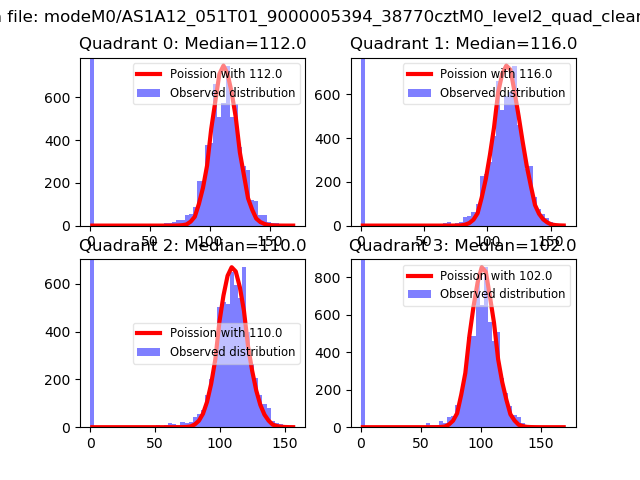 |
 |
| Quadrant-wise count rates Data is divided into 100 sec bins |
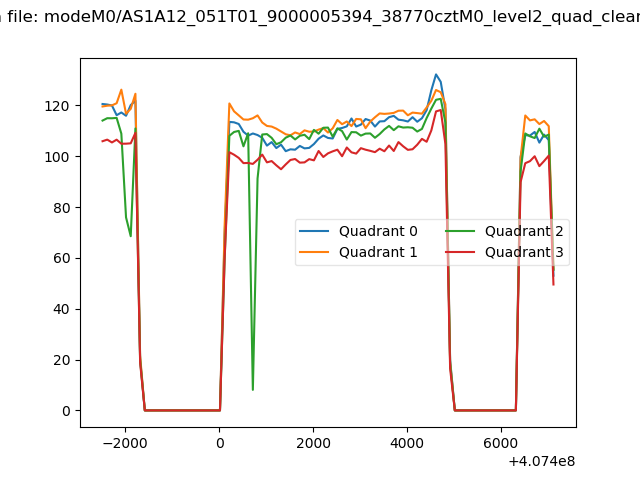 |
|
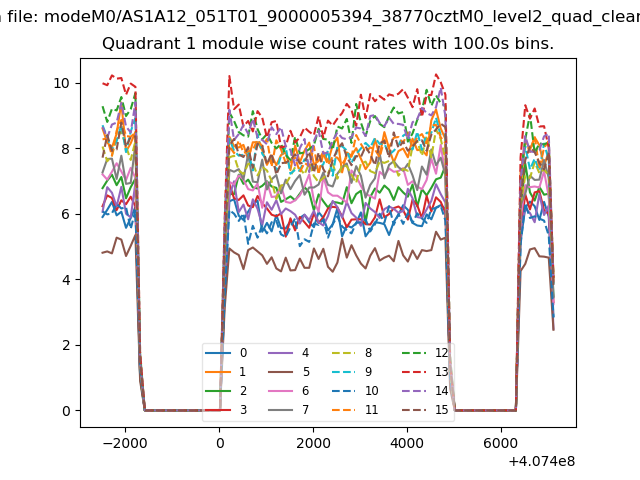
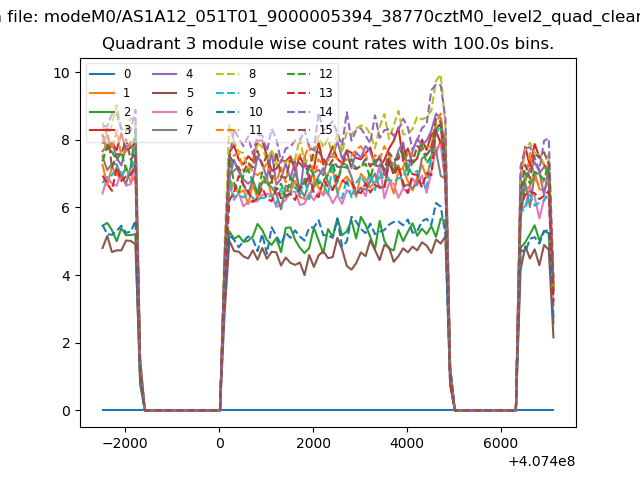
| Module-wise count rates for Quadrant A Data is divided into 100 sec bins |
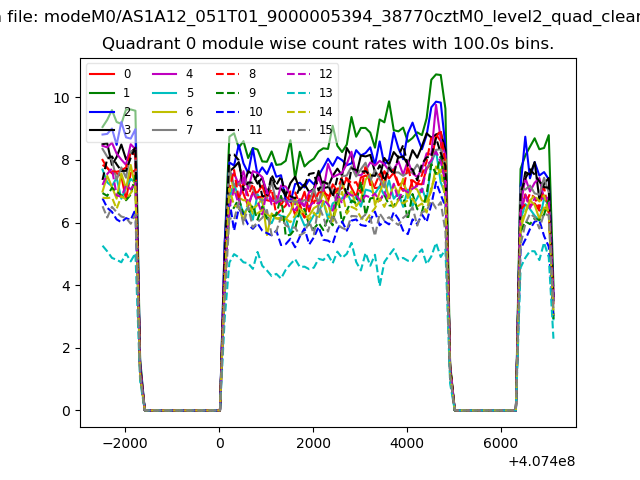 |
 |
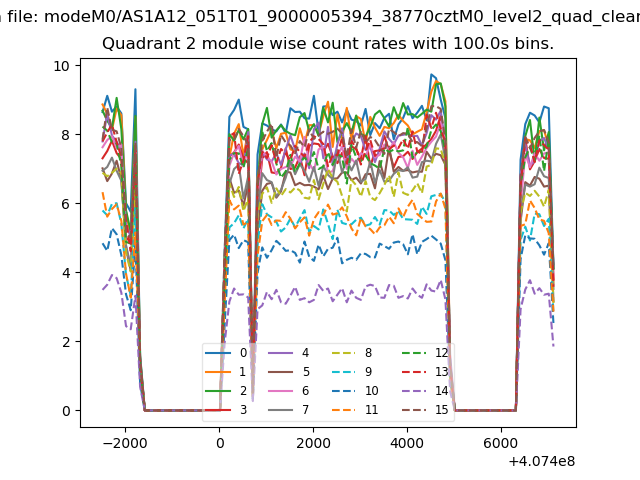
| Module-wise count rates for Quadrant B Data is divided into 100 sec bins |
 |
 |
| Module-wise count rates for Quadrant C Data is divided into 100 sec bins |
 |
 |
| Module-wise count rates for Quadrant D Data is divided into 100 sec bins |
 |
 |
| Parameter | Plot |
|---|---|
| CZT HV Monitor | 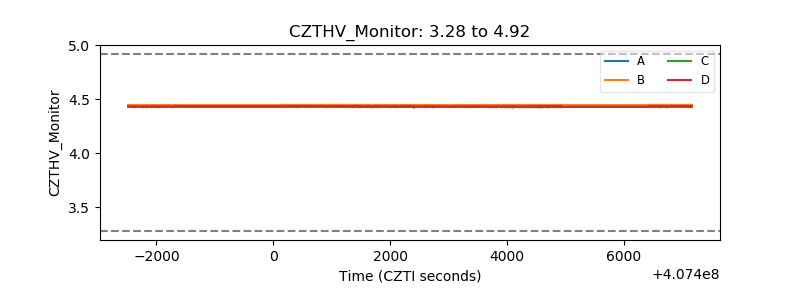 |
| D_VDD | 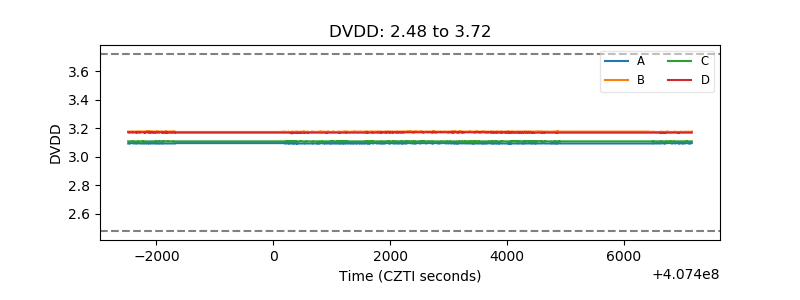 |
| Temperature 1 | 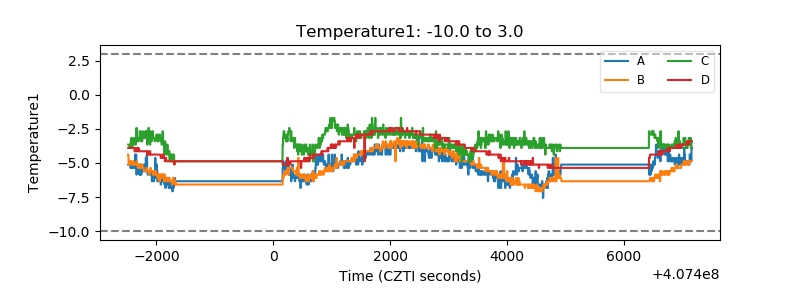 |
| Veto HV Monitor | 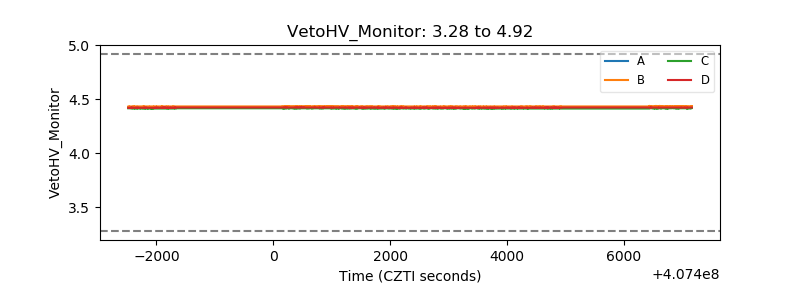 |
| Veto LLD | 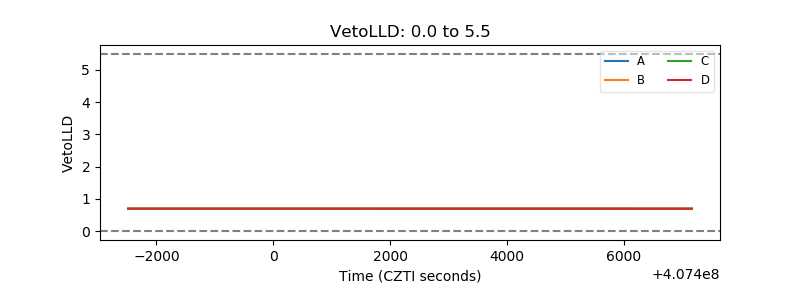 |
| Alpha Counter | 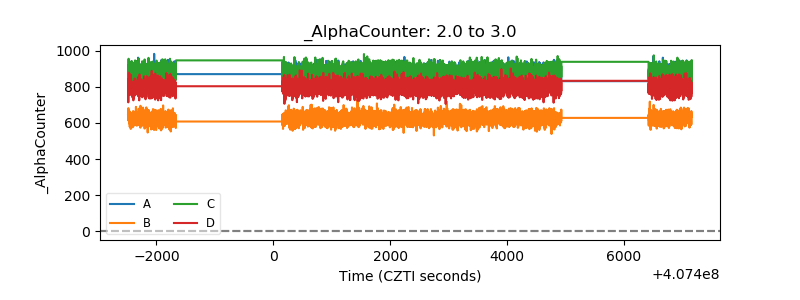 |
| _CPM_Rate | 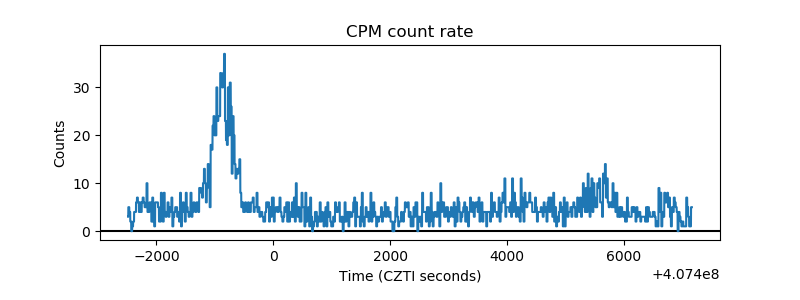 |
| CZT Counter | 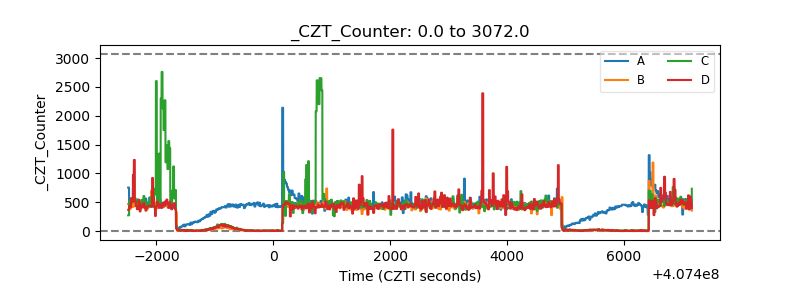 |
| +2.5 Volts monitor | 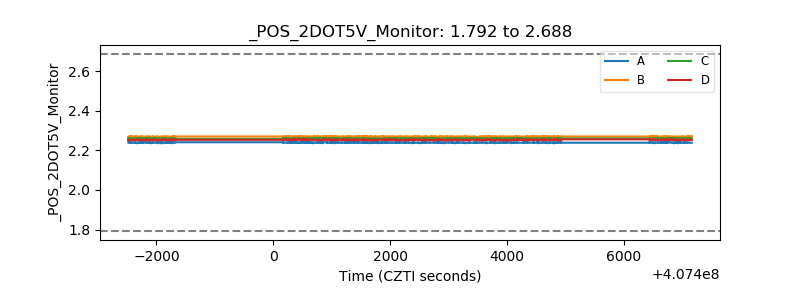 |
| +5 Volts monitor |  |
| _ROLL_ROT | 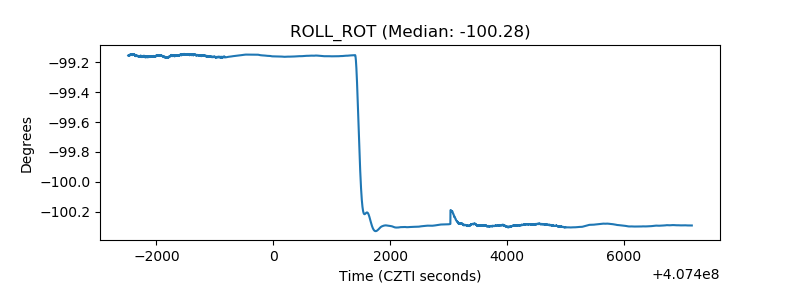 |
| _Roll_DEC | 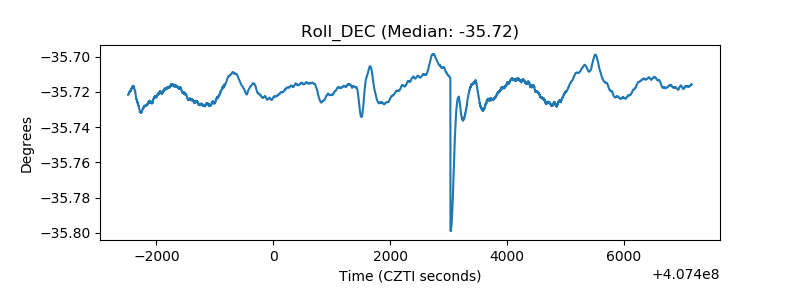 |
| _Roll_RA | 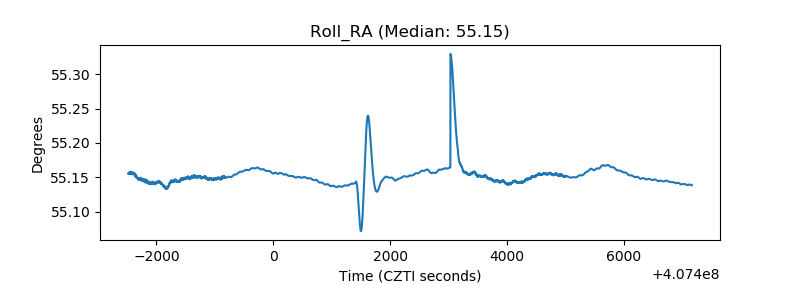 |
| Veto Counter | 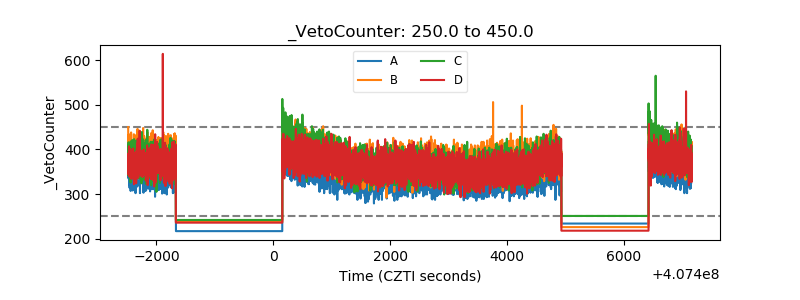 |