| Param | Original file | Final file |
|---|---|---|
| Filename | modeM0/AS1A12_051T01_9000005394_38771cztM0_level2.fits | modeM0/AS1A12_051T01_9000005394_38771cztM0_level2_quad_clean.evt |
| Size (bytes) | 343,992,960 | 95,869,440 |
| Size | 328.1 MB | 91.4 MB |
| Events in quadrant A | 3,016,751 | 639,337 |
| Events in quadrant B | 2,922,149 | 653,853 |
| Events in quadrant C | 2,809,091 | 634,959 |
| Events in quadrant D | 3,529,013 | 565,753 |
| Mode SS | |||
|---|---|---|---|
| Quadrant | BADHDUFLAG | Total packets | Discarded packets |
| A | 0 | 118 | 0 |
| B | 0 | 118 | 0 |
| C | 0 | 118 | 0 |
| D | 0 | 118 | 0 |
| Mode M0 | |||
|---|---|---|---|
| Quadrant | BADHDUFLAG | Total packets | Discarded packets |
| A | 0 | 12589 | 3 |
| B | 0 | 12734 | 2 |
| C | 0 | 11958 | 2 |
| D | 0 | 14447 | 2 |
| Mode M9 | |||
|---|---|---|---|
| Quadrant | BADHDUFLAG | Total packets | Discarded packets |
| A | 0 | 24 | 0 |
| B | 0 | 24 | 0 |
| C | 0 | 24 | 0 |
| D | 0 | 25 | 0 |
| Quadrant | Total seconds | Saturated seconds | Saturation percentage |
|---|---|---|---|
| A | 5857 | 23 | 0.392693% |
| B | 5857 | 100 | 1.707359% |
| C | 5857 | 14 | 0.239030% |
| D | 5857 | 233 | 3.978146% |
Noise dominated data is calculated using 1-second bins in cleaned event files. If a bin has >2000 counts, and if more than 50% of those come from <1% of pixels, then it is considered to be noise-dominated and hence unusable.
| Quadrant | # 1 sec bins | Bins with >0 counts | Bins with >2000 counts | High rate bins dominated by noise | Noise dominated (total time) | Noise dominated (detector-on time) | Marked lightcurve |
|---|---|---|---|---|---|---|---|
| A | 7169 | 5858 | 4 | 4 | 0.06% | 0.07% | 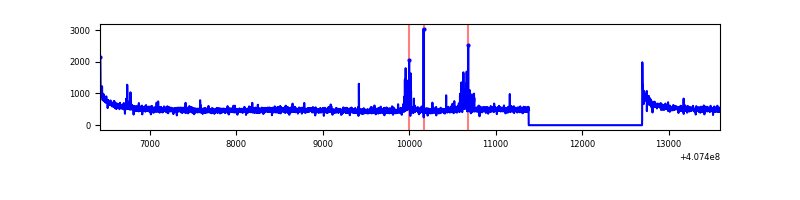 |
| B | 7169 | 5858 | 56 | 56 | 0.78% | 0.96% | 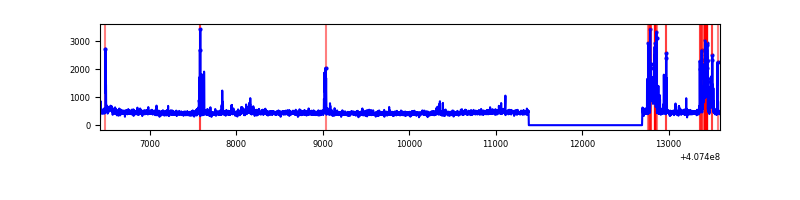 |
| C | 7169 | 5858 | 4 | 4 | 0.06% | 0.07% | 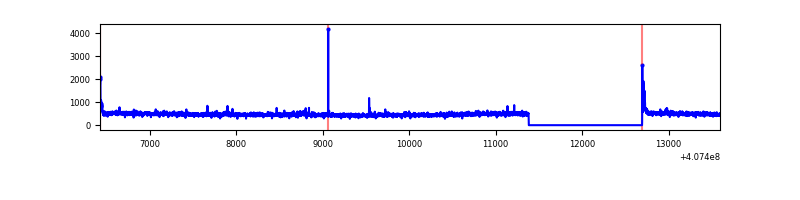 |
| D | 7169 | 5858 | 205 | 205 | 2.86% | 3.50% | 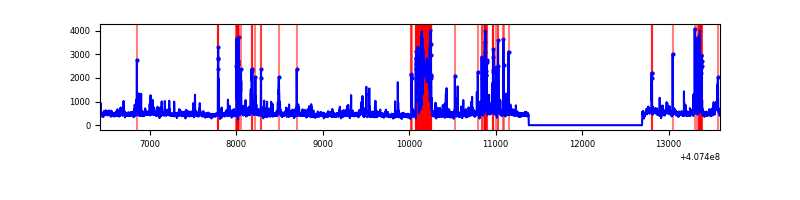 |
Top three noisy pixels from each quadrant. If the there are fewer than three noisy pixels in the level2.evt file, extra rows are filled as -1
| Pixel properties | Quadrant properties | ||||||
|---|---|---|---|---|---|---|---|
| Quadrant | DetID | PixID | Counts | Sigma | Mean | Median | Sigma |
| A | 10 | 83 | 413144 | 3121.55 | 646 | 632 | 132.1 |
| A | 13 | 248 | 97404 | 732.29 | 646 | 632 | 132.1 |
| A | 13 | 254 | 8172 | 57.06 | 646 | 632 | 132.1 |
| B | 4 | 171 | 322994 | 2578.93 | 639 | 621 | 125.0 |
| B | 5 | 172 | 31818 | 249.57 | 639 | 621 | 125.0 |
| B | 0 | 230 | 22375 | 174.03 | 639 | 621 | 125.0 |
| C | 15 | 214 | 263060 | 1760.54 | 634 | 638 | 149.1 |
| C | 0 | 10 | 40787 | 269.35 | 634 | 638 | 149.1 |
| C | 0 | 239 | 30324 | 199.16 | 634 | 638 | 149.1 |
| D | 2 | 250 | 625102 | 4123.14 | 618 | 601 | 151.5 |
| D | 10 | 118 | 220831 | 1454.02 | 618 | 601 | 151.5 |
| D | 5 | 222 | 160252 | 1054.06 | 618 | 601 | 151.5 |
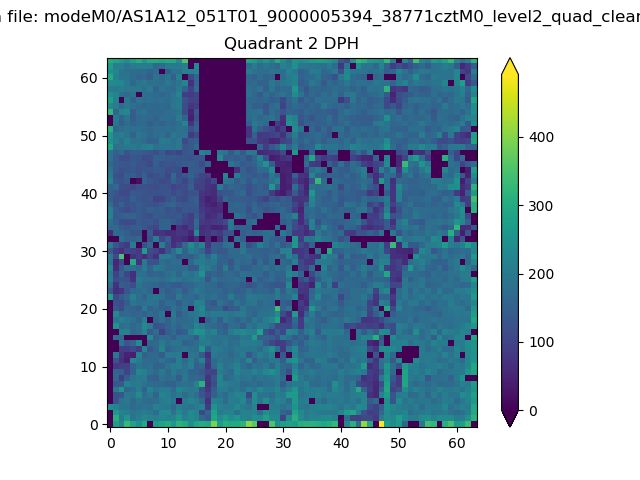
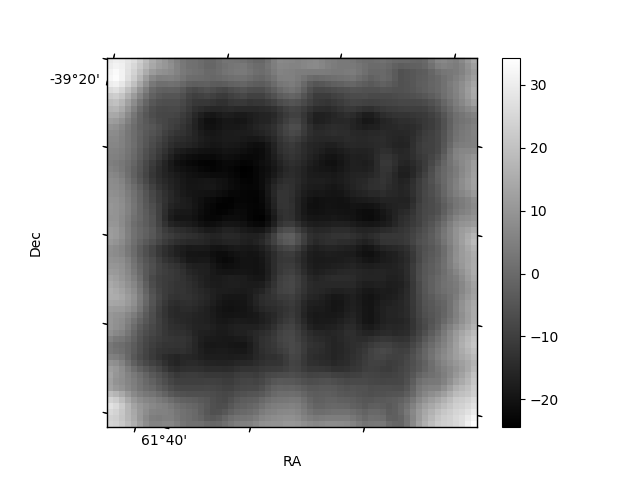
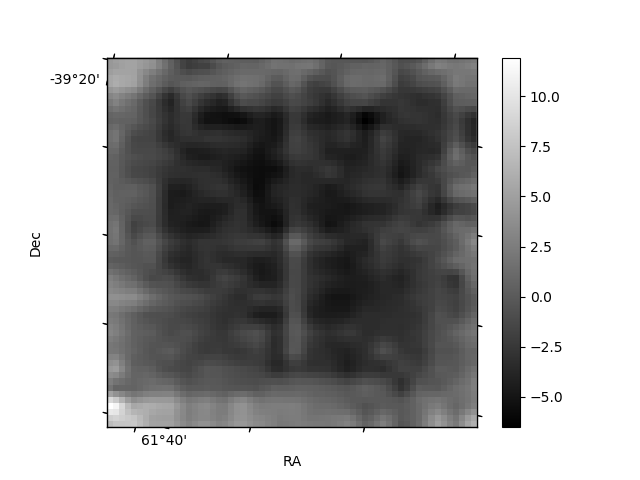
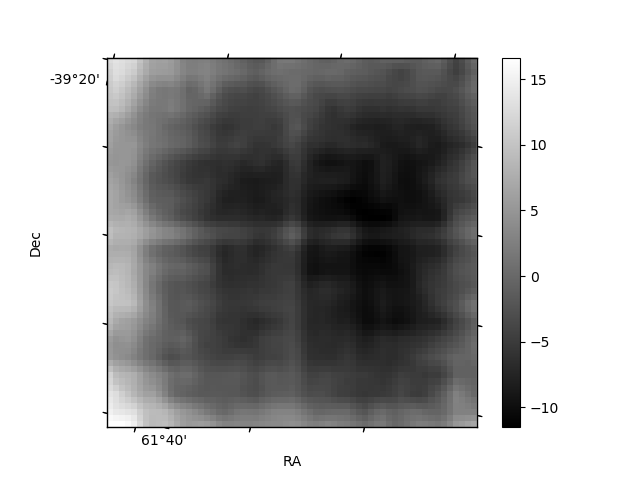
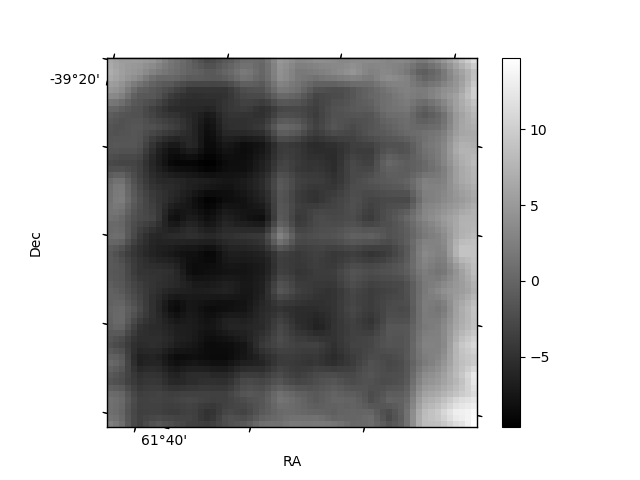
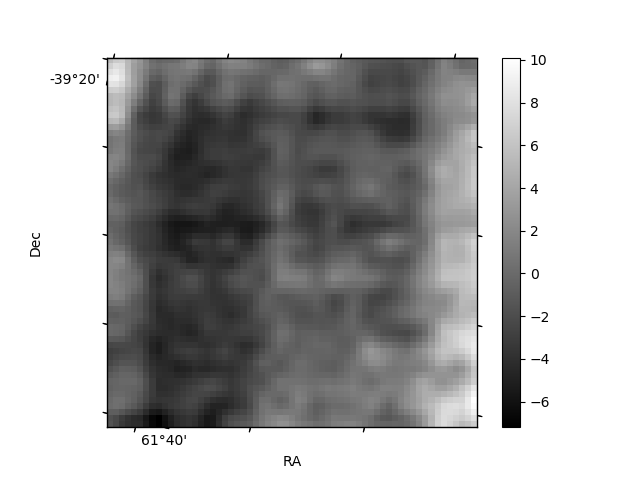
Histogram calculated using DETX and DETY for each event in the final _common_clean file
| Quadrant A | 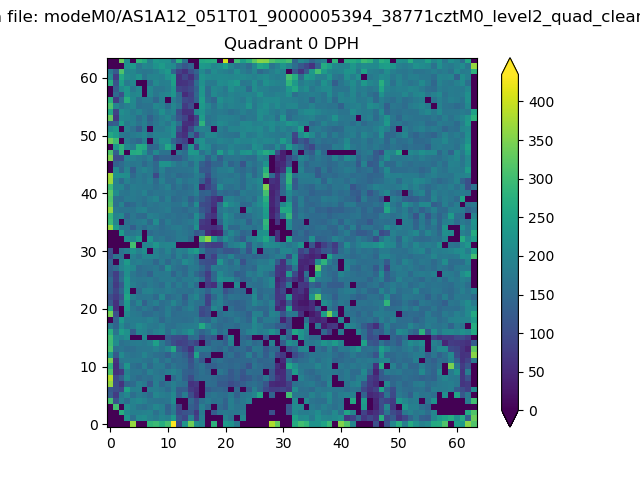 |
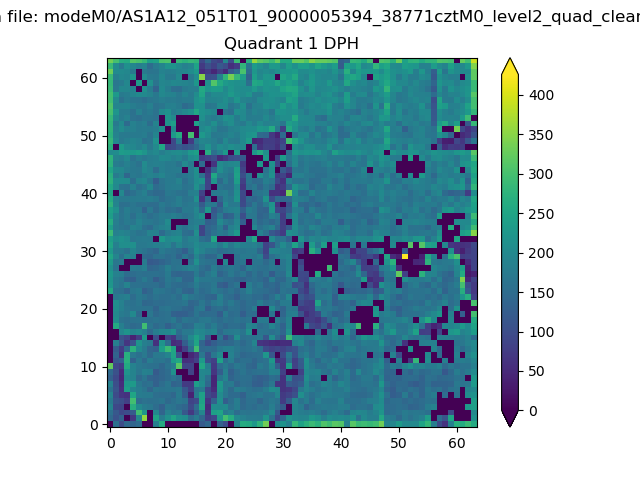 |
Quadrant B |
|---|---|---|---|
| Quadrant D | 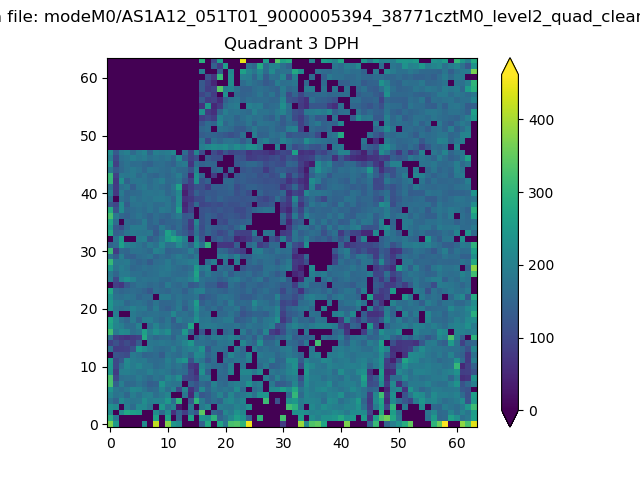 |
 |
Quadrant C |
| Plot type | Count rate plots | Images |
|---|---|---|
| Comparison with Poisson distribution Blue bars denote a histogram of data divided into 1 sec bins. Red curve is a Poisson curve with rate = median count rate of data. |
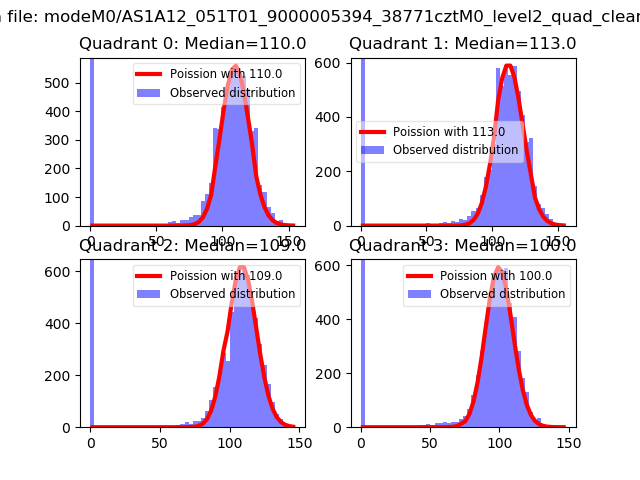 |
 |
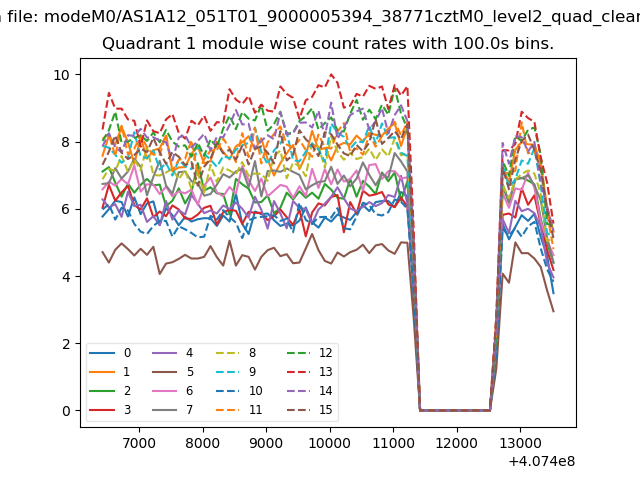
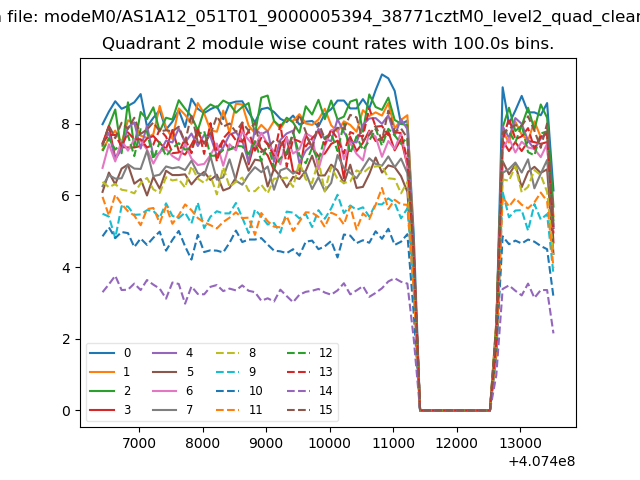
| Quadrant-wise count rates Data is divided into 100 sec bins |
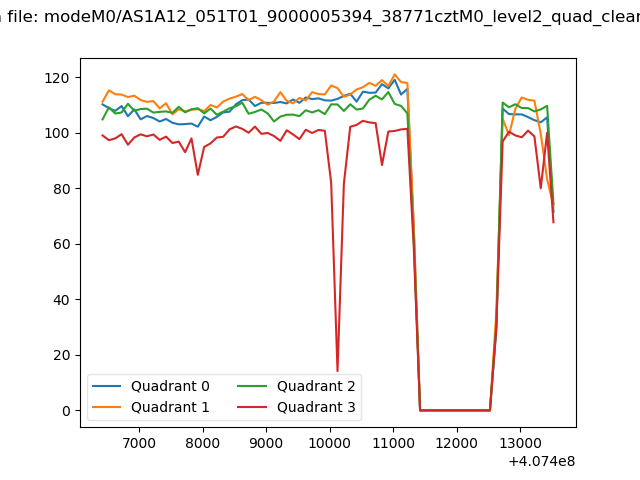 |
|
| Module-wise count rates for Quadrant A Data is divided into 100 sec bins |
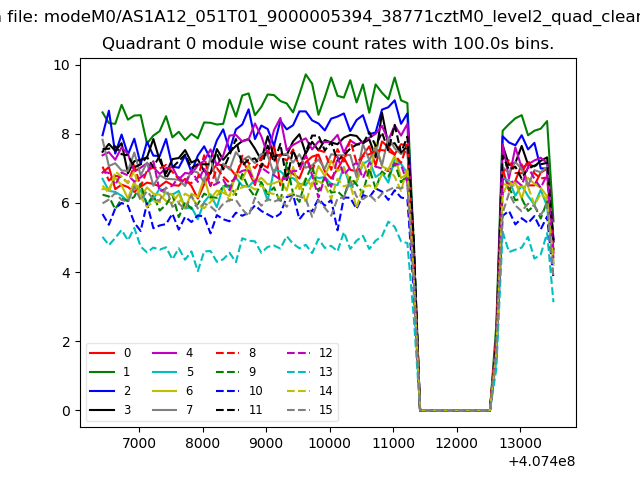 |
 |
| Module-wise count rates for Quadrant B Data is divided into 100 sec bins |
 |
 |
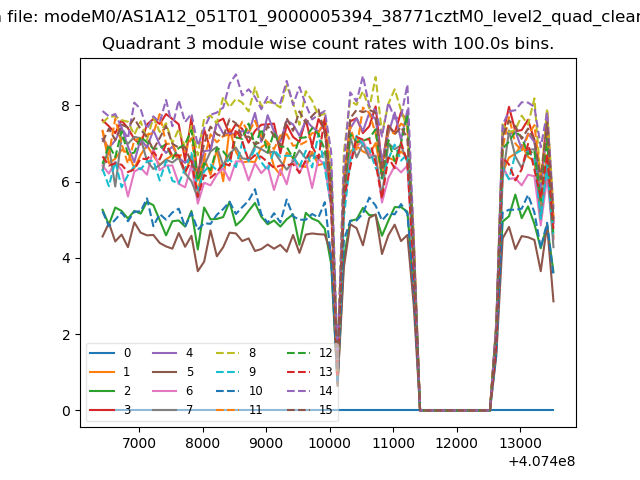
| Module-wise count rates for Quadrant C Data is divided into 100 sec bins |
 |
 |
| Module-wise count rates for Quadrant D Data is divided into 100 sec bins |
 |
 |
| Parameter | Plot |
|---|---|
| CZT HV Monitor | 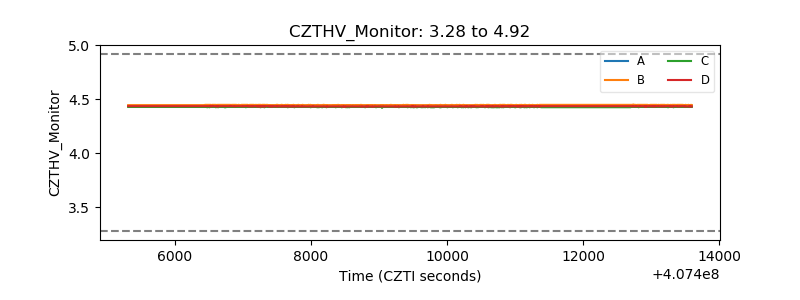 |
| D_VDD | 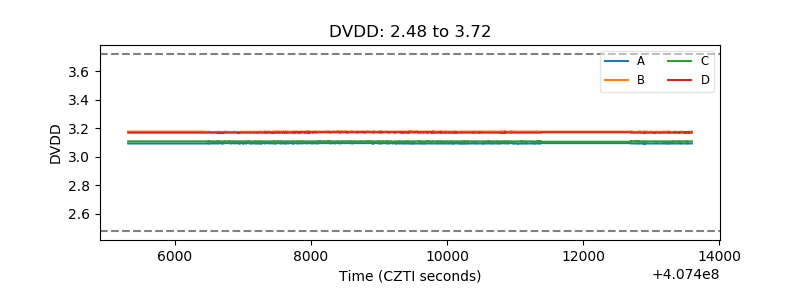 |
| Temperature 1 | 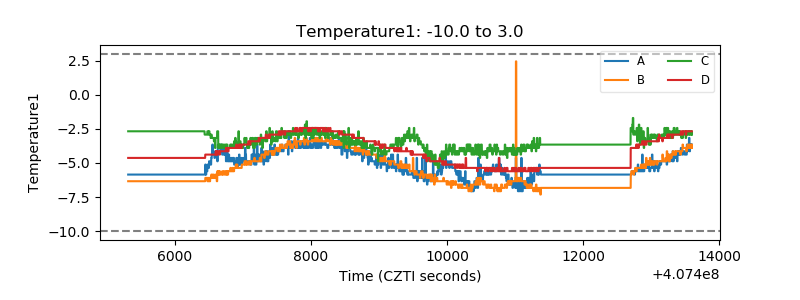 |
| Veto HV Monitor | 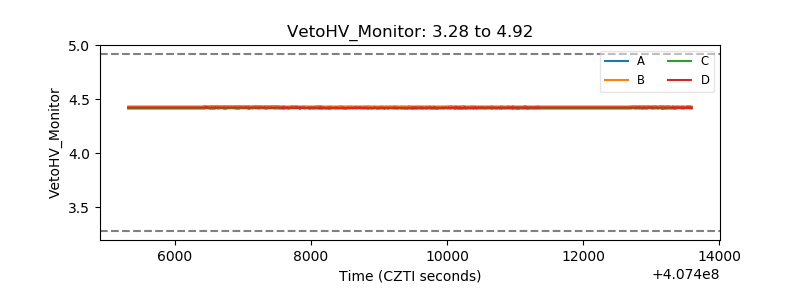 |
| Veto LLD | 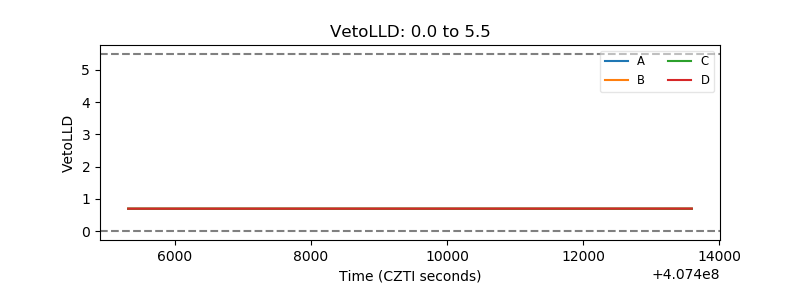 |
| Alpha Counter | 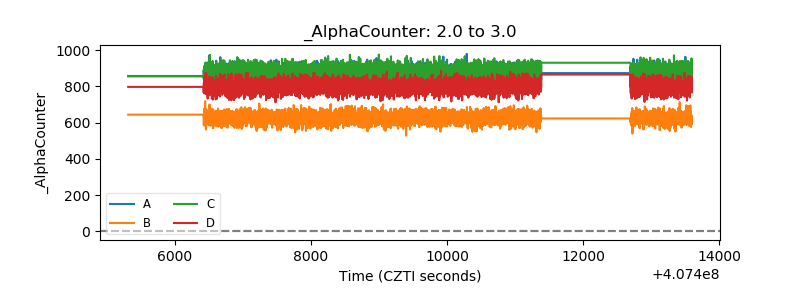 |
| _CPM_Rate | 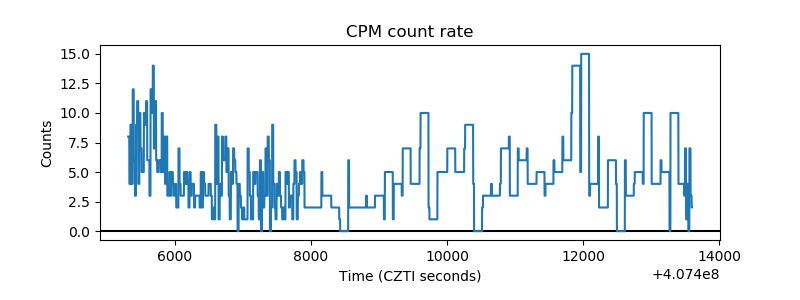 |
| CZT Counter | 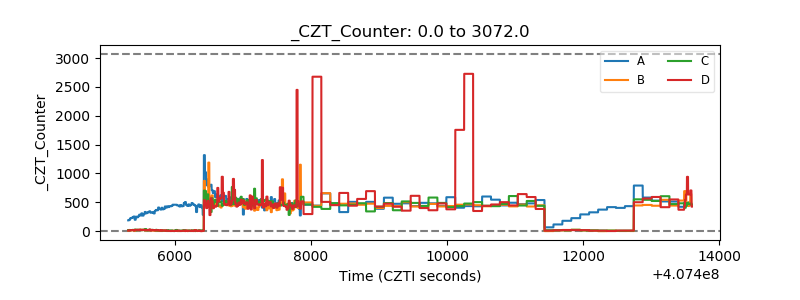 |
| +2.5 Volts monitor | 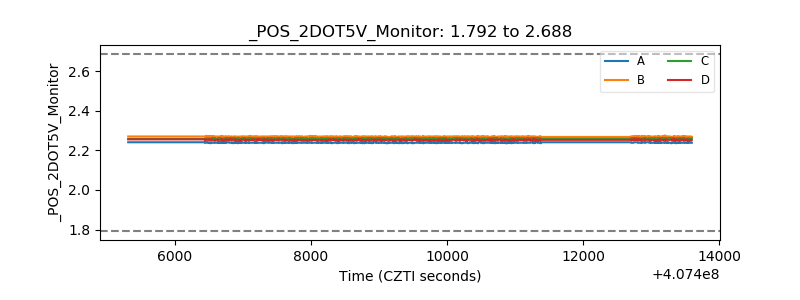 |
| +5 Volts monitor | 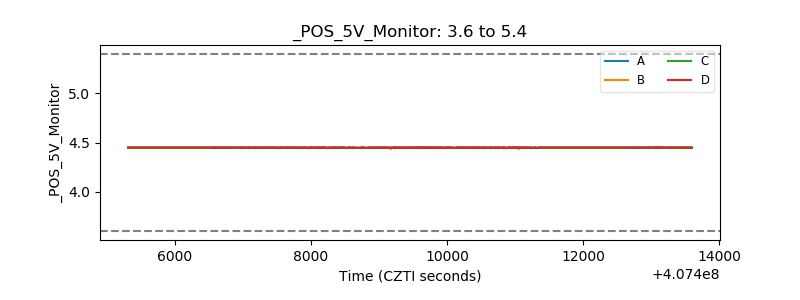 |
| _ROLL_ROT | 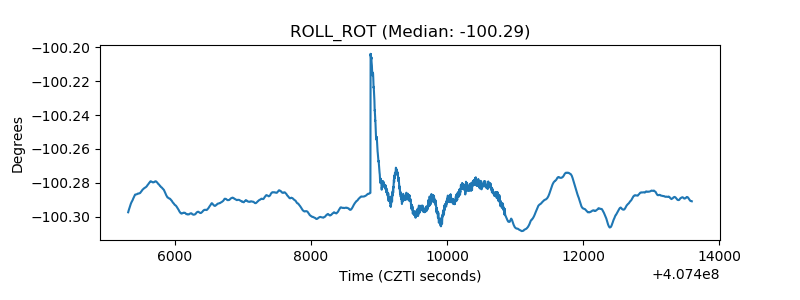 |
| _Roll_DEC | 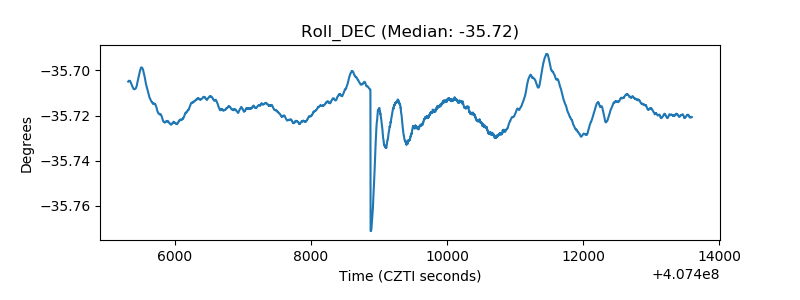 |
| _Roll_RA | 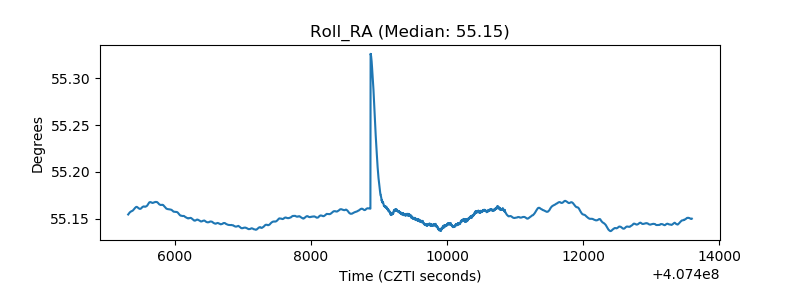 |
| Veto Counter | 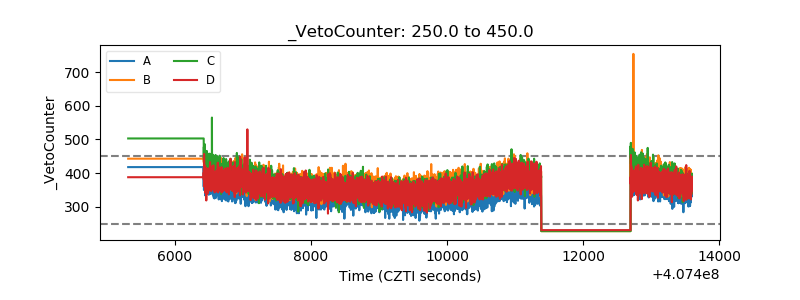 |