| Param | Original file | Final file |
|---|---|---|
| Filename | modeM0/AS1A12_051T01_9000005394_38772cztM0_level2.fits | modeM0/AS1A12_051T01_9000005394_38772cztM0_level2_quad_clean.evt |
| Size (bytes) | 304,992,000 | 89,061,120 |
| Size | 290.9 MB | 84.9 MB |
| Events in quadrant A | 2,741,667 | 594,074 |
| Events in quadrant B | 2,745,946 | 603,345 |
| Events in quadrant C | 2,592,346 | 585,190 |
| Events in quadrant D | 2,789,724 | 536,839 |
| Mode SS | |||
|---|---|---|---|
| Quadrant | BADHDUFLAG | Total packets | Discarded packets |
| A | 0 | 112 | 0 |
| B | 0 | 112 | 0 |
| C | 0 | 112 | 0 |
| D | 0 | 112 | 0 |
| Mode M0 | |||
|---|---|---|---|
| Quadrant | BADHDUFLAG | Total packets | Discarded packets |
| A | 0 | 11480 | 1 |
| B | 0 | 11893 | 1 |
| C | 0 | 11068 | 1 |
| D | 0 | 12138 | 1 |
| Mode M9 | |||
|---|---|---|---|
| Quadrant | BADHDUFLAG | Total packets | Discarded packets |
| A | 0 | 22 | 0 |
| B | 0 | 21 | 0 |
| C | 0 | 21 | 0 |
| D | 0 | 21 | 0 |
| Quadrant | Total seconds | Saturated seconds | Saturation percentage |
|---|---|---|---|
| A | 5386 | 34 | 0.631266% |
| B | 5386 | 125 | 2.320832% |
| C | 5386 | 14 | 0.259933% |
| D | 5386 | 91 | 1.689566% |
Noise dominated data is calculated using 1-second bins in cleaned event files. If a bin has >2000 counts, and if more than 50% of those come from <1% of pixels, then it is considered to be noise-dominated and hence unusable.
| Quadrant | # 1 sec bins | Bins with >0 counts | Bins with >2000 counts | High rate bins dominated by noise | Noise dominated (total time) | Noise dominated (detector-on time) | Marked lightcurve |
|---|---|---|---|---|---|---|---|
| A | 6698 | 5387 | 22 | 22 | 0.33% | 0.41% | 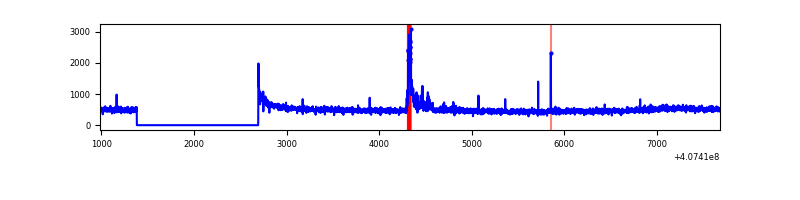 |
| B | 6698 | 5387 | 89 | 89 | 1.33% | 1.65% | 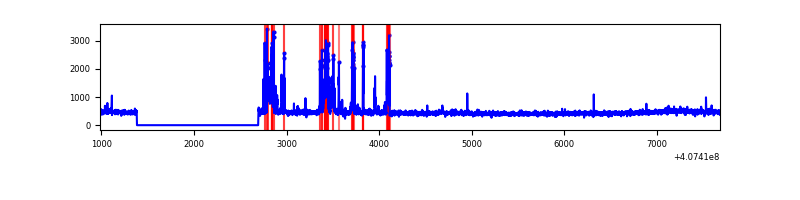 |
| C | 6698 | 5387 | 4 | 4 | 0.06% | 0.07% | 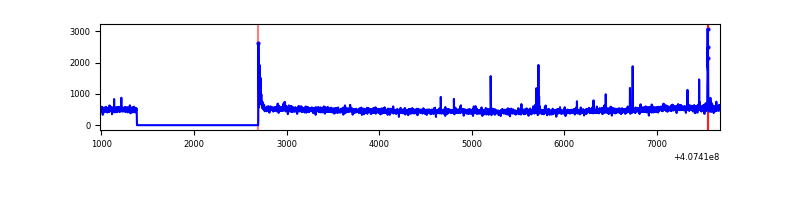 |
| D | 6698 | 5387 | 66 | 66 | 0.99% | 1.23% | 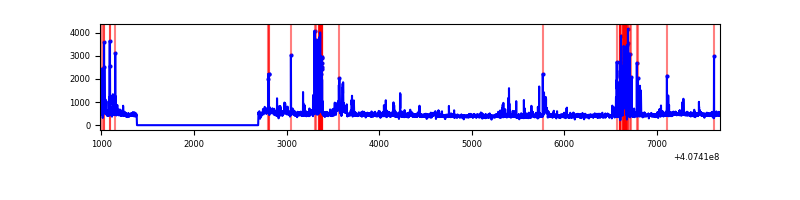 |
Top three noisy pixels from each quadrant. If the there are fewer than three noisy pixels in the level2.evt file, extra rows are filled as -1
| Pixel properties | Quadrant properties | ||||||
|---|---|---|---|---|---|---|---|
| Quadrant | DetID | PixID | Counts | Sigma | Mean | Median | Sigma |
| A | 10 | 83 | 308360 | 2534.79 | 594 | 583 | 121.4 |
| A | 15 | 174 | 121194 | 993.33 | 594 | 583 | 121.4 |
| A | 13 | 248 | 16422 | 130.45 | 594 | 583 | 121.4 |
| B | 4 | 171 | 403169 | 3482.43 | 589 | 573 | 115.6 |
| B | 12 | 111 | 14978 | 124.6 | 589 | 573 | 115.6 |
| B | 11 | 111 | 13675 | 113.33 | 589 | 573 | 115.6 |
| C | 15 | 214 | 232787 | 1703.67 | 582 | 584 | 136.3 |
| C | 14 | 254 | 31332 | 225.6 | 582 | 584 | 136.3 |
| C | 0 | 10 | 25750 | 184.64 | 582 | 584 | 136.3 |
| D | 10 | 118 | 270934 | 1918.24 | 575 | 560 | 140.9 |
| D | 2 | 250 | 133406 | 942.51 | 575 | 560 | 140.9 |
| D | 12 | 227 | 93038 | 656.11 | 575 | 560 | 140.9 |
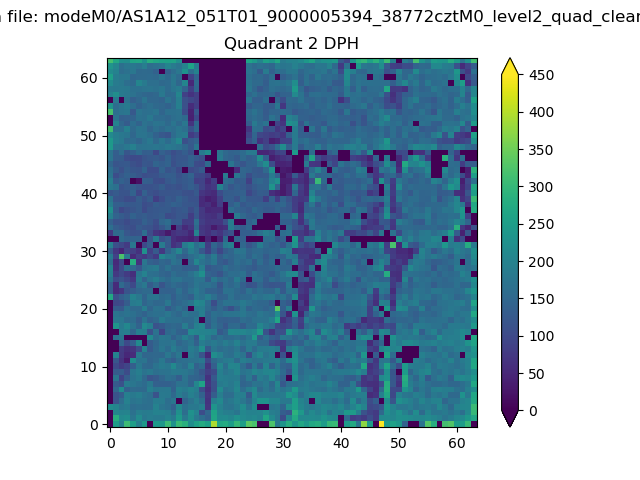
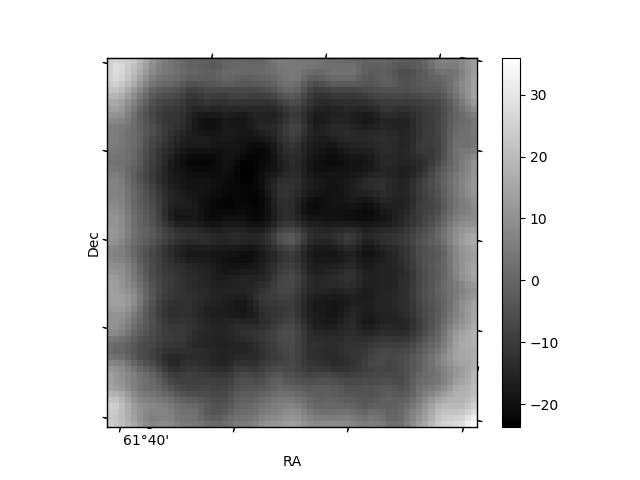
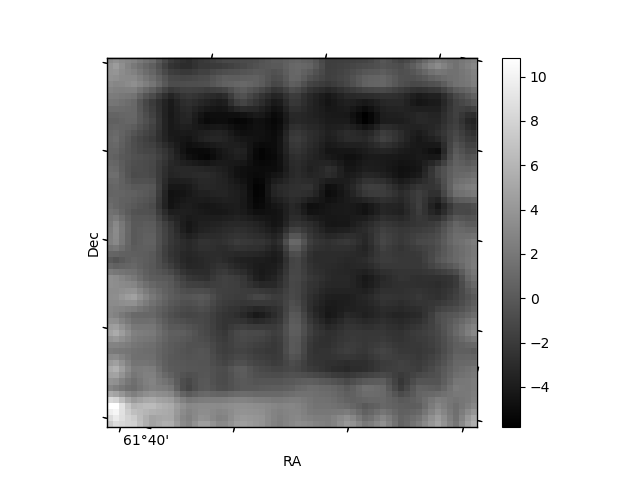
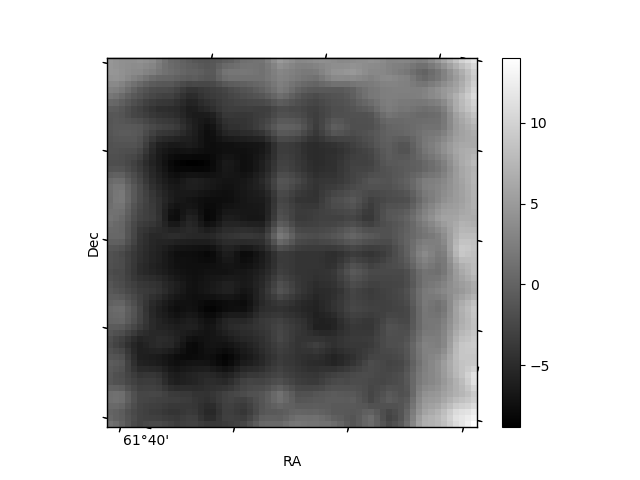
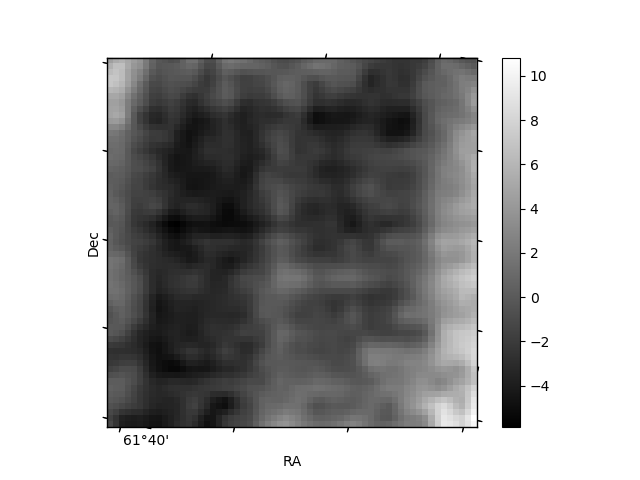
Histogram calculated using DETX and DETY for each event in the final _common_clean file
| Quadrant A | 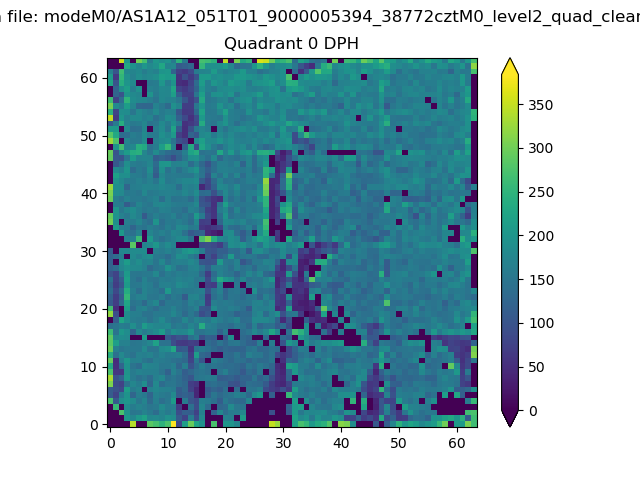 |
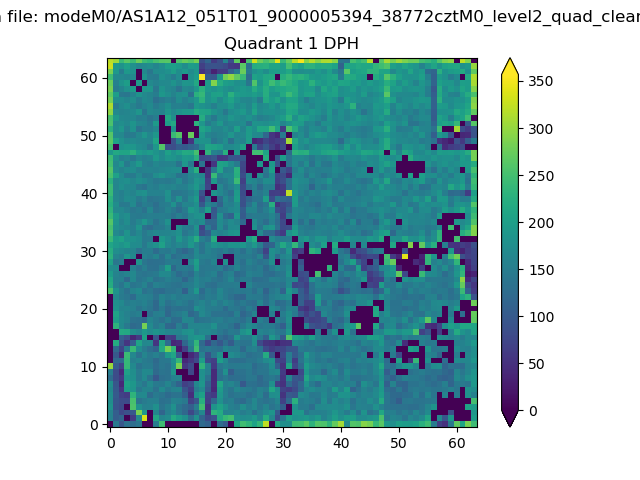 |
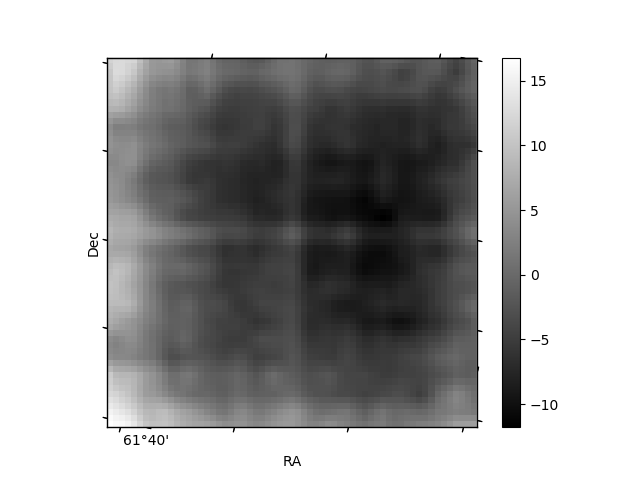
Quadrant B |
|---|---|---|---|
| Quadrant D | 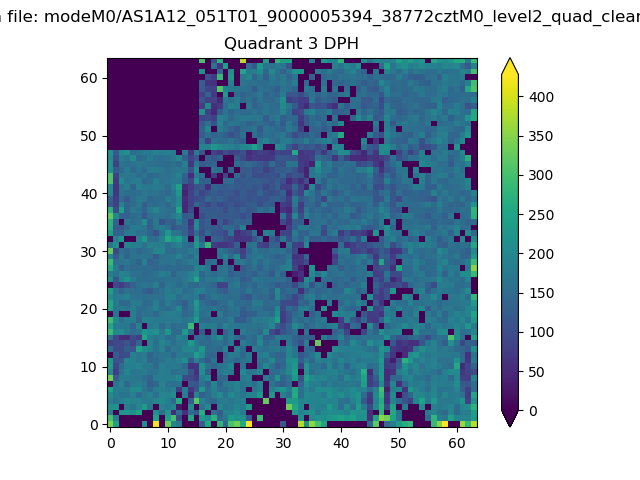 |
 |
Quadrant C |
| Plot type | Count rate plots | Images |
|---|---|---|
| Comparison with Poisson distribution Blue bars denote a histogram of data divided into 1 sec bins. Red curve is a Poisson curve with rate = median count rate of data. |
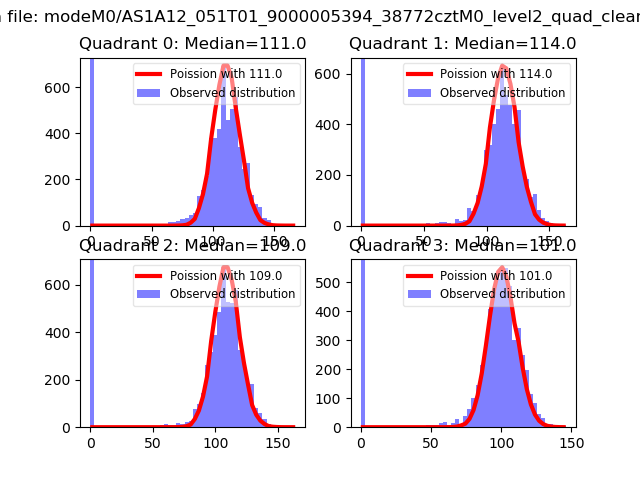 |
 |
| Quadrant-wise count rates Data is divided into 100 sec bins |
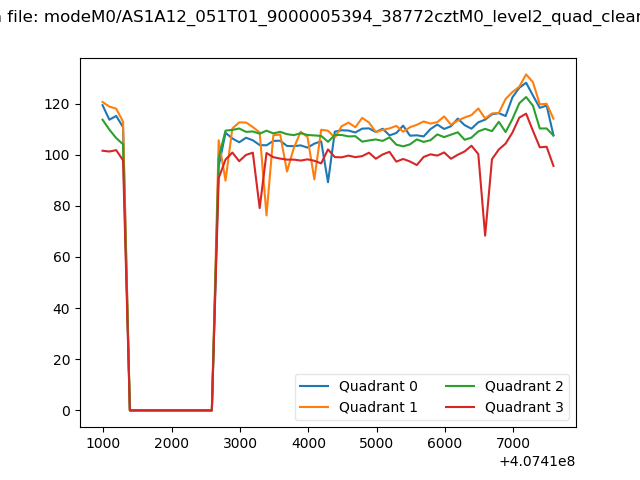 |
|
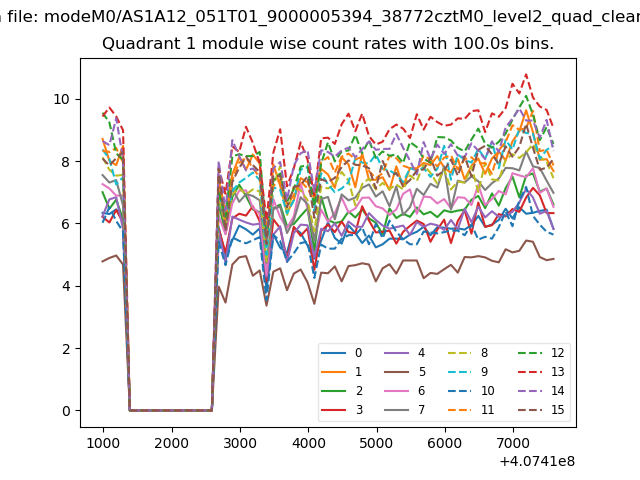
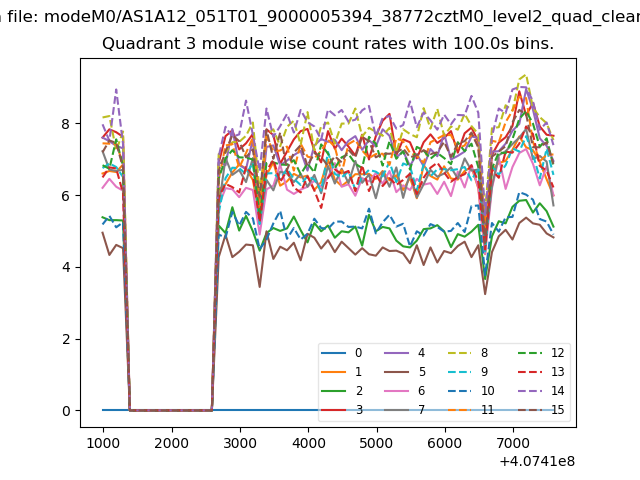
| Module-wise count rates for Quadrant A Data is divided into 100 sec bins |
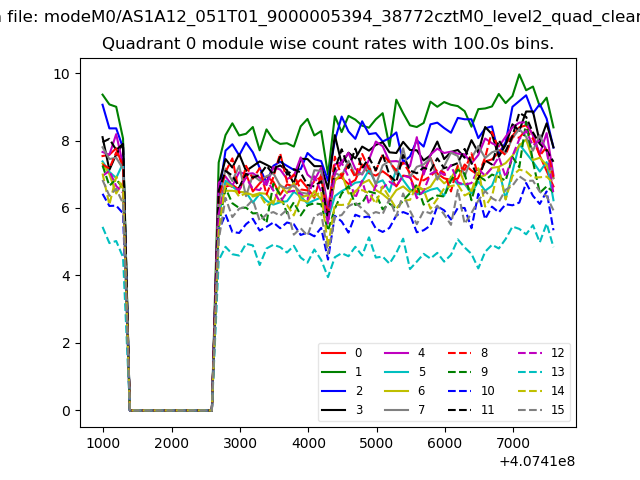 |
 |
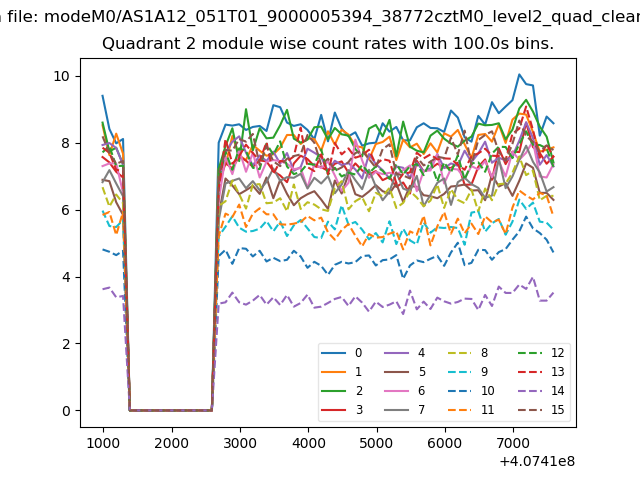
| Module-wise count rates for Quadrant B Data is divided into 100 sec bins |
 |
 |
| Module-wise count rates for Quadrant C Data is divided into 100 sec bins |
 |
 |
| Module-wise count rates for Quadrant D Data is divided into 100 sec bins |
 |
 |
| Parameter | Plot |
|---|---|
| CZT HV Monitor | 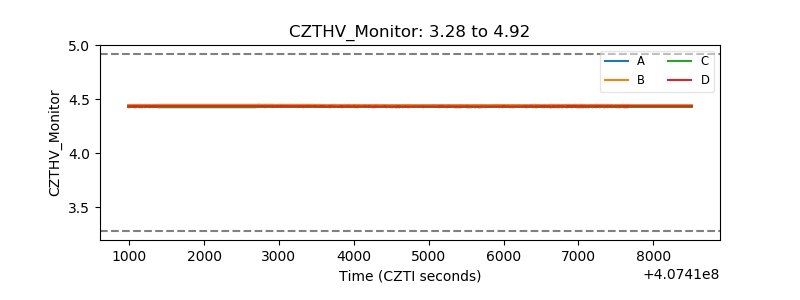 |
| D_VDD | 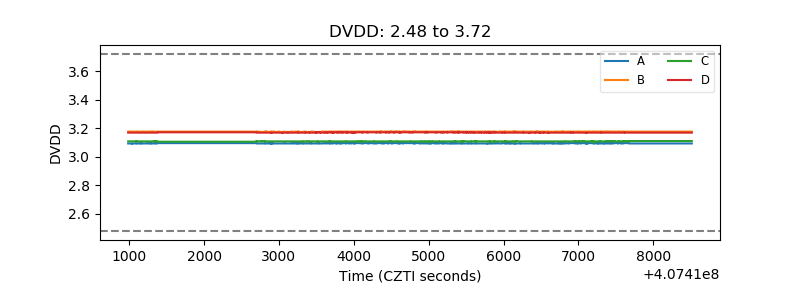 |
| Temperature 1 | 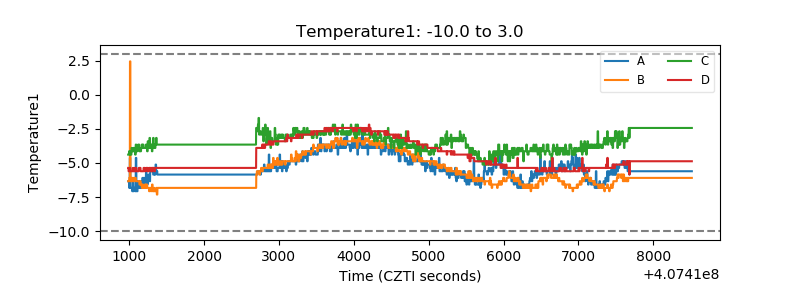 |
| Veto HV Monitor |  |
| Veto LLD | 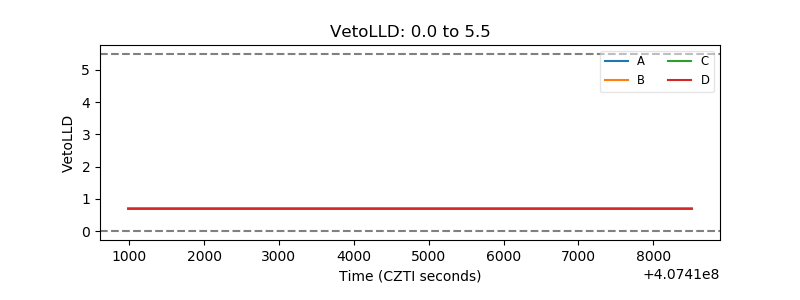 |
| Alpha Counter | 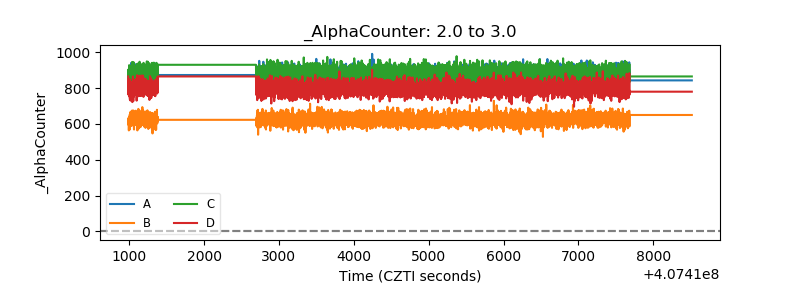 |
| _CPM_Rate | 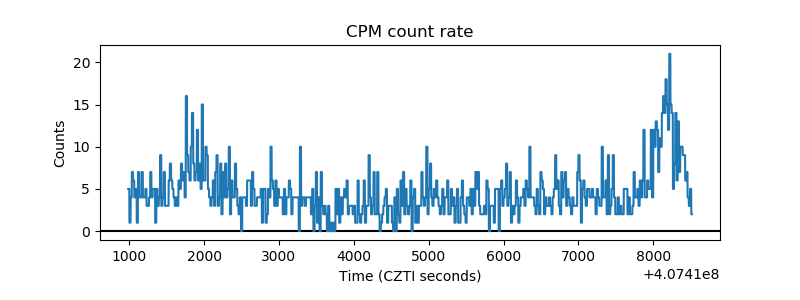 |
| CZT Counter | 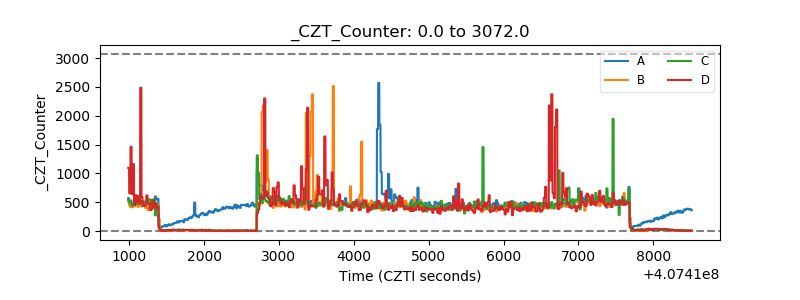 |
| +2.5 Volts monitor | 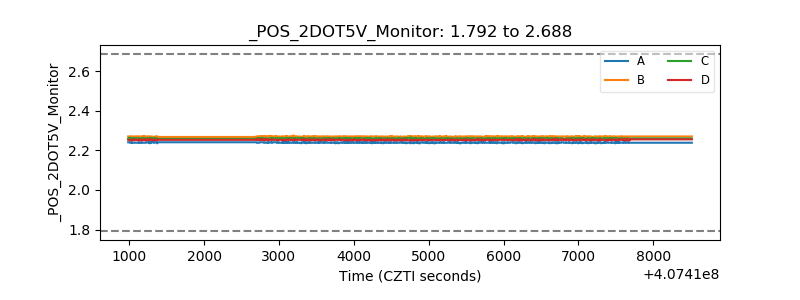 |
| +5 Volts monitor |  |
| _ROLL_ROT | 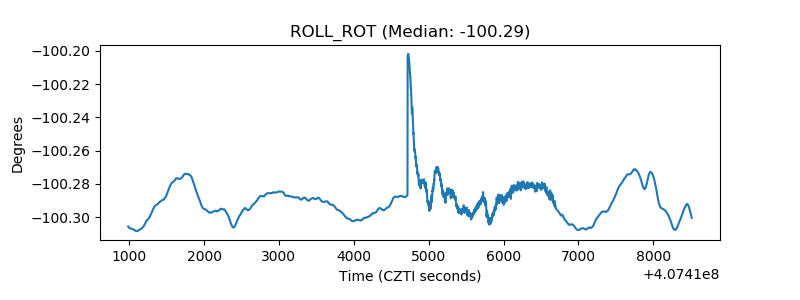 |
| _Roll_DEC | 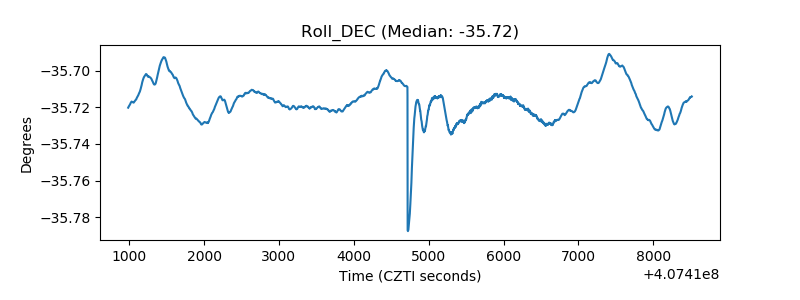 |
| _Roll_RA | 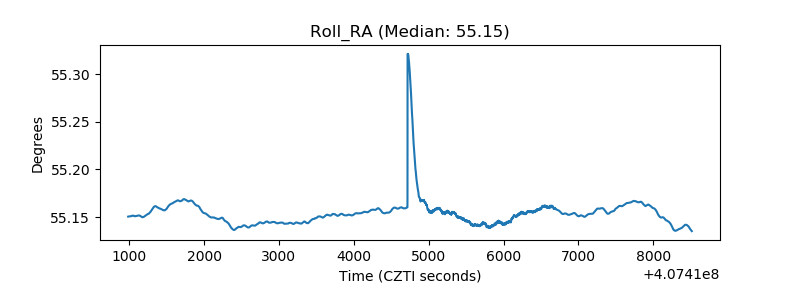 |
| Veto Counter | 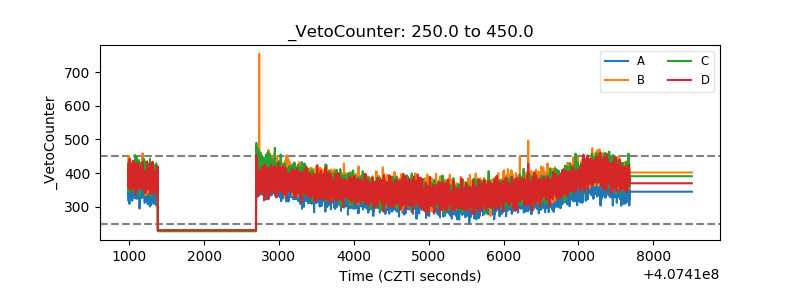 |