| Param | Original file | Final file |
|---|---|---|
| Filename | modeM0/AS1A12_051T01_9000005394_38775cztM0_level2.fits | modeM0/AS1A12_051T01_9000005394_38775cztM0_level2_quad_clean.evt |
| Size (bytes) | 905,397,120 | 248,440,320 |
| Size | 863.5 MB | 236.9 MB |
| Events in quadrant A | 7,717,701 | 1,689,812 |
| Events in quadrant B | 7,912,890 | 1,654,257 |
| Events in quadrant C | 7,822,339 | 1,630,991 |
| Events in quadrant D | 8,863,717 | 1,481,274 |
| Mode SS | |||
|---|---|---|---|
| Quadrant | BADHDUFLAG | Total packets | Discarded packets |
| A | 0 | 314 | 0 |
| B | 0 | 314 | 0 |
| C | 0 | 314 | 0 |
| D | 0 | 314 | 0 |
| Mode M0 | |||
|---|---|---|---|
| Quadrant | BADHDUFLAG | Total packets | Discarded packets |
| A | 0 | 32778 | 5 |
| B | 0 | 34357 | 4 |
| C | 0 | 33367 | 4 |
| D | 0 | 37910 | 4 |
| Mode M9 | |||
|---|---|---|---|
| Quadrant | BADHDUFLAG | Total packets | Discarded packets |
| A | 0 | 48 | 0 |
| B | 0 | 48 | 0 |
| C | 0 | 48 | 0 |
| D | 0 | 49 | 0 |
| Quadrant | Total seconds | Saturated seconds | Saturation percentage |
|---|---|---|---|
| A | 15452 | 34 | 0.220036% |
| B | 15452 | 474 | 3.067564% |
| C | 15452 | 155 | 1.003106% |
| D | 15452 | 537 | 3.475278% |
Noise dominated data is calculated using 1-second bins in cleaned event files. If a bin has >2000 counts, and if more than 50% of those come from <1% of pixels, then it is considered to be noise-dominated and hence unusable.
| Quadrant | # 1 sec bins | Bins with >0 counts | Bins with >2000 counts | High rate bins dominated by noise | Noise dominated (total time) | Noise dominated (detector-on time) | Marked lightcurve |
|---|---|---|---|---|---|---|---|
| A | 19842 | 15455 | 14 | 14 | 0.07% | 0.09% | 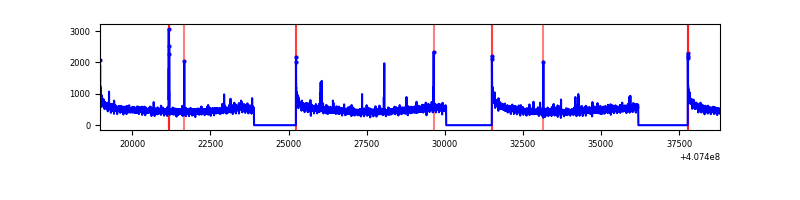 |
| B | 19842 | 15455 | 345 | 345 | 1.74% | 2.23% | 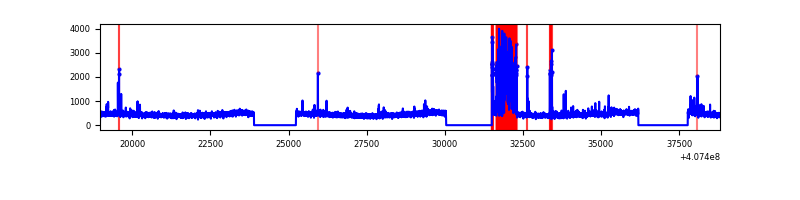 |
| C | 19842 | 15455 | 90 | 90 | 0.45% | 0.58% | 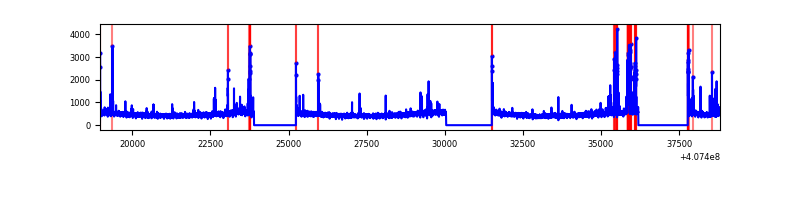 |
| D | 19842 | 15455 | 404 | 404 | 2.04% | 2.61% | 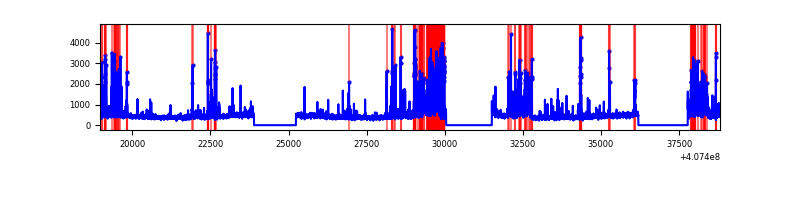 |
Top three noisy pixels from each quadrant. If the there are fewer than three noisy pixels in the level2.evt file, extra rows are filled as -1
| Pixel properties | Quadrant properties | ||||||
|---|---|---|---|---|---|---|---|
| Quadrant | DetID | PixID | Counts | Sigma | Mean | Median | Sigma |
| A | 10 | 83 | 994407 | 2890.17 | 1706 | 1670 | 343.5 |
| A | 15 | 174 | 27109 | 74.06 | 1706 | 1670 | 343.5 |
| A | 13 | 248 | 26903 | 73.46 | 1706 | 1670 | 343.5 |
| B | 4 | 171 | 1227560 | 3771.08 | 1674 | 1623 | 325.1 |
| B | 0 | 230 | 59199 | 177.11 | 1674 | 1623 | 325.1 |
| B | 12 | 111 | 41951 | 124.05 | 1674 | 1623 | 325.1 |
| C | 15 | 214 | 678589 | 1750.26 | 1657 | 1666 | 386.8 |
| C | 14 | 254 | 477350 | 1229.93 | 1657 | 1666 | 386.8 |
| C | 0 | 10 | 93553 | 237.58 | 1657 | 1666 | 386.8 |
| D | 2 | 16 | 1012912 | 2556.14 | 1632 | 1588 | 395.6 |
| D | 5 | 222 | 358907 | 903.13 | 1632 | 1588 | 395.6 |
| D | 12 | 233 | 338834 | 852.4 | 1632 | 1588 | 395.6 |
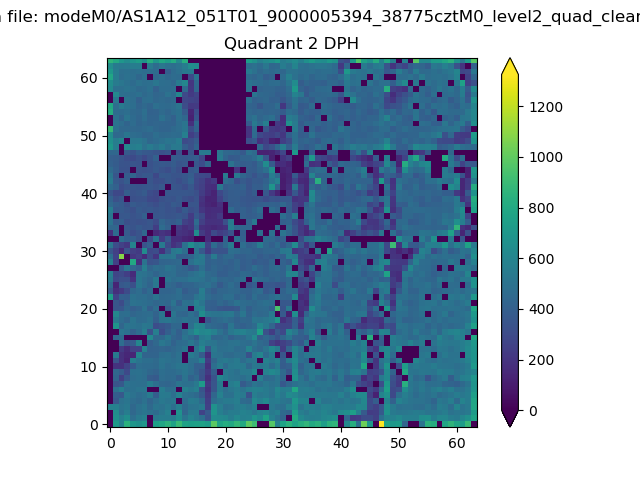
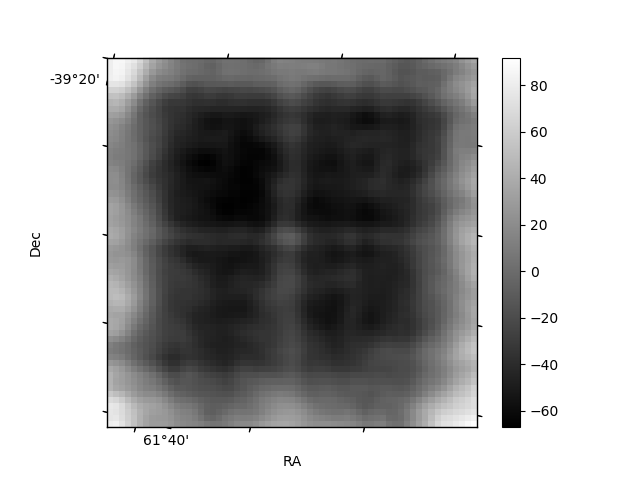
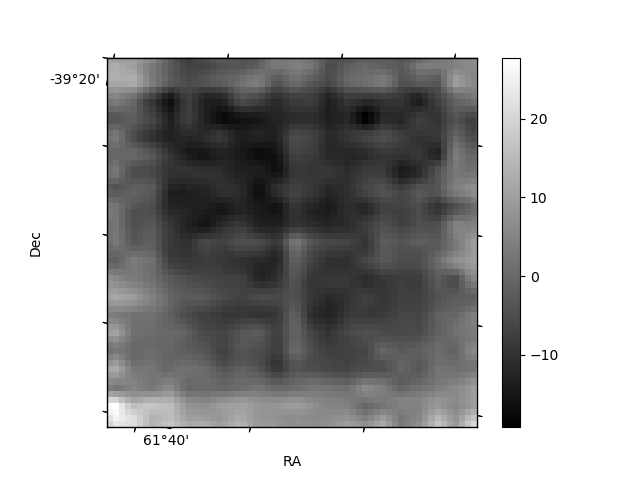
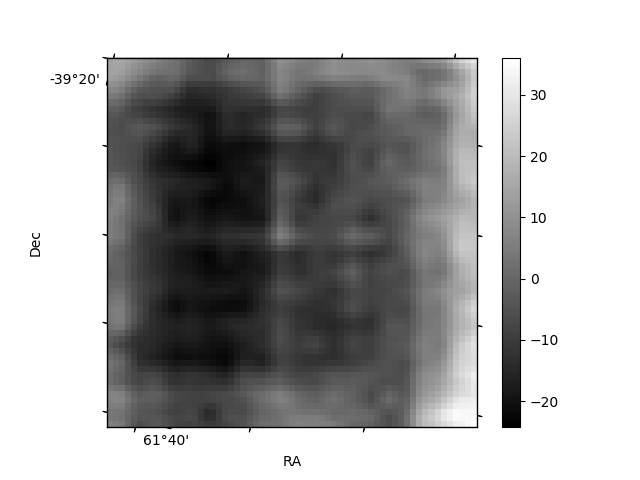
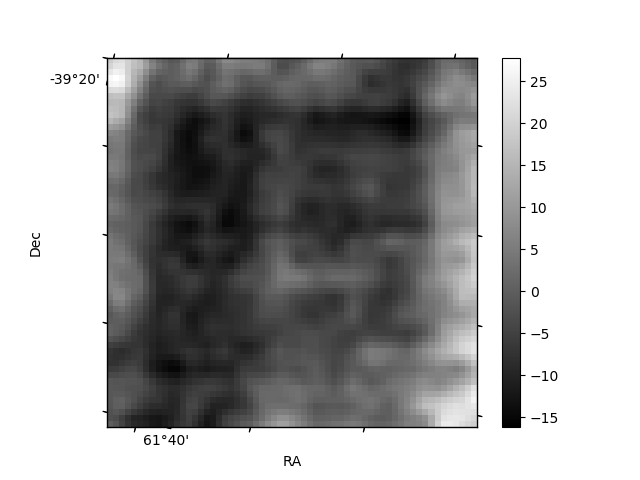
Histogram calculated using DETX and DETY for each event in the final _common_clean file
| Quadrant A | 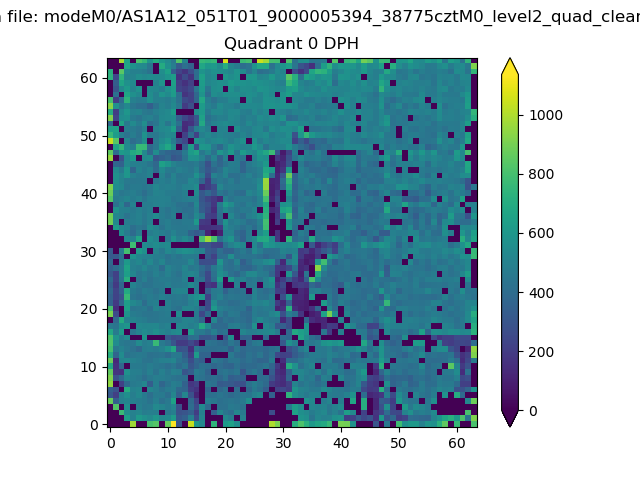 |
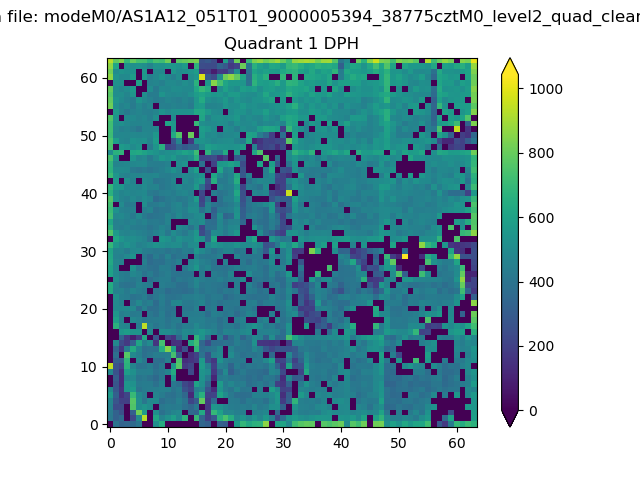 |
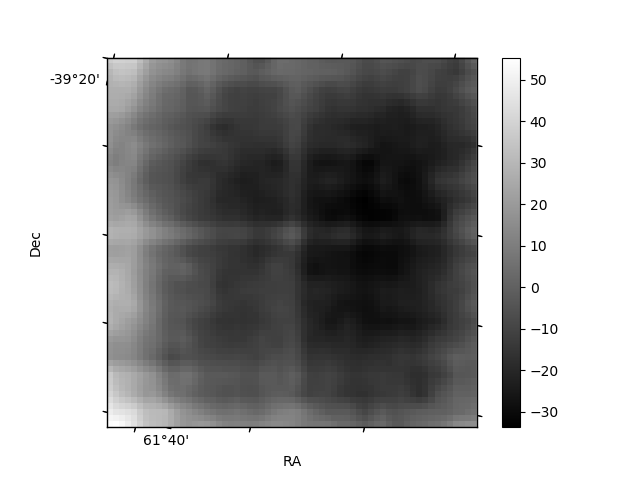
Quadrant B |
|---|---|---|---|
| Quadrant D | 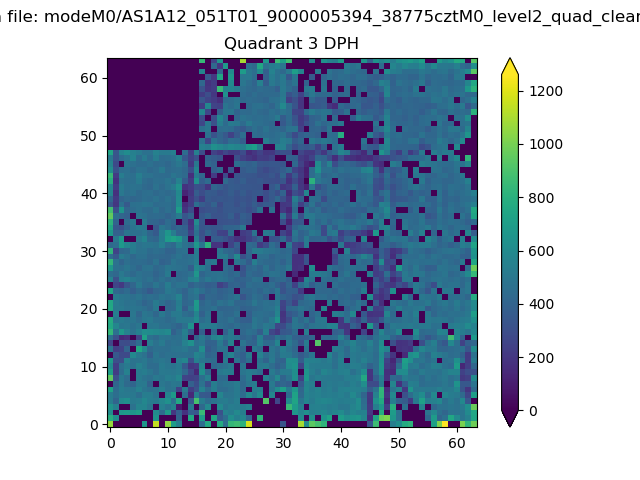 |
 |
Quadrant C |
| Plot type | Count rate plots | Images |
|---|---|---|
| Comparison with Poisson distribution Blue bars denote a histogram of data divided into 1 sec bins. Red curve is a Poisson curve with rate = median count rate of data. |
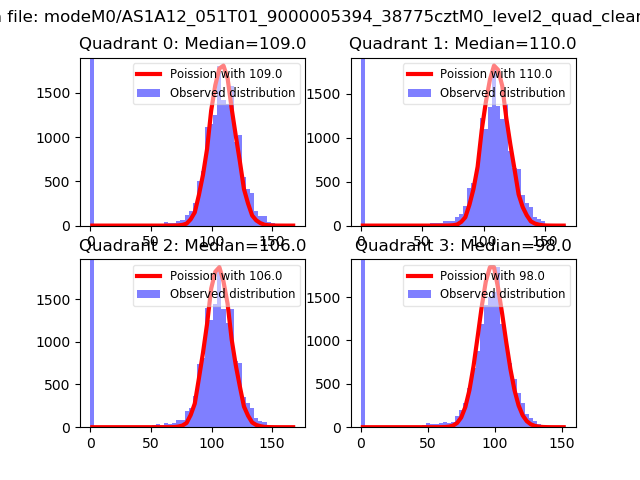 |
 |
| Quadrant-wise count rates Data is divided into 100 sec bins |
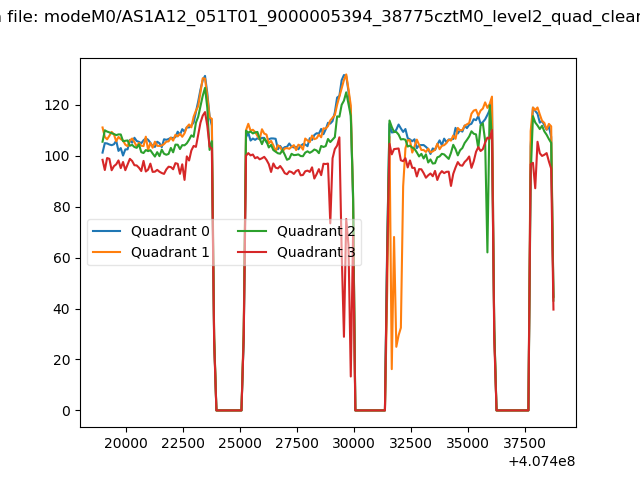 |
|
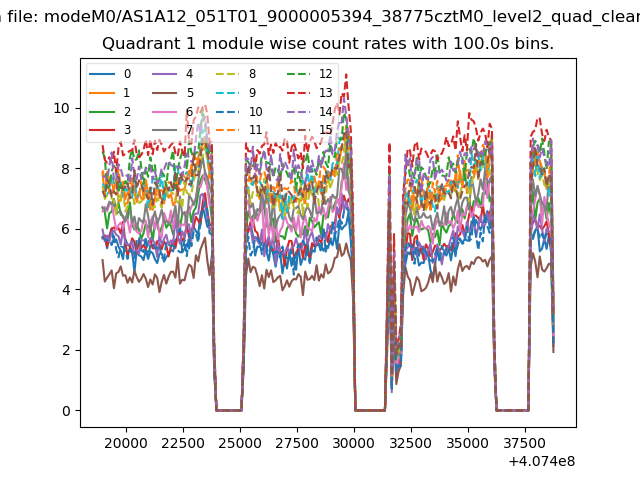
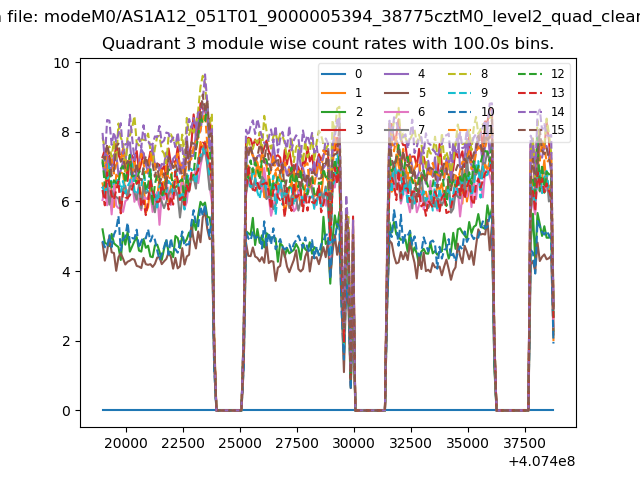
| Module-wise count rates for Quadrant A Data is divided into 100 sec bins |
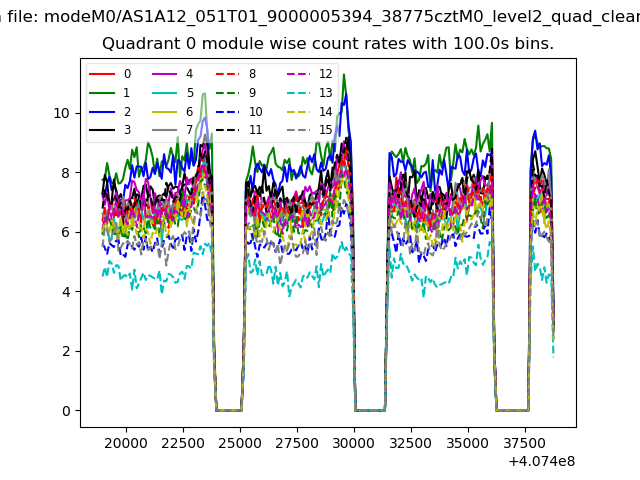 |
 |
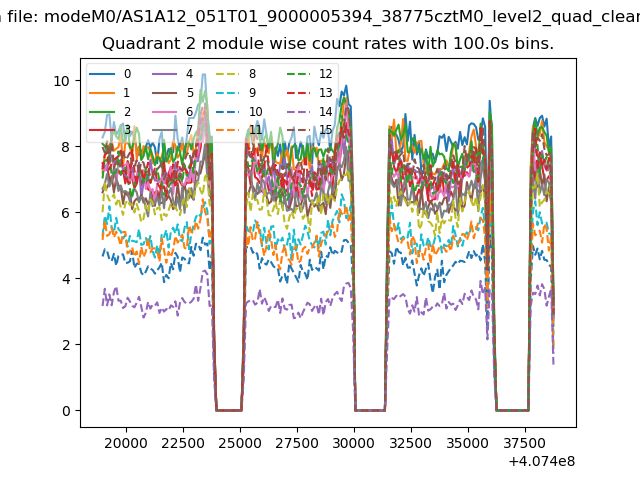
| Module-wise count rates for Quadrant B Data is divided into 100 sec bins |
 |
 |
| Module-wise count rates for Quadrant C Data is divided into 100 sec bins |
 |
 |
| Module-wise count rates for Quadrant D Data is divided into 100 sec bins |
 |
 |
| Parameter | Plot |
|---|---|
| CZT HV Monitor | 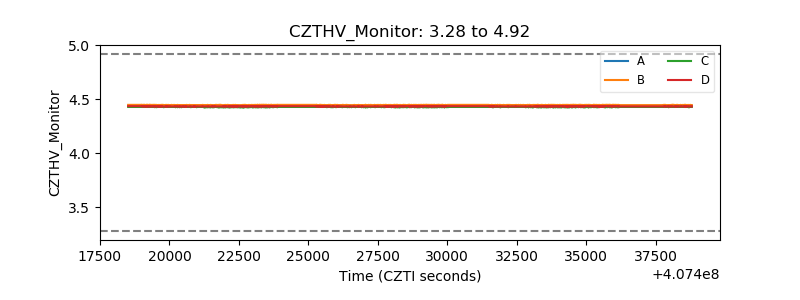 |
| D_VDD | 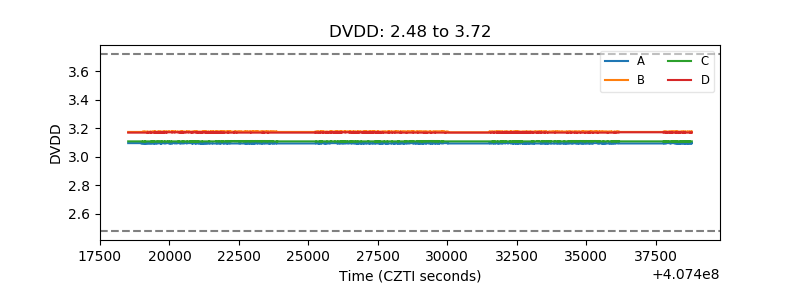 |
| Temperature 1 | 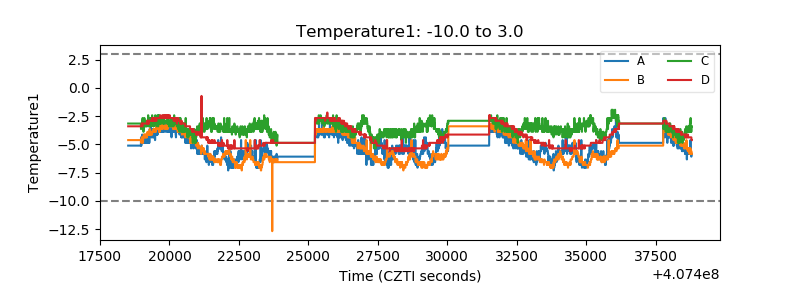 |
| Veto HV Monitor | 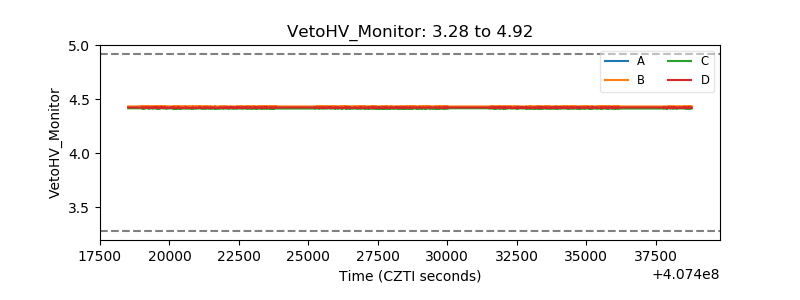 |
| Veto LLD | 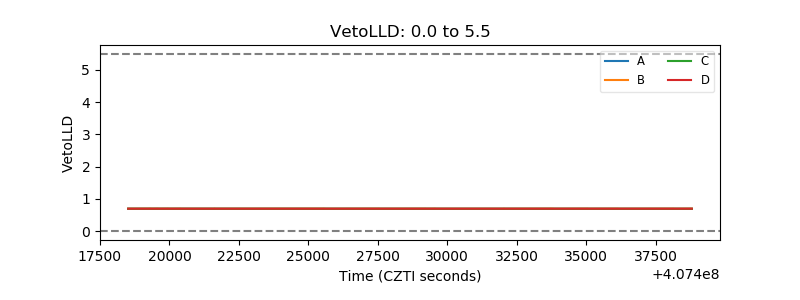 |
| Alpha Counter | 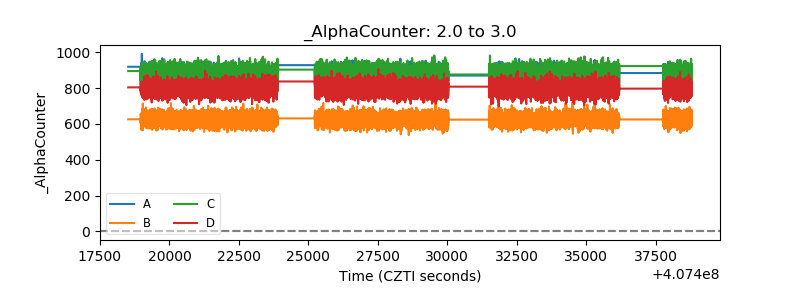 |
| _CPM_Rate | 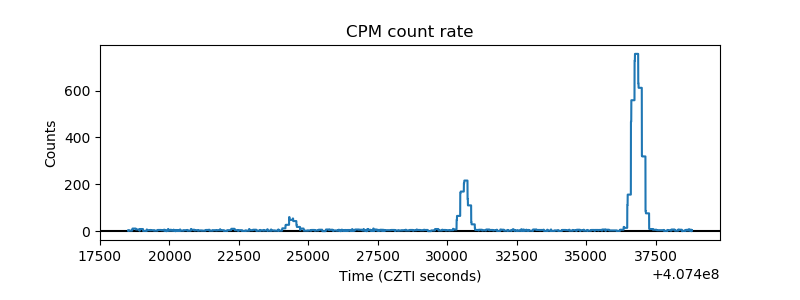 |
| CZT Counter | 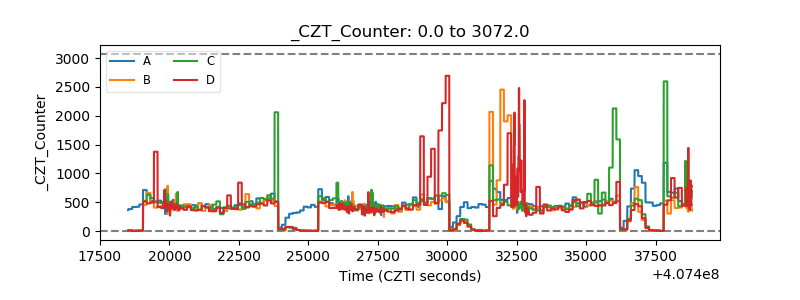 |
| +2.5 Volts monitor | 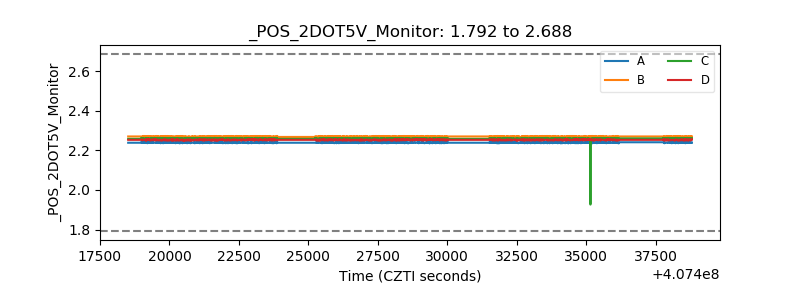 |
| +5 Volts monitor | 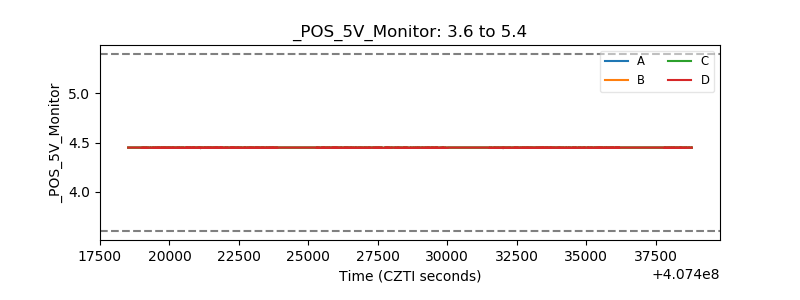 |
| _ROLL_ROT | 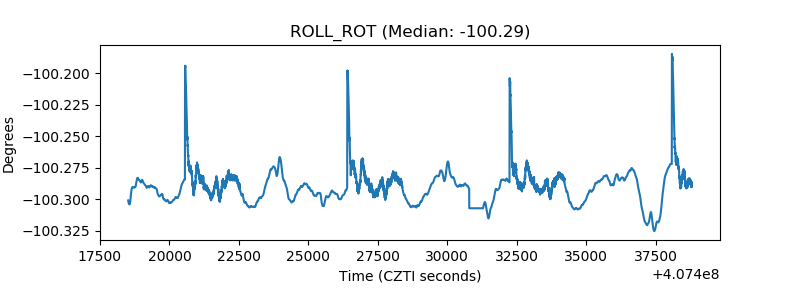 |
| _Roll_DEC | 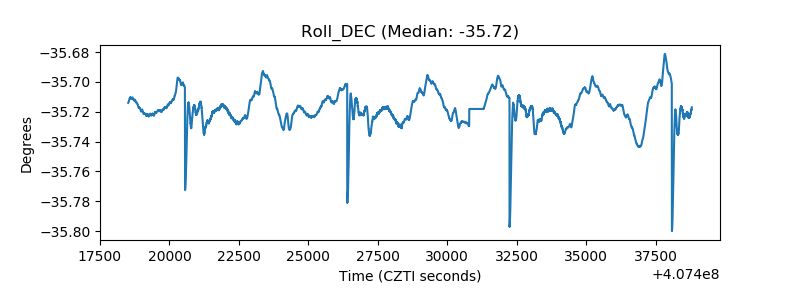 |
| _Roll_RA | 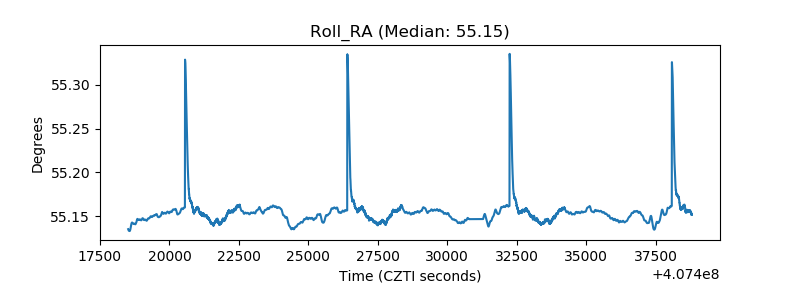 |
| Veto Counter | 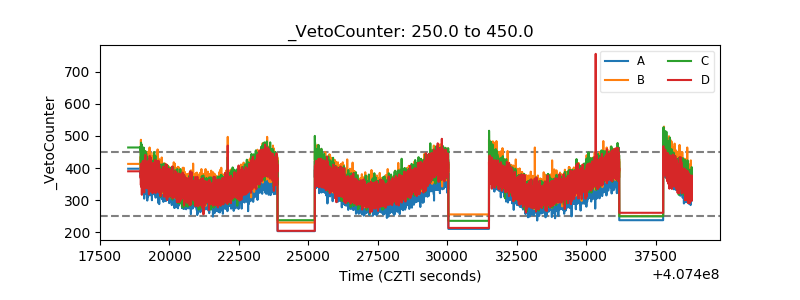 |