| Param | Original file | Final file |
|---|---|---|
| Filename | modeM0/AS1A12_051T01_9000005394_38776cztM0_level2.fits | modeM0/AS1A12_051T01_9000005394_38776cztM0_level2_quad_clean.evt |
| Size (bytes) | 345,260,160 | 95,307,840 |
| Size | 329.3 MB | 90.9 MB |
| Events in quadrant A | 2,876,322 | 647,864 |
| Events in quadrant B | 2,535,645 | 665,341 |
| Events in quadrant C | 3,084,189 | 615,745 |
| Events in quadrant D | 3,844,694 | 562,059 |
| Mode SS | |||
|---|---|---|---|
| Quadrant | BADHDUFLAG | Total packets | Discarded packets |
| A | 0 | 116 | 0 |
| B | 0 | 116 | 0 |
| C | 0 | 116 | 0 |
| D | 0 | 116 | 0 |
| Mode M0 | |||
|---|---|---|---|
| Quadrant | BADHDUFLAG | Total packets | Discarded packets |
| A | 0 | 12185 | 3 |
| B | 0 | 11436 | 2 |
| C | 0 | 12656 | 2 |
| D | 0 | 15427 | 2 |
| Mode M9 | |||
|---|---|---|---|
| Quadrant | BADHDUFLAG | Total packets | Discarded packets |
| A | 0 | 20 | 0 |
| B | 0 | 20 | 0 |
| C | 0 | 20 | 0 |
| D | 0 | 21 | 0 |
| Quadrant | Total seconds | Saturated seconds | Saturation percentage |
|---|---|---|---|
| A | 5644 | 11 | 0.194897% |
| B | 5644 | 12 | 0.212615% |
| C | 5644 | 55 | 0.974486% |
| D | 5644 | 200 | 3.543586% |
Noise dominated data is calculated using 1-second bins in cleaned event files. If a bin has >2000 counts, and if more than 50% of those come from <1% of pixels, then it is considered to be noise-dominated and hence unusable.
| Quadrant | # 1 sec bins | Bins with >0 counts | Bins with >2000 counts | High rate bins dominated by noise | Noise dominated (total time) | Noise dominated (detector-on time) | Marked lightcurve |
|---|---|---|---|---|---|---|---|
| A | 7347 | 5645 | 6 | 6 | 0.08% | 0.11% | 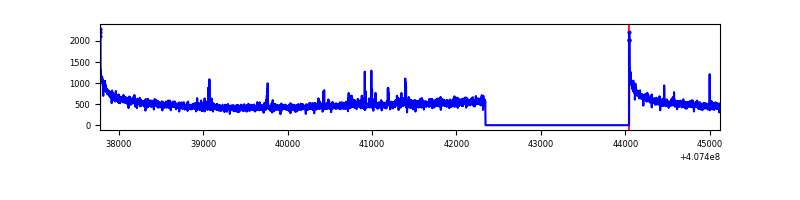 |
| B | 7347 | 5645 | 1 | 1 | 0.01% | 0.02% | 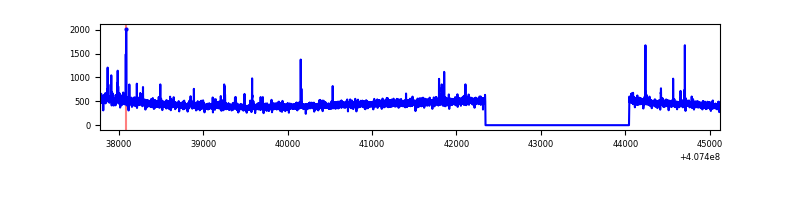 |
| C | 7347 | 5645 | 54 | 54 | 0.73% | 0.96% | 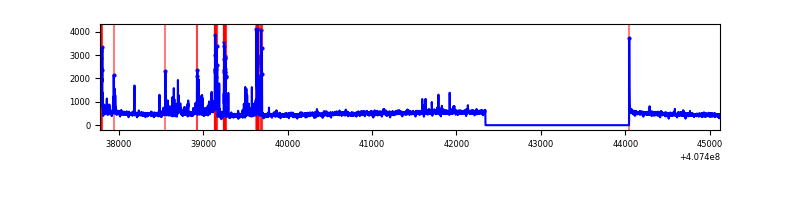 |
| D | 7347 | 5645 | 190 | 190 | 2.59% | 3.37% | 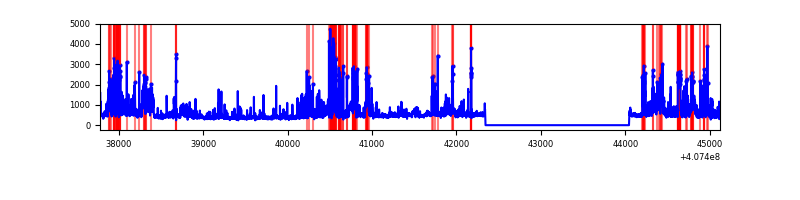 |
Top three noisy pixels from each quadrant. If the there are fewer than three noisy pixels in the level2.evt file, extra rows are filled as -1
| Pixel properties | Quadrant properties | ||||||
|---|---|---|---|---|---|---|---|
| Quadrant | DetID | PixID | Counts | Sigma | Mean | Median | Sigma |
| A | 10 | 83 | 406116 | 3211.39 | 625 | 613 | 126.3 |
| A | 13 | 248 | 24532 | 189.42 | 625 | 613 | 126.3 |
| A | 9 | 143 | 13417 | 101.4 | 625 | 613 | 126.3 |
| B | 4 | 171 | 36794 | 296.25 | 625 | 607 | 122.1 |
| B | 5 | 200 | 19077 | 151.21 | 625 | 607 | 122.1 |
| B | 12 | 111 | 15638 | 123.06 | 625 | 607 | 122.1 |
| C | 14 | 254 | 357765 | 2519.17 | 605 | 610 | 141.8 |
| C | 15 | 214 | 250877 | 1765.24 | 605 | 610 | 141.8 |
| C | 0 | 10 | 41512 | 288.5 | 605 | 610 | 141.8 |
| D | 5 | 222 | 492759 | 3417.53 | 595 | 579 | 144.0 |
| D | 10 | 118 | 342475 | 2374.01 | 595 | 579 | 144.0 |
| D | 2 | 249 | 257992 | 1787.39 | 595 | 579 | 144.0 |
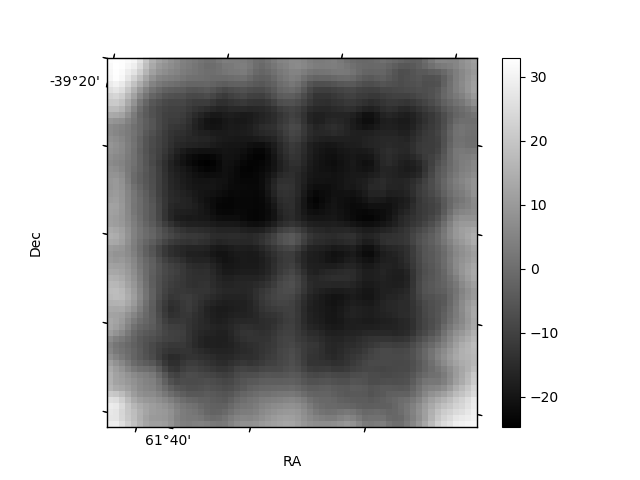
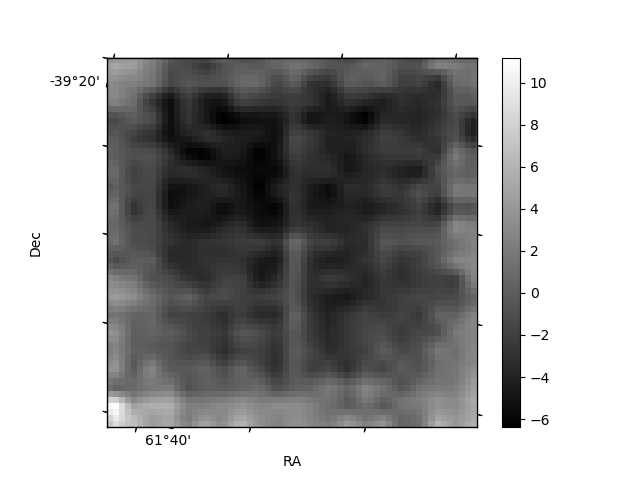
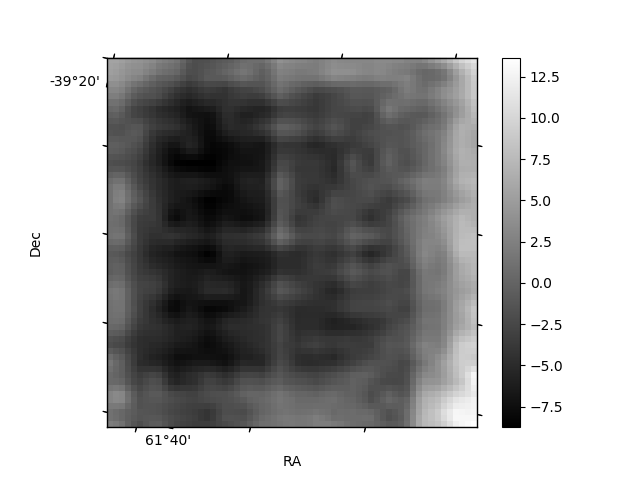
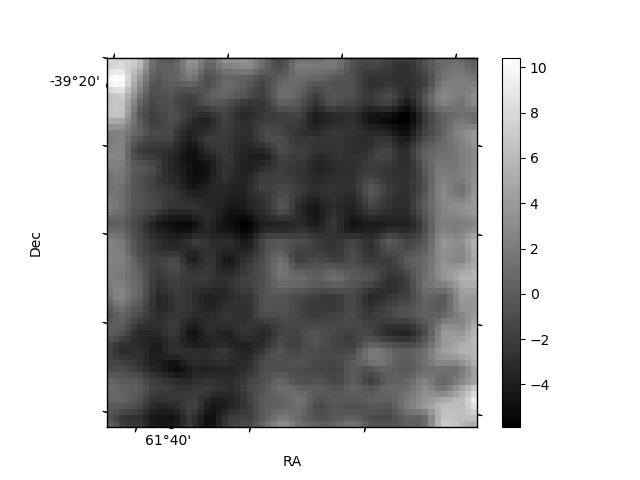
Histogram calculated using DETX and DETY for each event in the final _common_clean file
| Quadrant A | 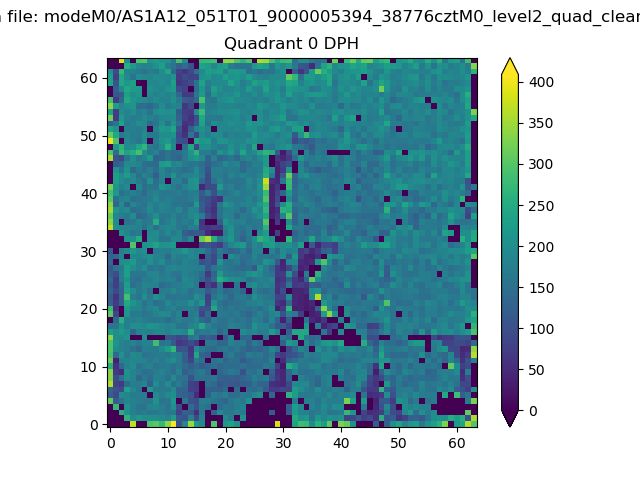 |
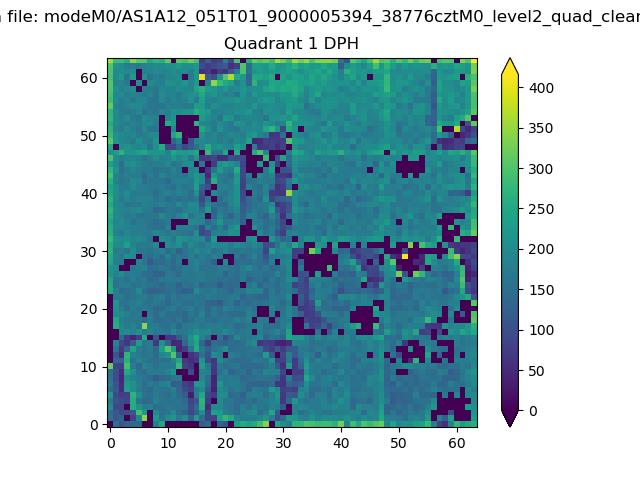 |
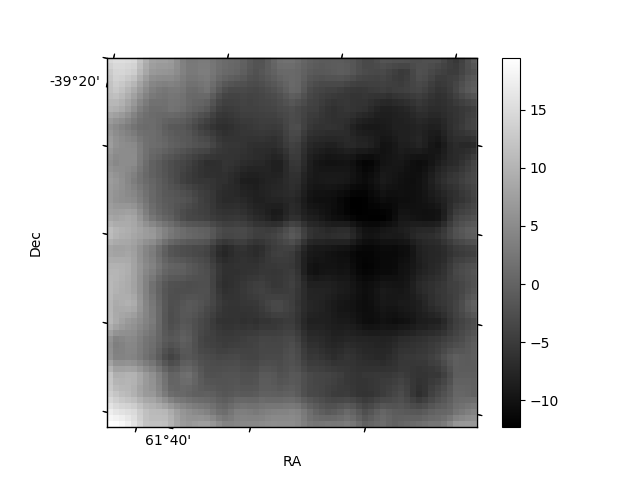
Quadrant B |
|---|---|---|---|
| Quadrant D | 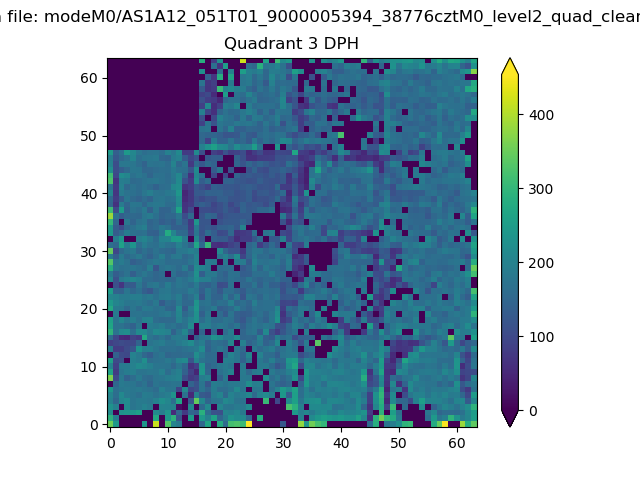 |
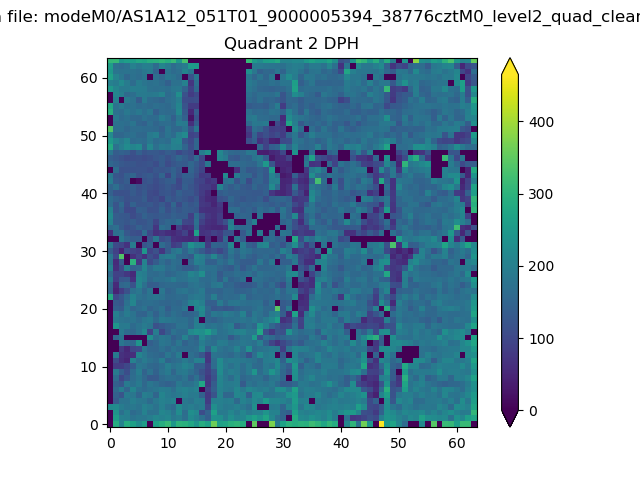 |
Quadrant C |
| Plot type | Count rate plots | Images |
|---|---|---|
| Comparison with Poisson distribution Blue bars denote a histogram of data divided into 1 sec bins. Red curve is a Poisson curve with rate = median count rate of data. |
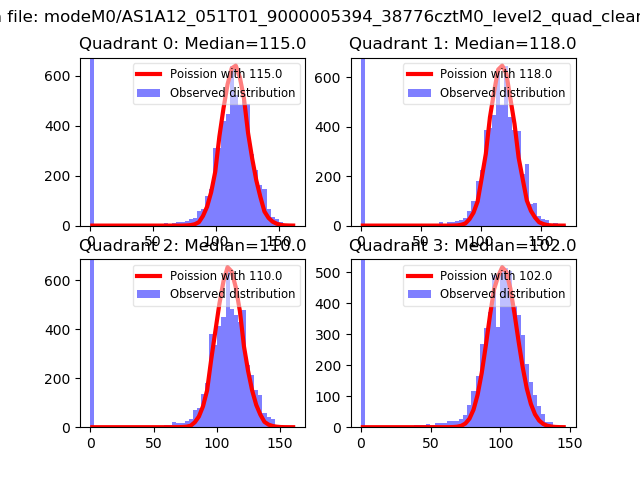 |
 |
| Quadrant-wise count rates Data is divided into 100 sec bins |
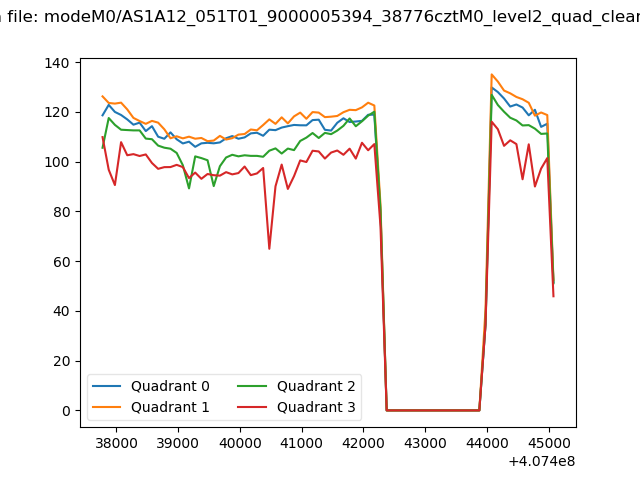 |
|
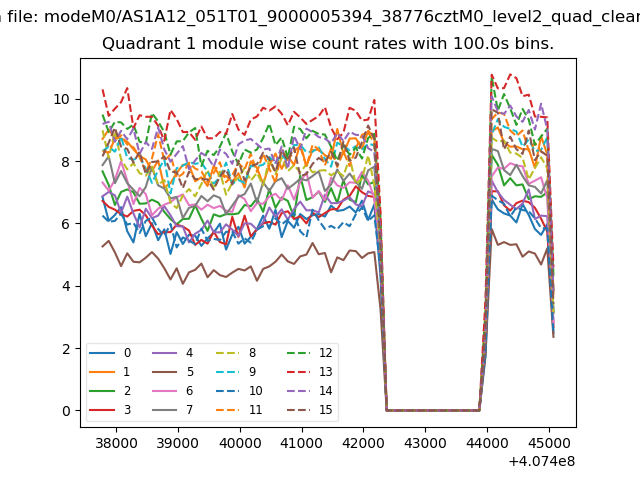
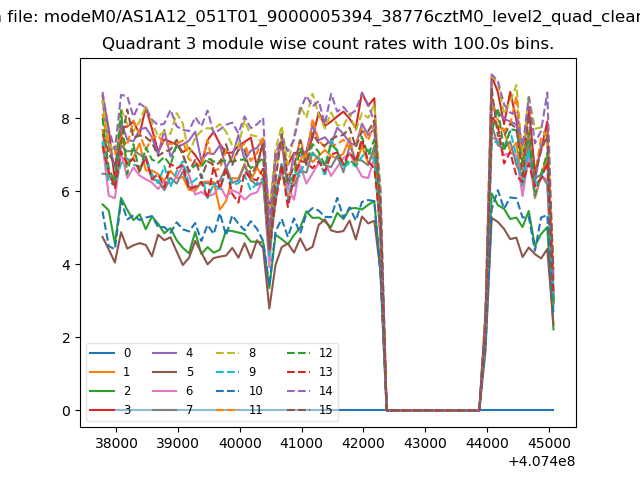
| Module-wise count rates for Quadrant A Data is divided into 100 sec bins |
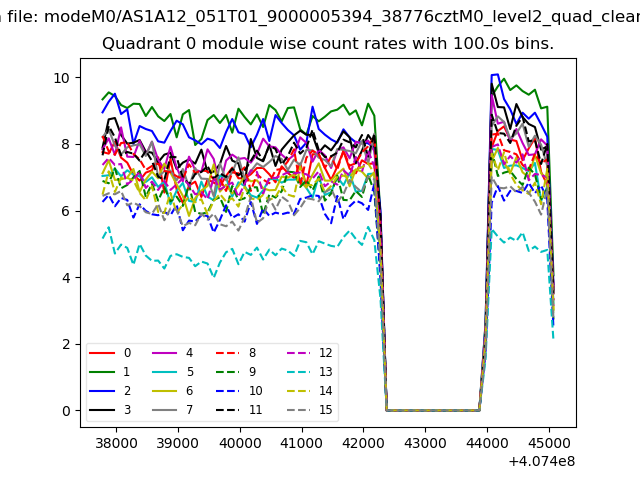 |
 |
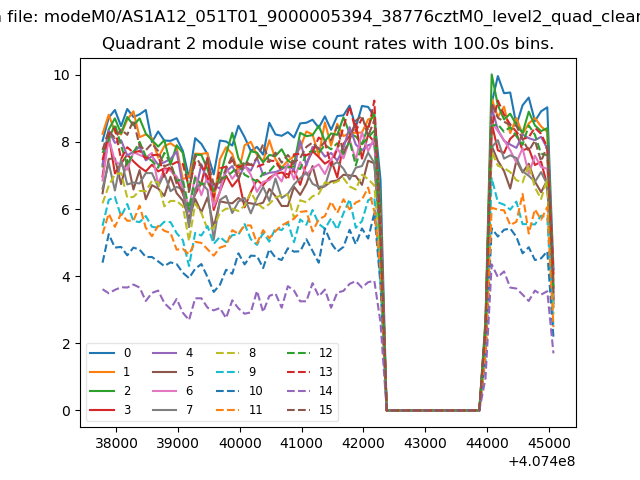
| Module-wise count rates for Quadrant B Data is divided into 100 sec bins |
 |
 |
| Module-wise count rates for Quadrant C Data is divided into 100 sec bins |
 |
 |
| Module-wise count rates for Quadrant D Data is divided into 100 sec bins |
 |
 |
| Parameter | Plot |
|---|---|
| CZT HV Monitor | 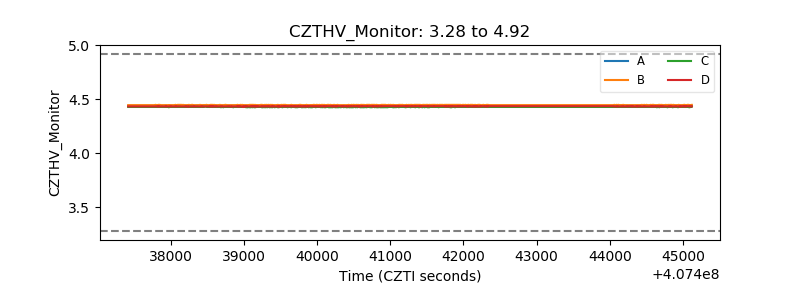 |
| D_VDD | 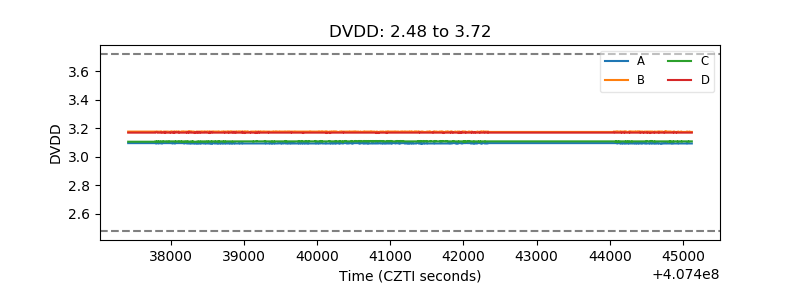 |
| Temperature 1 | 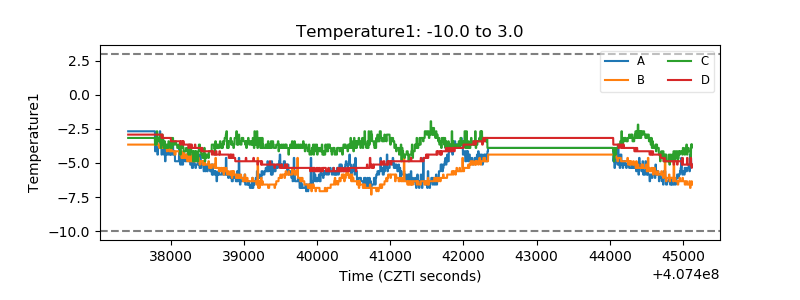 |
| Veto HV Monitor | 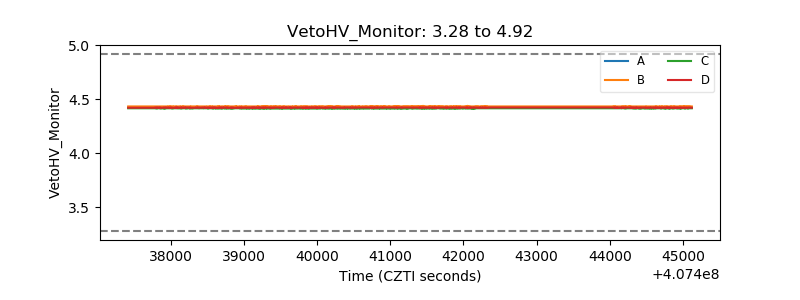 |
| Veto LLD | 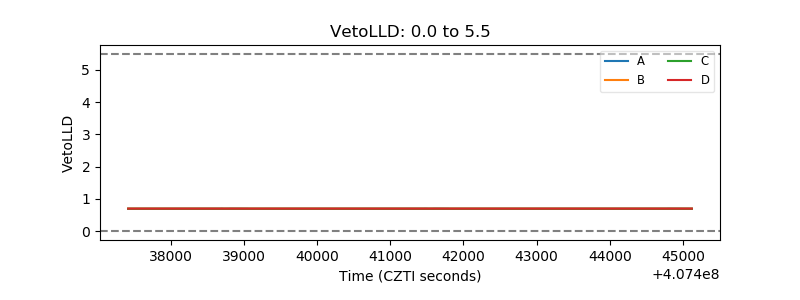 |
| Alpha Counter | 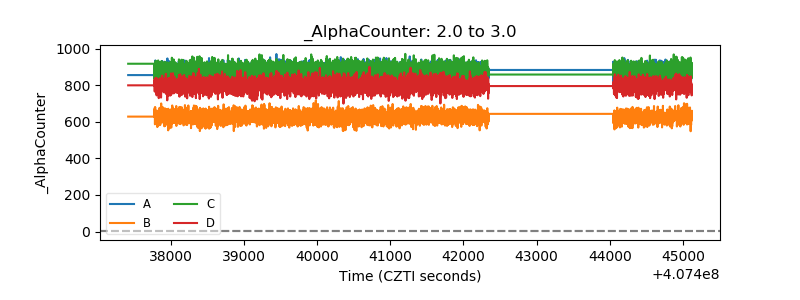 |
| _CPM_Rate | 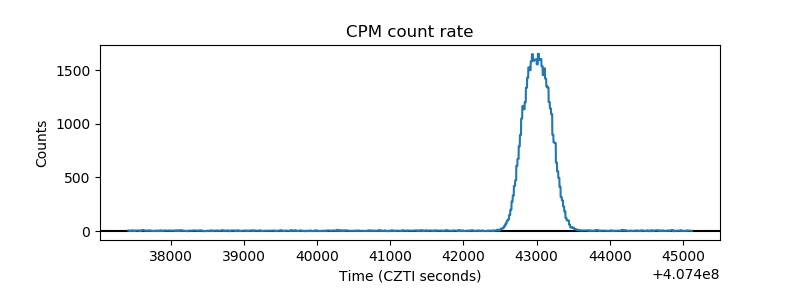 |
| CZT Counter | 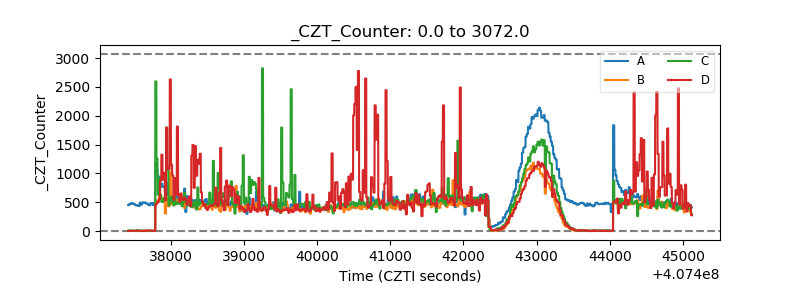 |
| +2.5 Volts monitor | 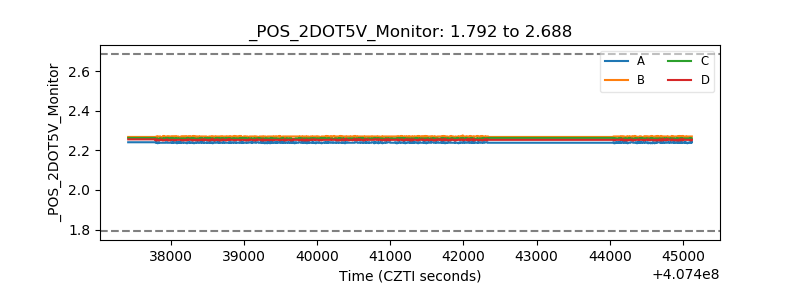 |
| +5 Volts monitor |  |
| _ROLL_ROT | 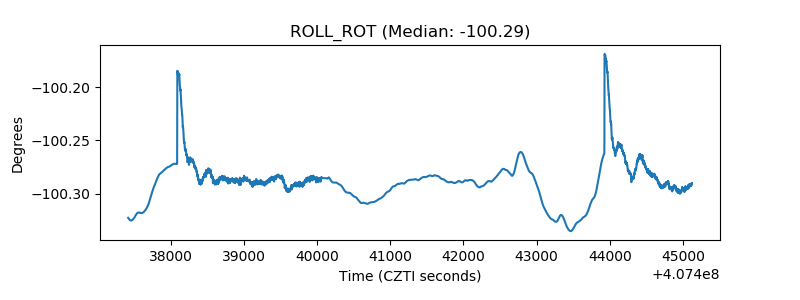 |
| _Roll_DEC | 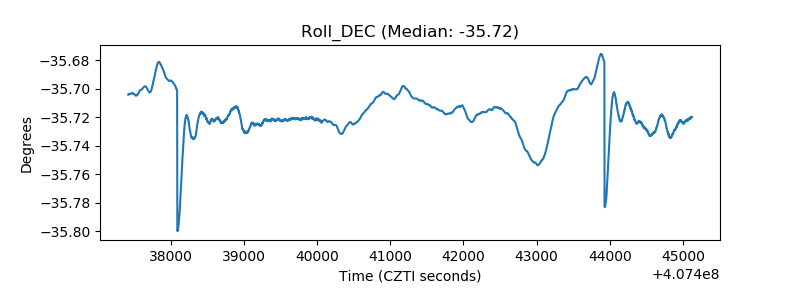 |
| _Roll_RA | 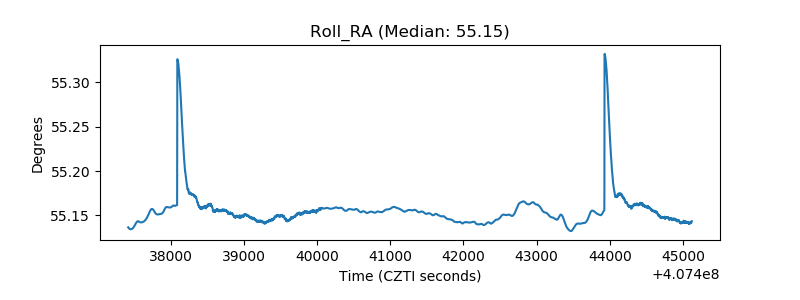 |
| Veto Counter | 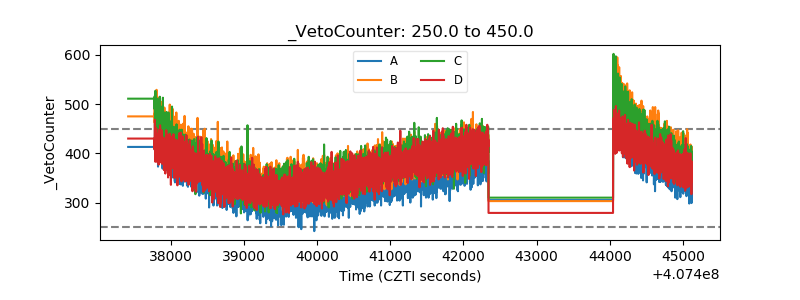 |