| Param | Original file | Final file |
|---|---|---|
| Filename | modeM0/AS1A12_051T01_9000005394_38778cztM0_level2.fits | modeM0/AS1A12_051T01_9000005394_38778cztM0_level2_quad_clean.evt |
| Size (bytes) | 304,848,000 | 93,193,920 |
| Size | 290.7 MB | 88.9 MB |
| Events in quadrant A | 2,721,503 | 632,851 |
| Events in quadrant B | 2,413,511 | 653,761 |
| Events in quadrant C | 2,569,941 | 608,061 |
| Events in quadrant D | 3,164,892 | 555,077 |
| Mode SS | |||
|---|---|---|---|
| Quadrant | BADHDUFLAG | Total packets | Discarded packets |
| A | 0 | 108 | 0 |
| B | 0 | 108 | 0 |
| C | 0 | 108 | 0 |
| D | 0 | 108 | 0 |
| Mode M0 | |||
|---|---|---|---|
| Quadrant | BADHDUFLAG | Total packets | Discarded packets |
| A | 0 | 11386 | 2 |
| B | 0 | 10760 | 1 |
| C | 0 | 10869 | 1 |
| D | 0 | 13116 | 1 |
| Mode M9 | |||
|---|---|---|---|
| Quadrant | BADHDUFLAG | Total packets | Discarded packets |
| A | 0 | 28 | 0 |
| B | 0 | 28 | 0 |
| C | 0 | 28 | 0 |
| D | 0 | 29 | 0 |
| Quadrant | Total seconds | Saturated seconds | Saturation percentage |
|---|---|---|---|
| A | 5319 | 10 | 0.188005% |
| B | 5319 | 9 | 0.169205% |
| C | 5319 | 8 | 0.150404% |
| D | 5319 | 107 | 2.011656% |
Noise dominated data is calculated using 1-second bins in cleaned event files. If a bin has >2000 counts, and if more than 50% of those come from <1% of pixels, then it is considered to be noise-dominated and hence unusable.
| Quadrant | # 1 sec bins | Bins with >0 counts | Bins with >2000 counts | High rate bins dominated by noise | Noise dominated (total time) | Noise dominated (detector-on time) | Marked lightcurve |
|---|---|---|---|---|---|---|---|
| A | 7173 | 5320 | 6 | 6 | 0.08% | 0.11% | 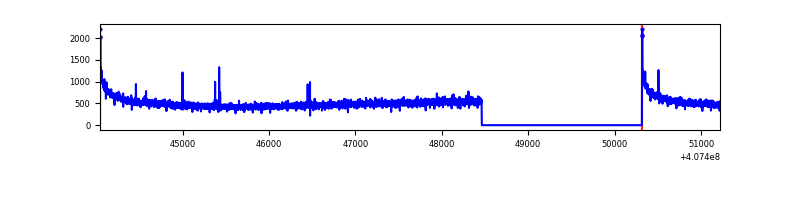 |
| B | 7173 | 5320 | 0 | 0 | 0.00% | 0.00% | 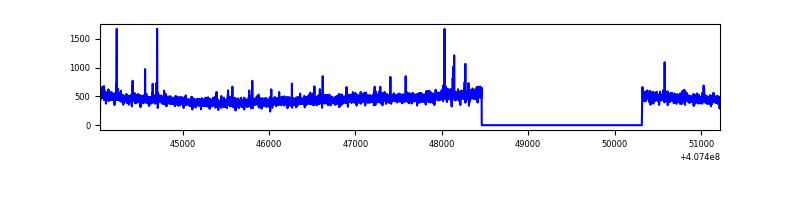 |
| C | 7173 | 5320 | 4 | 4 | 0.06% | 0.08% | 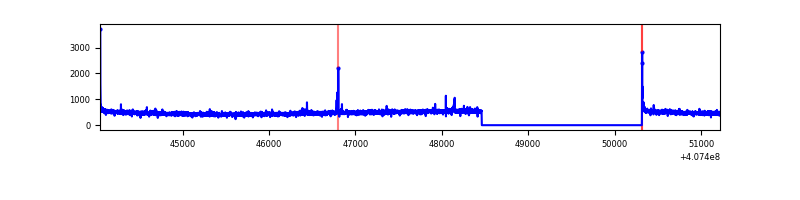 |
| D | 7173 | 5320 | 108 | 108 | 1.51% | 2.03% | 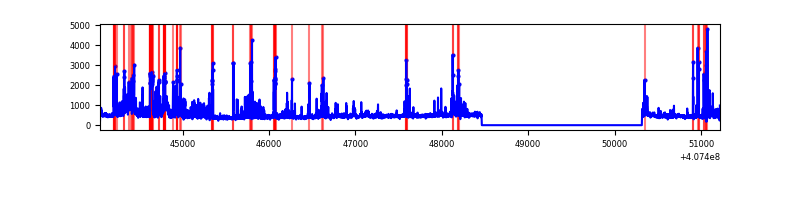 |
Top three noisy pixels from each quadrant. If the there are fewer than three noisy pixels in the level2.evt file, extra rows are filled as -1
| Pixel properties | Quadrant properties | ||||||
|---|---|---|---|---|---|---|---|
| Quadrant | DetID | PixID | Counts | Sigma | Mean | Median | Sigma |
| A | 10 | 83 | 389158 | 3213.05 | 600 | 590 | 120.9 |
| A | 13 | 254 | 8058 | 61.75 | 600 | 590 | 120.9 |
| A | 3 | 137 | 6498 | 48.85 | 600 | 590 | 120.9 |
| B | 0 | 230 | 23125 | 193.45 | 601 | 585 | 116.5 |
| B | 4 | 171 | 14853 | 122.46 | 601 | 585 | 116.5 |
| B | 12 | 111 | 14531 | 119.69 | 601 | 585 | 116.5 |
| C | 15 | 214 | 237540 | 1728.59 | 584 | 588 | 137.1 |
| C | 0 | 10 | 20087 | 142.25 | 584 | 588 | 137.1 |
| C | 15 | 208 | 18667 | 131.89 | 584 | 588 | 137.1 |
| D | 2 | 16 | 392817 | 2838.47 | 573 | 558 | 138.2 |
| D | 2 | 249 | 200395 | 1446.06 | 573 | 558 | 138.2 |
| D | 12 | 233 | 189939 | 1370.4 | 573 | 558 | 138.2 |
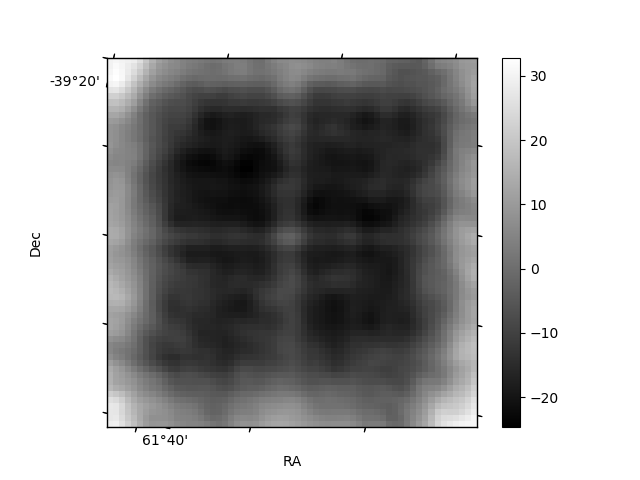
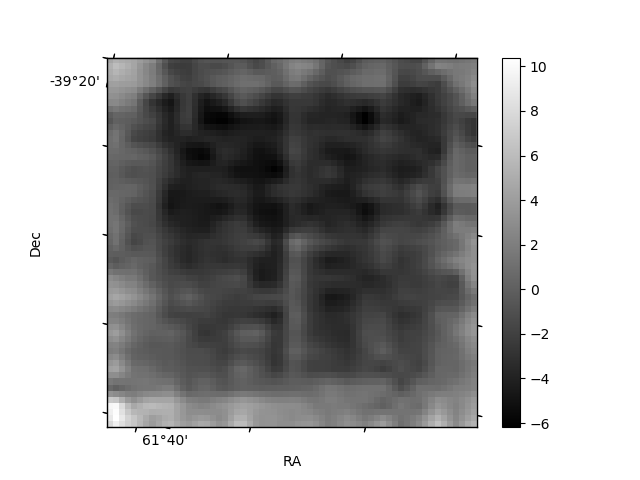
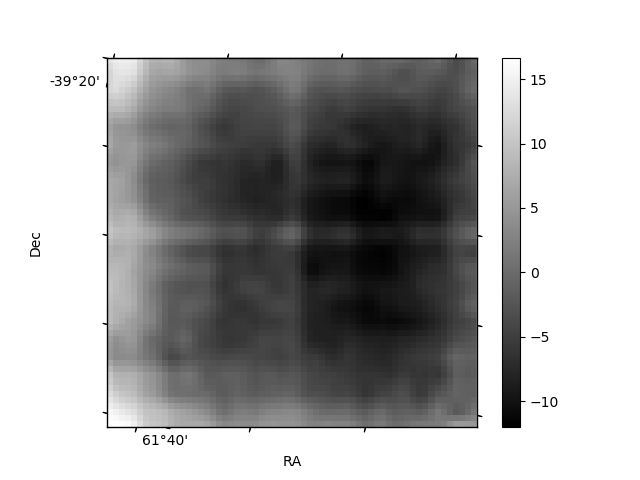
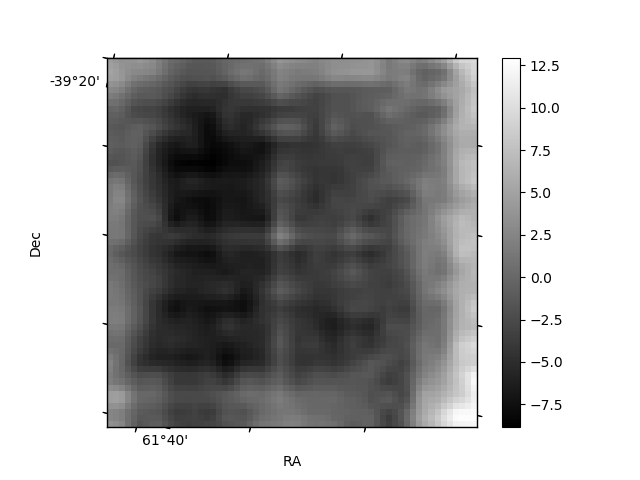
Histogram calculated using DETX and DETY for each event in the final _common_clean file
| Quadrant A | 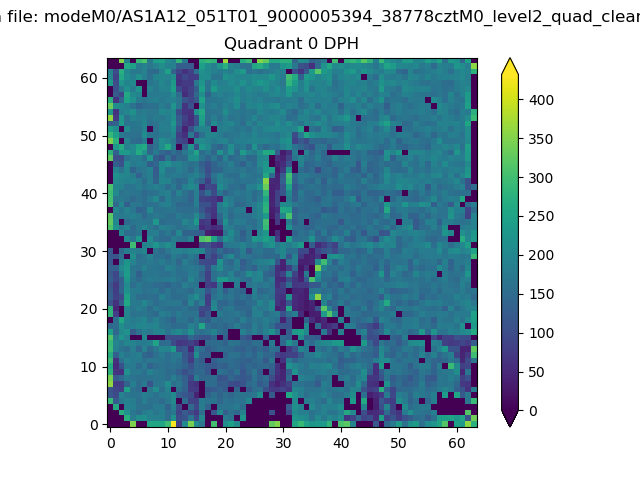 |
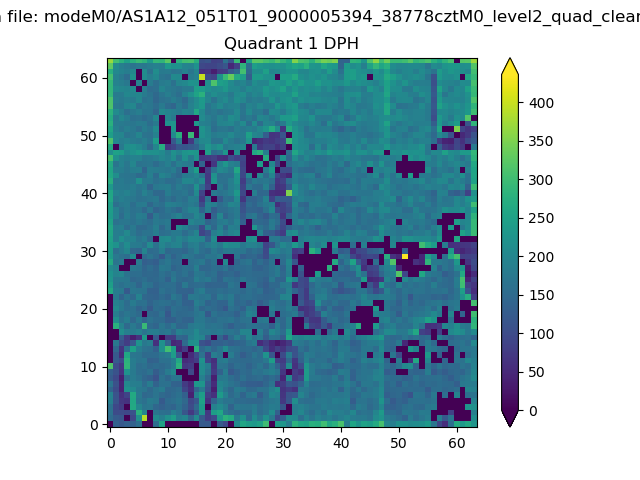 |
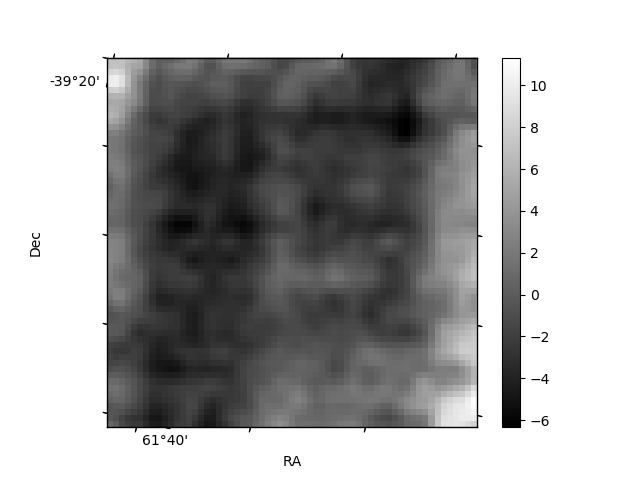
Quadrant B |
|---|---|---|---|
| Quadrant D | 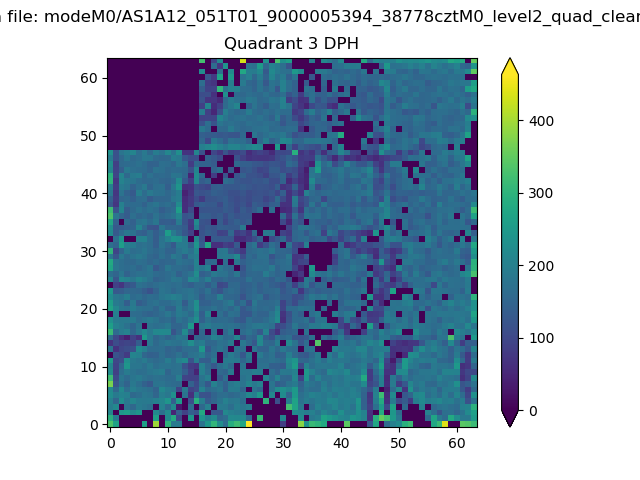 |
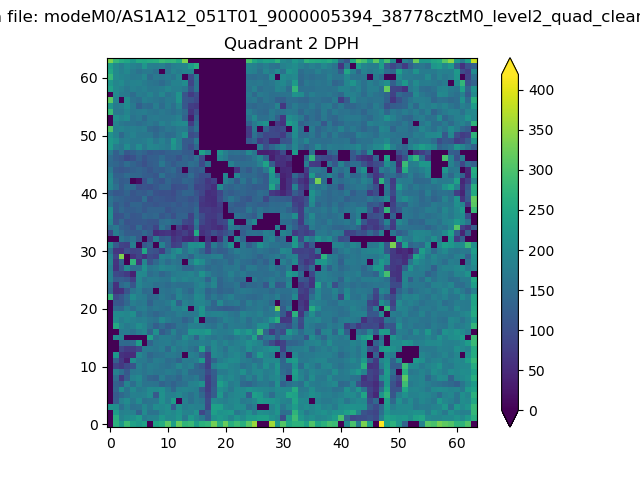 |
Quadrant C |
| Plot type | Count rate plots | Images |
|---|---|---|
| Comparison with Poisson distribution Blue bars denote a histogram of data divided into 1 sec bins. Red curve is a Poisson curve with rate = median count rate of data. |
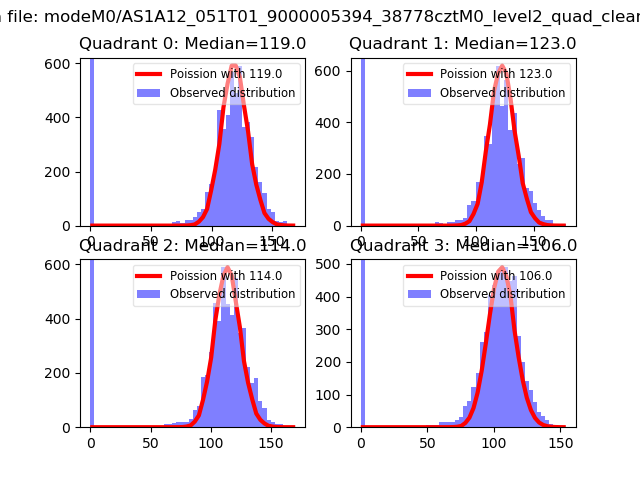 |
 |
| Quadrant-wise count rates Data is divided into 100 sec bins |
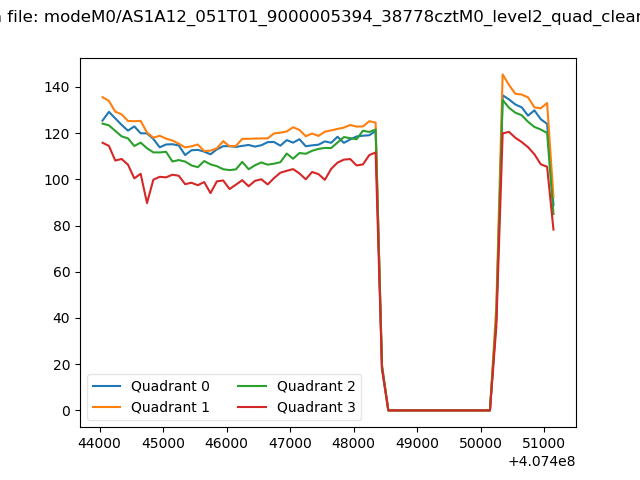 |
|
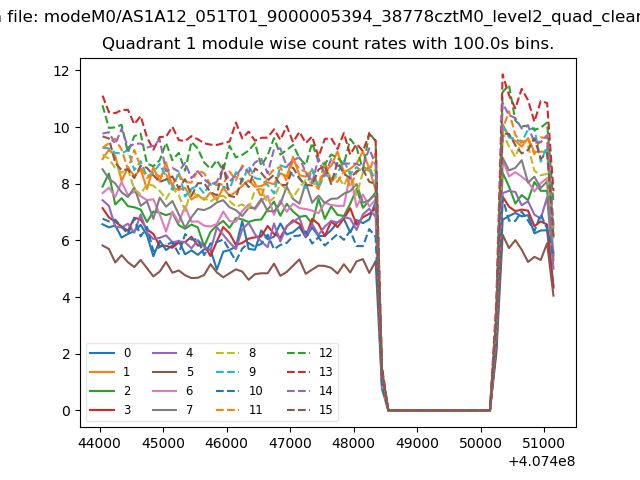
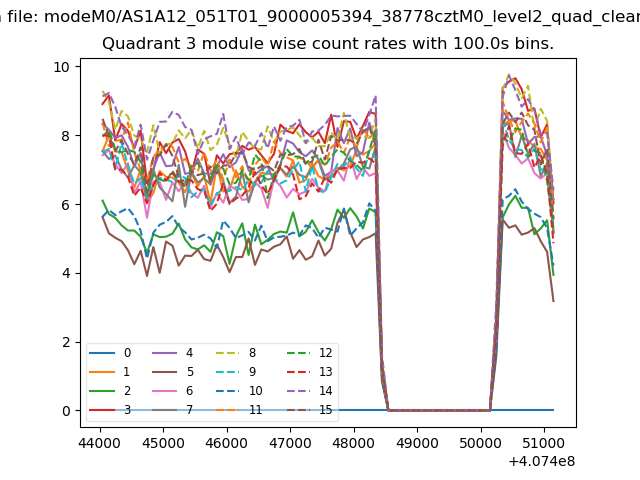
| Module-wise count rates for Quadrant A Data is divided into 100 sec bins |
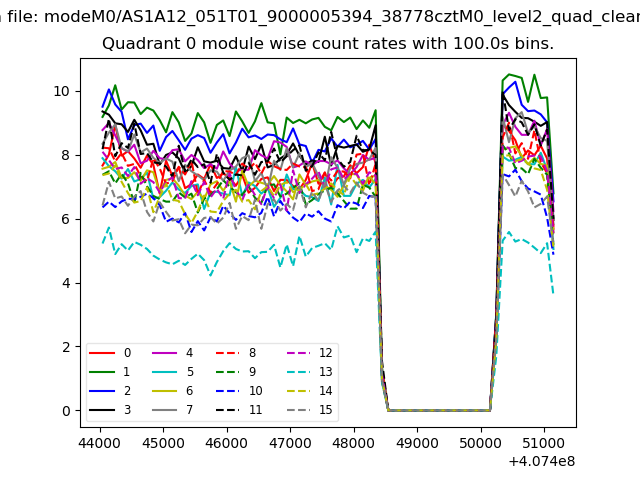 |
 |
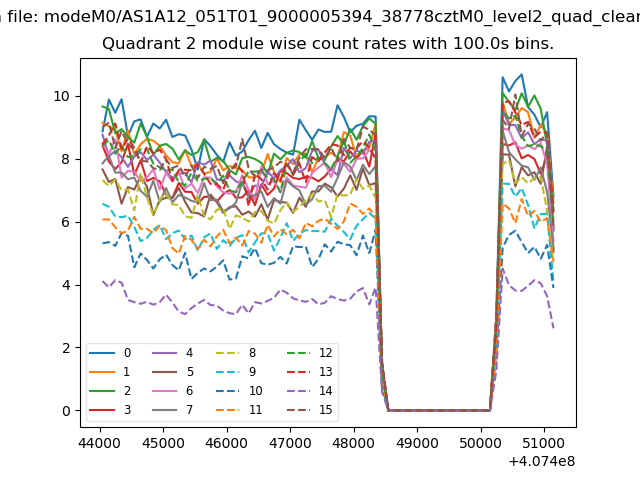
| Module-wise count rates for Quadrant B Data is divided into 100 sec bins |
 |
 |
| Module-wise count rates for Quadrant C Data is divided into 100 sec bins |
 |
 |
| Module-wise count rates for Quadrant D Data is divided into 100 sec bins |
 |
 |
| Parameter | Plot |
|---|---|
| CZT HV Monitor | 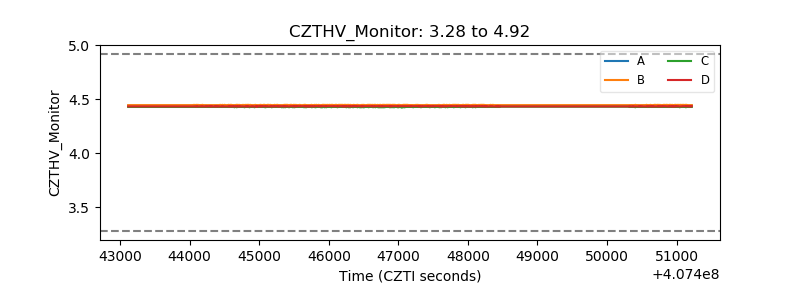 |
| D_VDD | 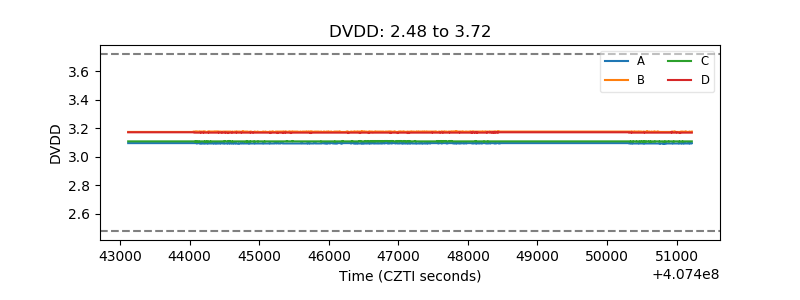 |
| Temperature 1 | 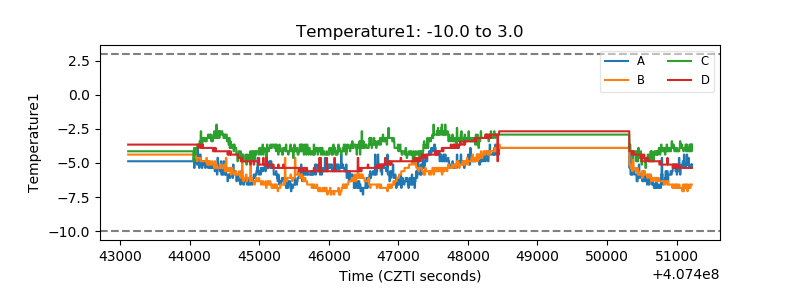 |
| Veto HV Monitor | 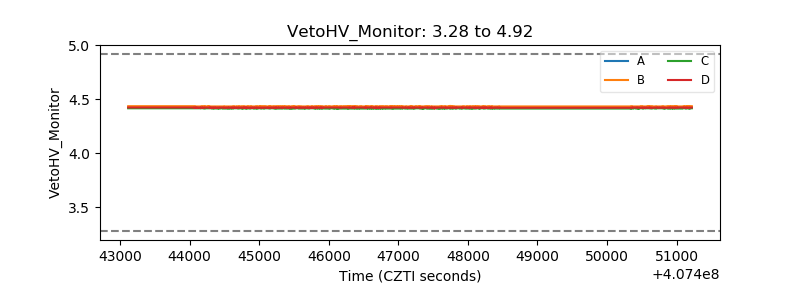 |
| Veto LLD | 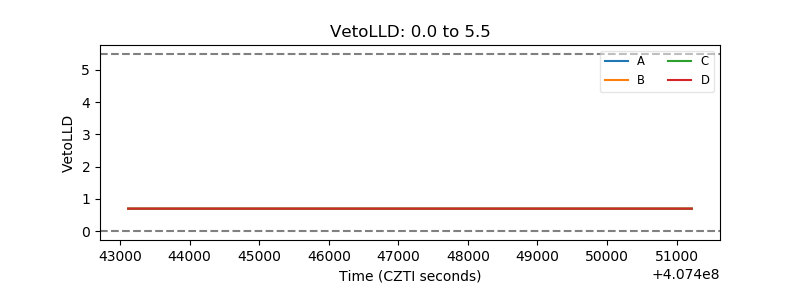 |
| Alpha Counter | 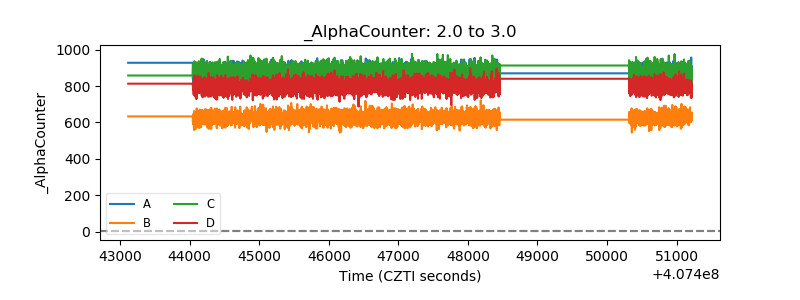 |
| _CPM_Rate |  |
| CZT Counter | 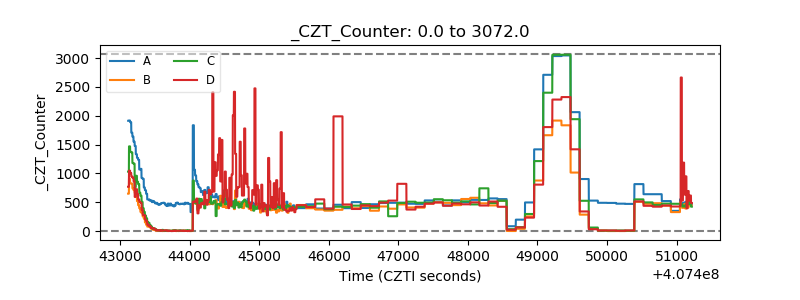 |
| +2.5 Volts monitor | 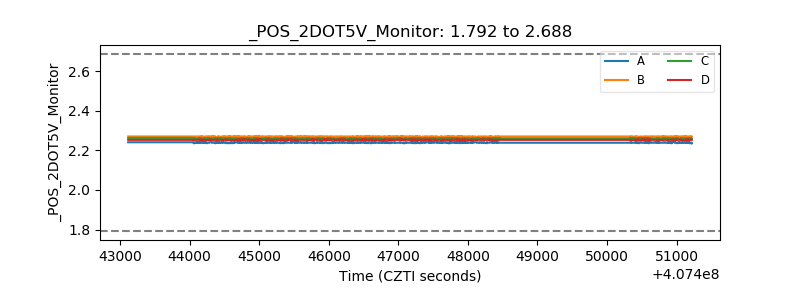 |
| +5 Volts monitor |  |
| _ROLL_ROT | 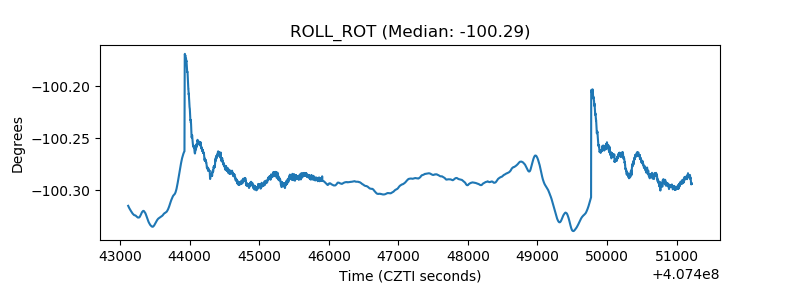 |
| _Roll_DEC | 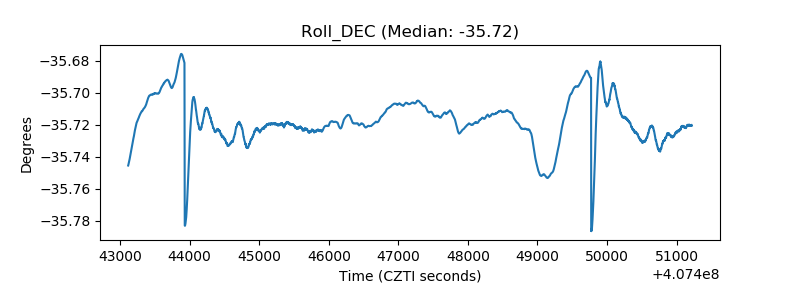 |
| _Roll_RA | 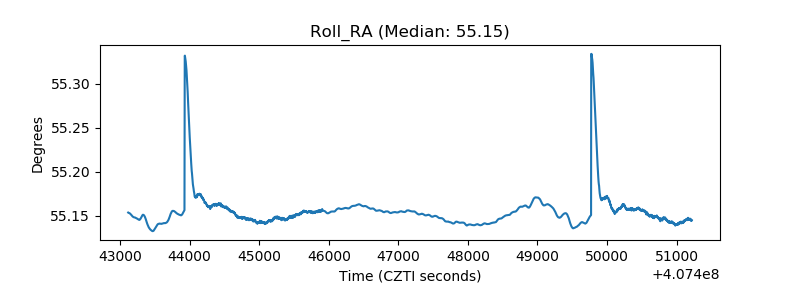 |
| Veto Counter | 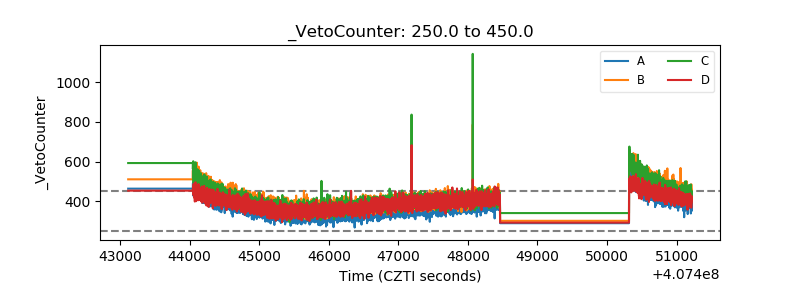 |