| Param | Original file | Final file |
|---|---|---|
| Filename | modeM0/AS1A12_051T01_9000005394_38780cztM0_level2.fits | modeM0/AS1A12_051T01_9000005394_38780cztM0_level2_quad_clean.evt |
| Size (bytes) | 316,673,280 | 93,032,640 |
| Size | 302.0 MB | 88.7 MB |
| Events in quadrant A | 2,784,213 | 629,659 |
| Events in quadrant B | 2,451,517 | 662,884 |
| Events in quadrant C | 2,575,629 | 619,130 |
| Events in quadrant D | 3,519,893 | 553,743 |
| Mode SS | |||
|---|---|---|---|
| Quadrant | BADHDUFLAG | Total packets | Discarded packets |
| A | 0 | 102 | 0 |
| B | 0 | 102 | 0 |
| C | 0 | 102 | 0 |
| D | 0 | 102 | 0 |
| Mode M0 | |||
|---|---|---|---|
| Quadrant | BADHDUFLAG | Total packets | Discarded packets |
| A | 0 | 11243 | 3 |
| B | 0 | 10331 | 2 |
| C | 0 | 10349 | 2 |
| D | 0 | 13815 | 2 |
| Mode M9 | |||
|---|---|---|---|
| Quadrant | BADHDUFLAG | Total packets | Discarded packets |
| A | 0 | 38 | 0 |
| B | 0 | 38 | 0 |
| C | 0 | 38 | 0 |
| D | 0 | 39 | 0 |
| Quadrant | Total seconds | Saturated seconds | Saturation percentage |
|---|---|---|---|
| A | 5022 | 13 | 0.258861% |
| B | 5022 | 9 | 0.179211% |
| C | 5022 | 4 | 0.079650% |
| D | 5022 | 107 | 2.130625% |
Noise dominated data is calculated using 1-second bins in cleaned event files. If a bin has >2000 counts, and if more than 50% of those come from <1% of pixels, then it is considered to be noise-dominated and hence unusable.
| Quadrant | # 1 sec bins | Bins with >0 counts | Bins with >2000 counts | High rate bins dominated by noise | Noise dominated (total time) | Noise dominated (detector-on time) | Marked lightcurve |
|---|---|---|---|---|---|---|---|
| A | 7115 | 5023 | 10 | 10 | 0.14% | 0.20% | 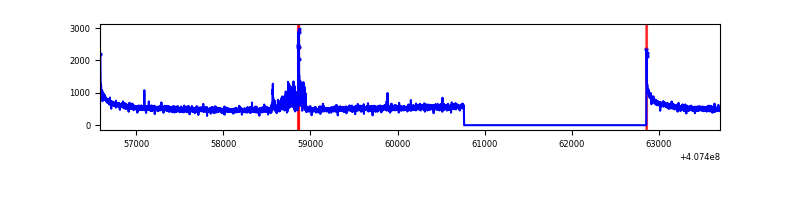 |
| B | 7115 | 5023 | 1 | 1 | 0.01% | 0.02% | 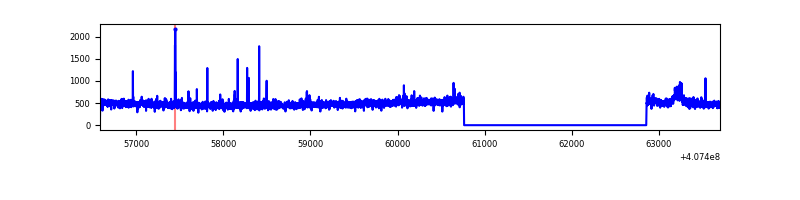 |
| C | 7115 | 5023 | 4 | 4 | 0.06% | 0.08% |  |
| D | 7115 | 5023 | 103 | 103 | 1.45% | 2.05% | 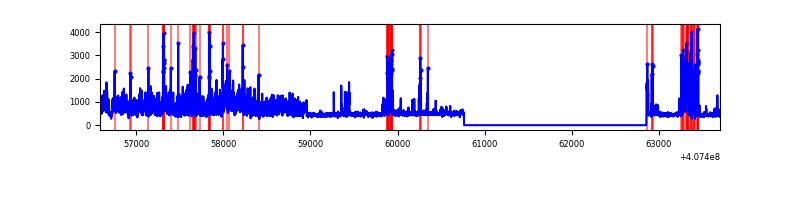 |
Top three noisy pixels from each quadrant. If the there are fewer than three noisy pixels in the level2.evt file, extra rows are filled as -1
| Pixel properties | Quadrant properties | ||||||
|---|---|---|---|---|---|---|---|
| Quadrant | DetID | PixID | Counts | Sigma | Mean | Median | Sigma |
| A | 10 | 83 | 378954 | 3200.16 | 588 | 577 | 118.2 |
| A | 7 | 3 | 116213 | 978.0 | 588 | 577 | 118.2 |
| A | 15 | 223 | 10414 | 83.2 | 588 | 577 | 118.2 |
| B | 5 | 200 | 39131 | 338.41 | 596 | 579 | 113.9 |
| B | 4 | 171 | 24520 | 210.15 | 596 | 579 | 113.9 |
| B | 4 | 251 | 16385 | 138.74 | 596 | 579 | 113.9 |
| C | 15 | 214 | 223332 | 1624.7 | 587 | 593 | 137.1 |
| C | 0 | 239 | 35475 | 254.44 | 587 | 593 | 137.1 |
| C | 0 | 10 | 15915 | 111.76 | 587 | 593 | 137.1 |
| D | 2 | 16 | 737269 | 5352.42 | 571 | 555 | 137.6 |
| D | 10 | 118 | 463615 | 3364.25 | 571 | 555 | 137.6 |
| D | 2 | 249 | 95951 | 693.08 | 571 | 555 | 137.6 |
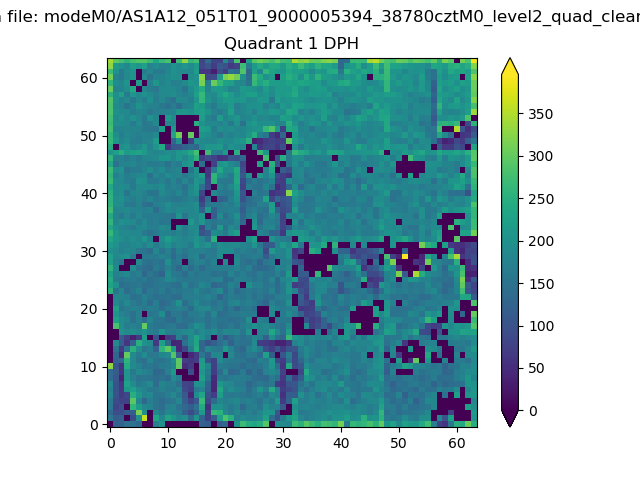
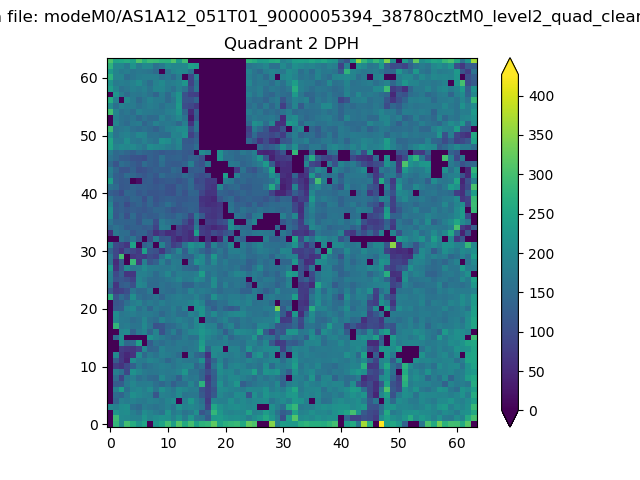
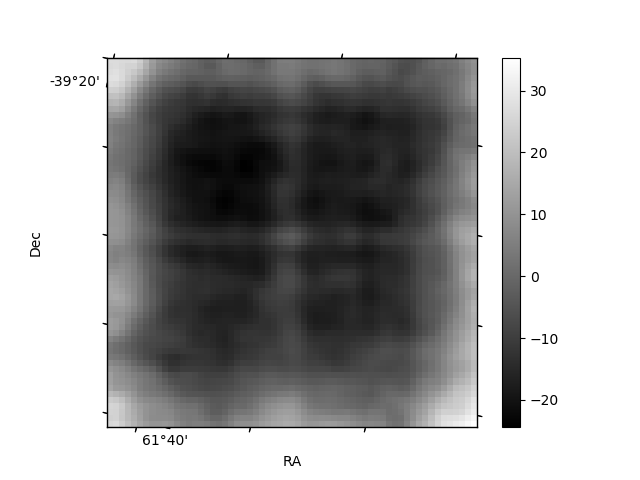
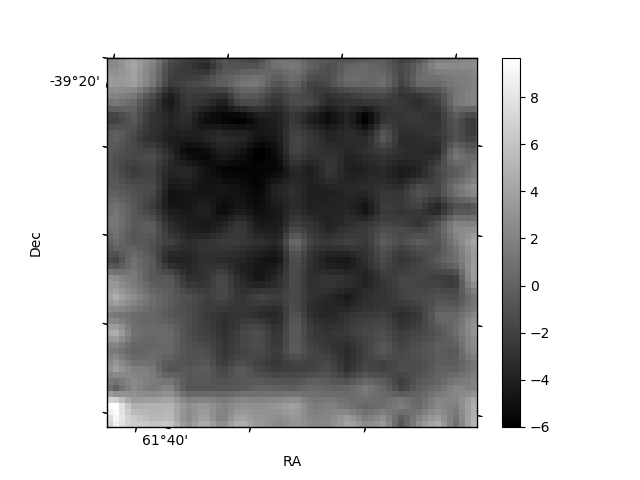
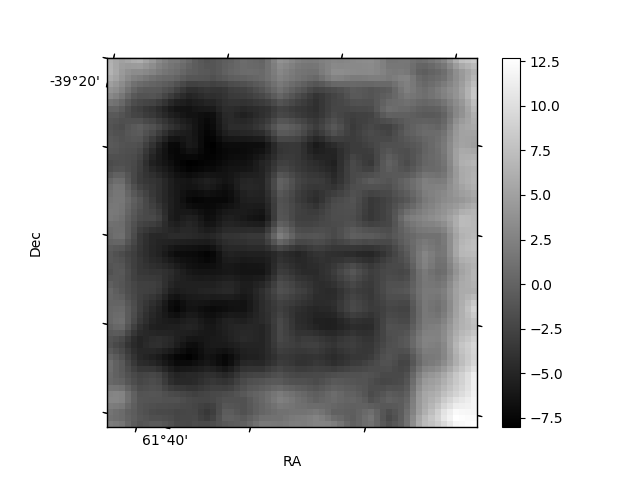
Histogram calculated using DETX and DETY for each event in the final _common_clean file
| Quadrant A | 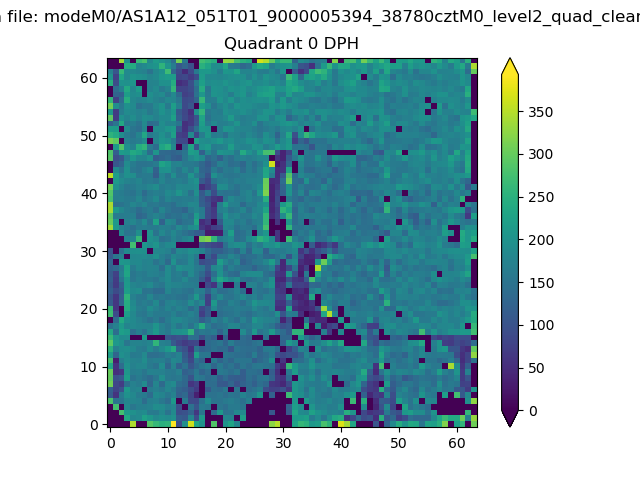 |
 |
Quadrant B |
|---|---|---|---|
| Quadrant D | 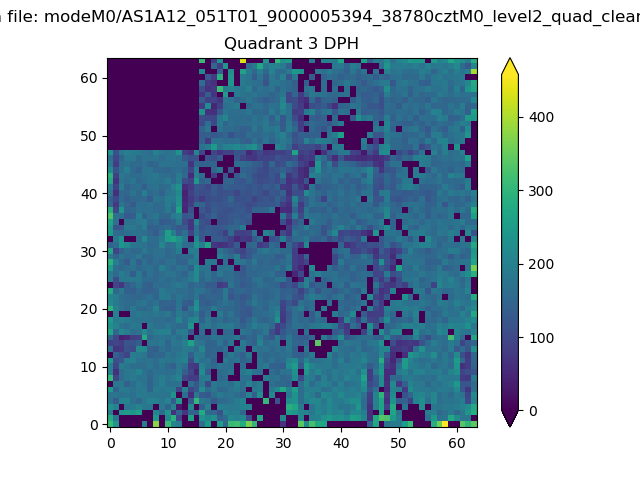 |
 |
Quadrant C |
| Plot type | Count rate plots | Images |
|---|---|---|
| Comparison with Poisson distribution Blue bars denote a histogram of data divided into 1 sec bins. Red curve is a Poisson curve with rate = median count rate of data. |
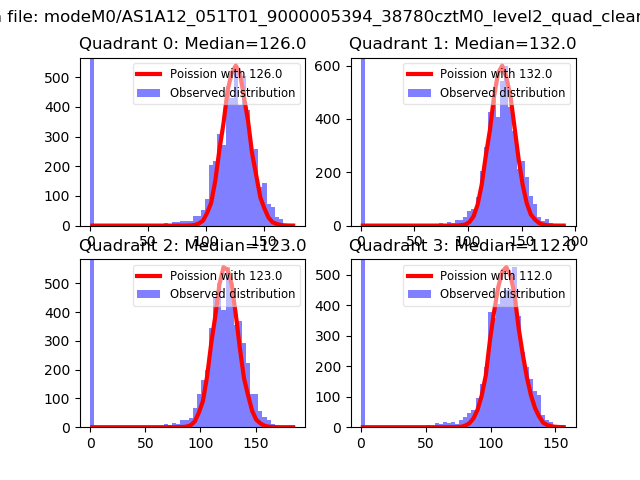 |
 |
| Quadrant-wise count rates Data is divided into 100 sec bins |
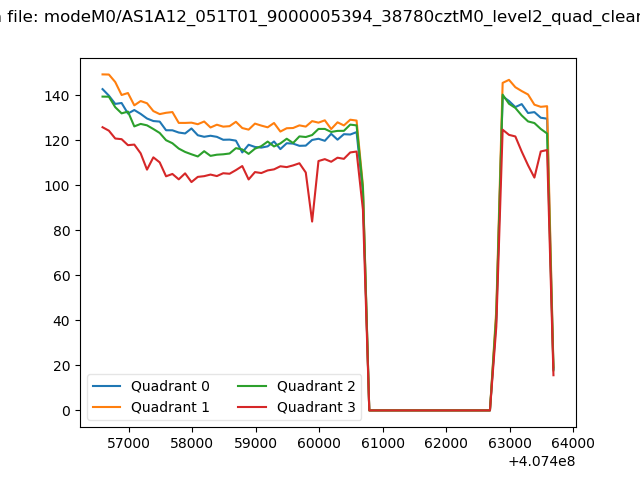 |
|
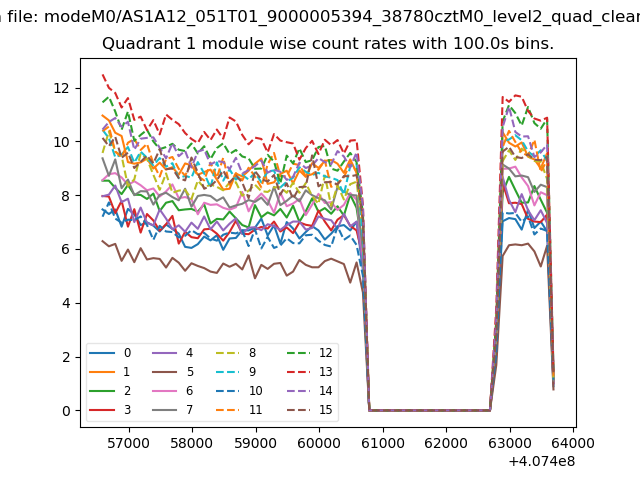
| Module-wise count rates for Quadrant A Data is divided into 100 sec bins |
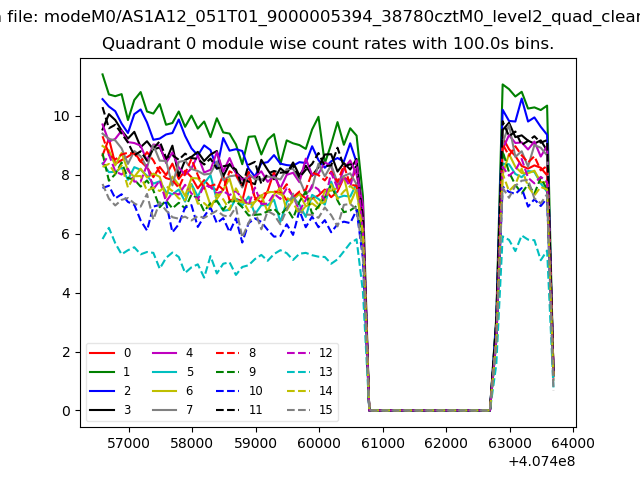 |
 |
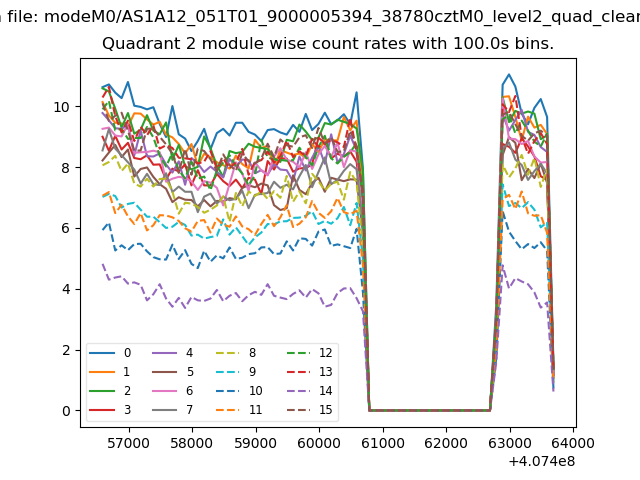
| Module-wise count rates for Quadrant B Data is divided into 100 sec bins |
 |
 |
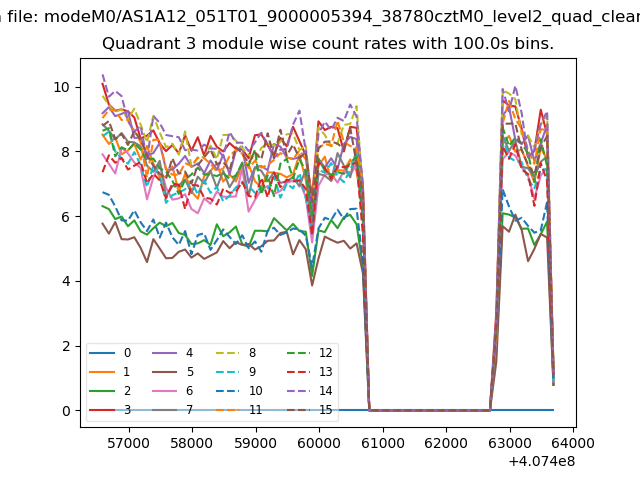
| Module-wise count rates for Quadrant C Data is divided into 100 sec bins |
 |
 |
| Module-wise count rates for Quadrant D Data is divided into 100 sec bins |
 |
 |
| Parameter | Plot |
|---|---|
| CZT HV Monitor | 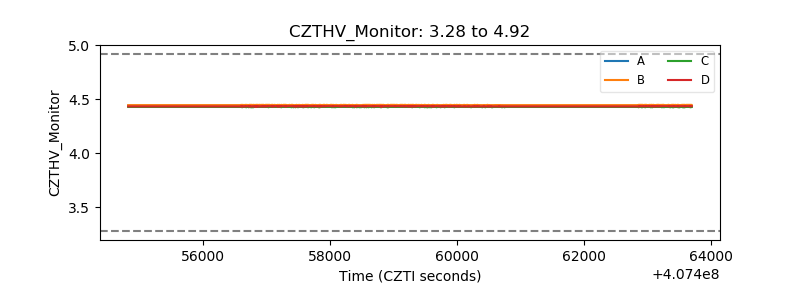 |
| D_VDD | 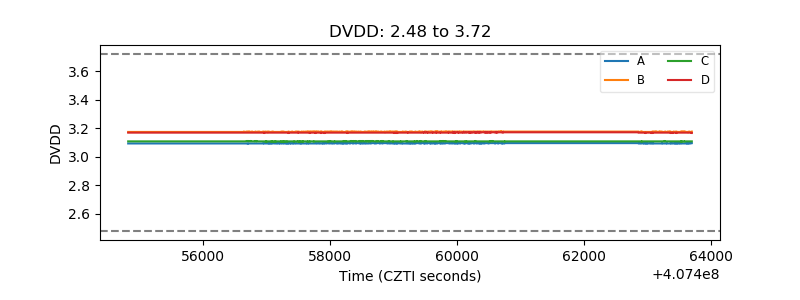 |
| Temperature 1 | 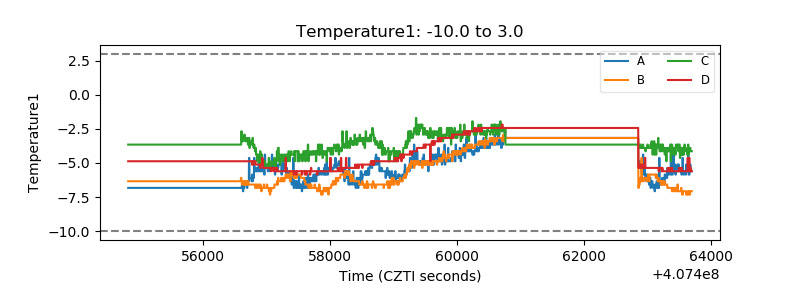 |
| Veto HV Monitor | 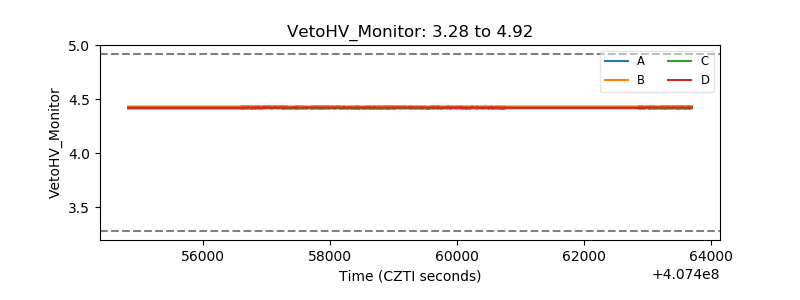 |
| Veto LLD | 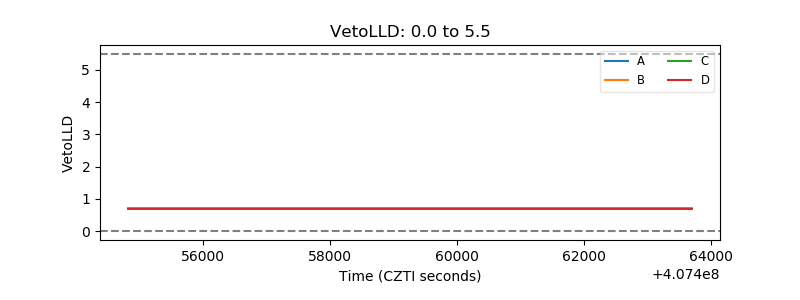 |
| Alpha Counter | 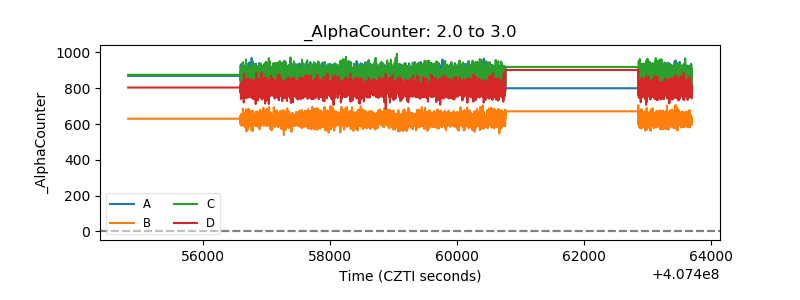 |
| _CPM_Rate | 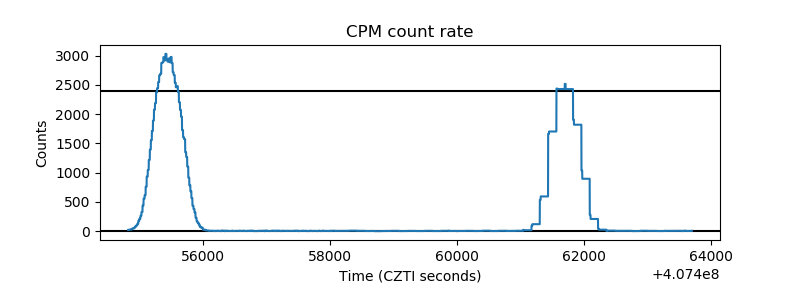 |
| CZT Counter | 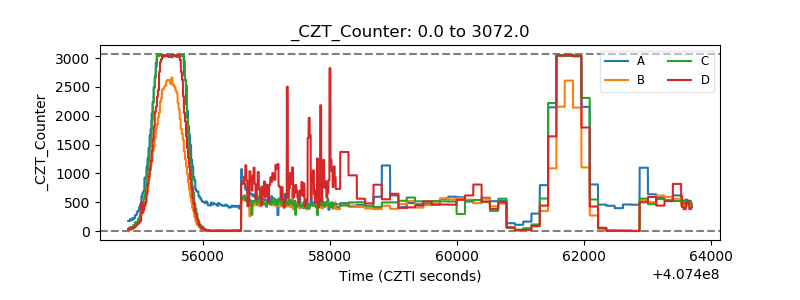 |
| +2.5 Volts monitor | 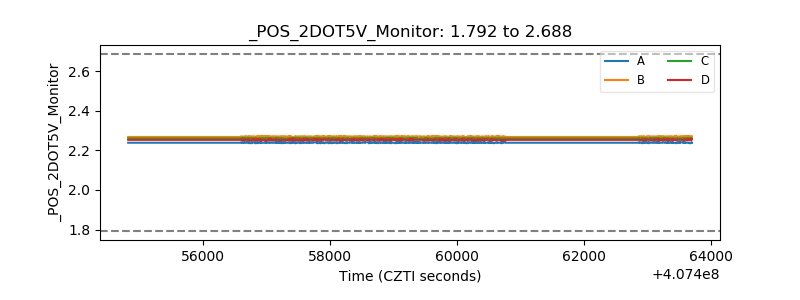 |
| +5 Volts monitor | 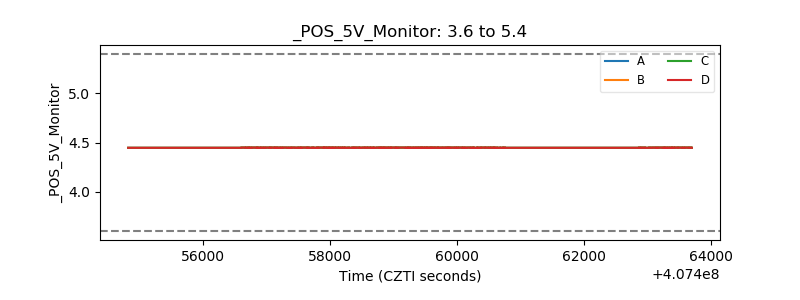 |
| _ROLL_ROT | 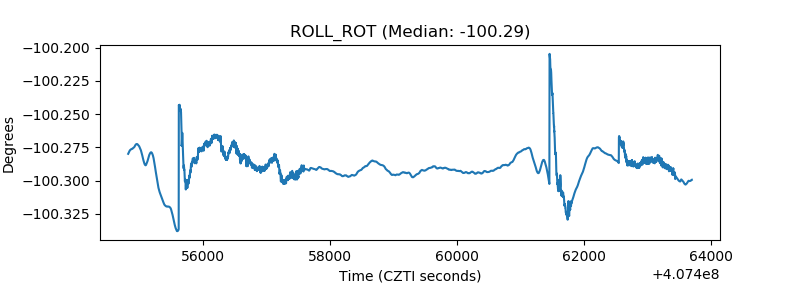 |
| _Roll_DEC | 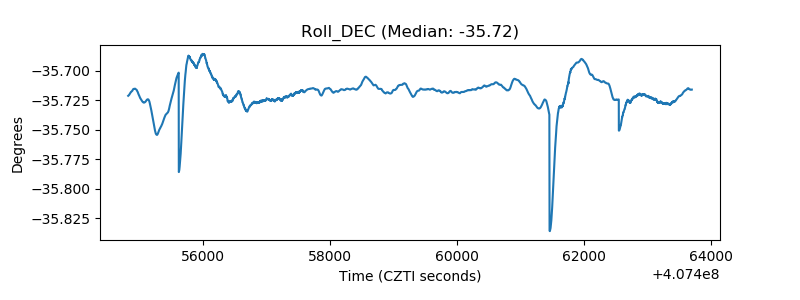 |
| _Roll_RA | 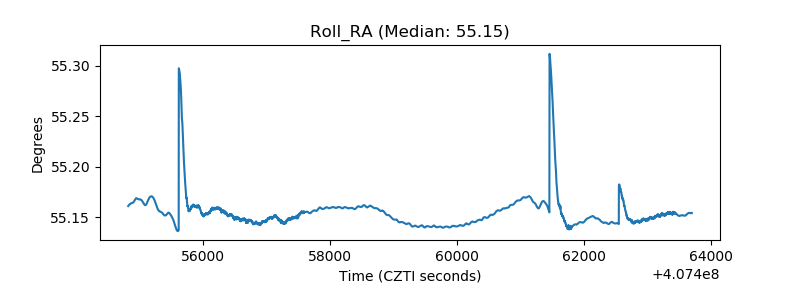 |
| Veto Counter | 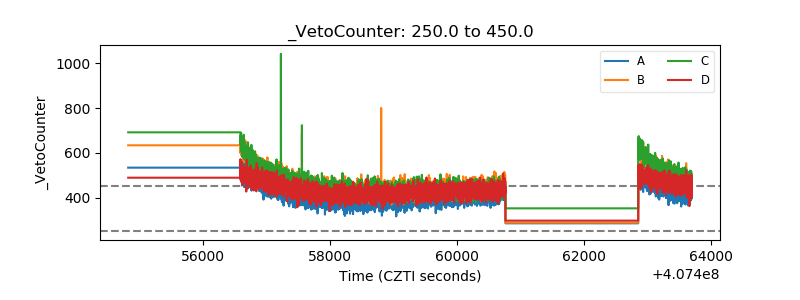 |