| Param | Original file | Final file |
|---|---|---|
| Filename | modeM0/AS1A12_051T01_9000005394_38781cztM0_level2.fits | modeM0/AS1A12_051T01_9000005394_38781cztM0_level2_quad_clean.evt |
| Size (bytes) | 299,675,520 | 93,012,480 |
| Size | 285.8 MB | 88.7 MB |
| Events in quadrant A | 2,683,210 | 626,704 |
| Events in quadrant B | 2,653,331 | 655,639 |
| Events in quadrant C | 2,645,064 | 618,593 |
| Events in quadrant D | 2,716,620 | 561,187 |
| Mode SS | |||
|---|---|---|---|
| Quadrant | BADHDUFLAG | Total packets | Discarded packets |
| A | 0 | 102 | 0 |
| B | 0 | 102 | 0 |
| C | 0 | 102 | 0 |
| D | 0 | 102 | 0 |
| Mode M0 | |||
|---|---|---|---|
| Quadrant | BADHDUFLAG | Total packets | Discarded packets |
| A | 0 | 10888 | 3 |
| B | 0 | 11012 | 2 |
| C | 0 | 10547 | 2 |
| D | 0 | 11395 | 2 |
| Mode M9 | |||
|---|---|---|---|
| Quadrant | BADHDUFLAG | Total packets | Discarded packets |
| A | 0 | 35 | 0 |
| B | 0 | 35 | 0 |
| C | 0 | 35 | 0 |
| D | 0 | 36 | 0 |
| Quadrant | Total seconds | Saturated seconds | Saturation percentage |
|---|---|---|---|
| A | 5064 | 8 | 0.157978% |
| B | 5064 | 46 | 0.908373% |
| C | 5064 | 10 | 0.197472% |
| D | 5064 | 62 | 1.224329% |
Noise dominated data is calculated using 1-second bins in cleaned event files. If a bin has >2000 counts, and if more than 50% of those come from <1% of pixels, then it is considered to be noise-dominated and hence unusable.
| Quadrant | # 1 sec bins | Bins with >0 counts | Bins with >2000 counts | High rate bins dominated by noise | Noise dominated (total time) | Noise dominated (detector-on time) | Marked lightcurve |
|---|---|---|---|---|---|---|---|
| A | 7217 | 5065 | 5 | 5 | 0.07% | 0.10% | 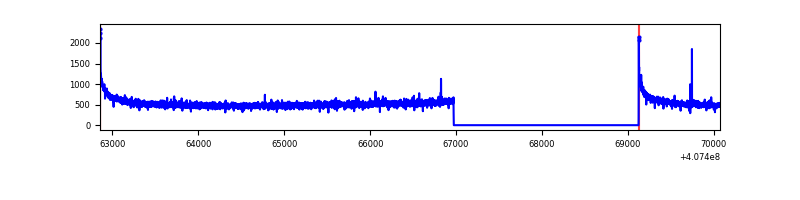 |
| B | 7217 | 5065 | 15 | 15 | 0.21% | 0.30% | 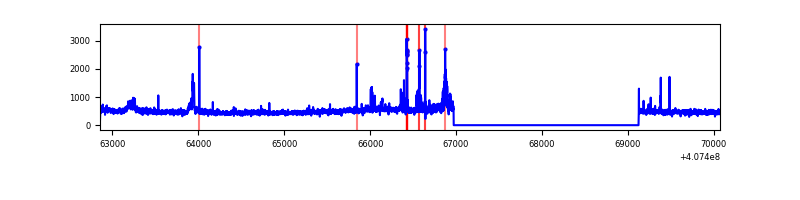 |
| C | 7217 | 5065 | 9 | 9 | 0.12% | 0.18% | 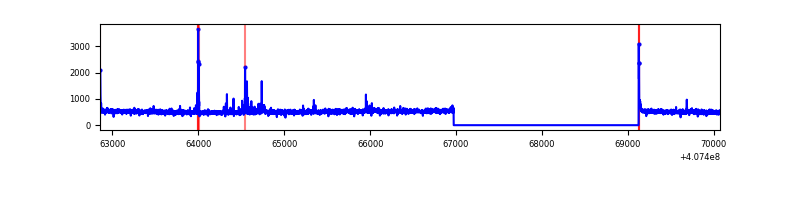 |
| D | 7217 | 5065 | 61 | 61 | 0.85% | 1.20% | 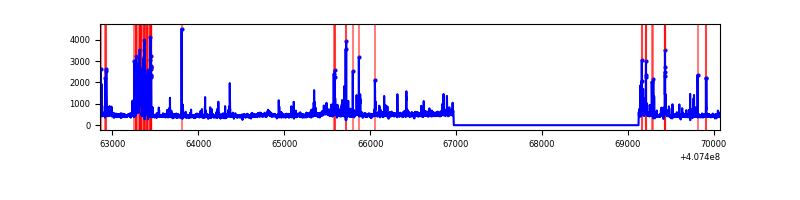 |
Top three noisy pixels from each quadrant. If the there are fewer than three noisy pixels in the level2.evt file, extra rows are filled as -1
| Pixel properties | Quadrant properties | ||||||
|---|---|---|---|---|---|---|---|
| Quadrant | DetID | PixID | Counts | Sigma | Mean | Median | Sigma |
| A | 10 | 83 | 385433 | 3247.39 | 591 | 580 | 118.5 |
| A | 13 | 254 | 7286 | 56.59 | 591 | 580 | 118.5 |
| A | 3 | 137 | 6133 | 46.86 | 591 | 580 | 118.5 |
| B | 4 | 171 | 152540 | 1326.27 | 595 | 579 | 114.6 |
| B | 5 | 200 | 115395 | 1002.08 | 595 | 579 | 114.6 |
| B | 12 | 111 | 14351 | 120.2 | 595 | 579 | 114.6 |
| C | 15 | 214 | 225555 | 1631.11 | 593 | 598 | 137.9 |
| C | 0 | 239 | 35073 | 249.97 | 593 | 598 | 137.9 |
| C | 15 | 208 | 32807 | 233.54 | 593 | 598 | 137.9 |
| D | 10 | 118 | 259366 | 1828.64 | 580 | 564 | 141.5 |
| D | 5 | 222 | 66837 | 468.27 | 580 | 564 | 141.5 |
| D | 2 | 249 | 59359 | 415.43 | 580 | 564 | 141.5 |
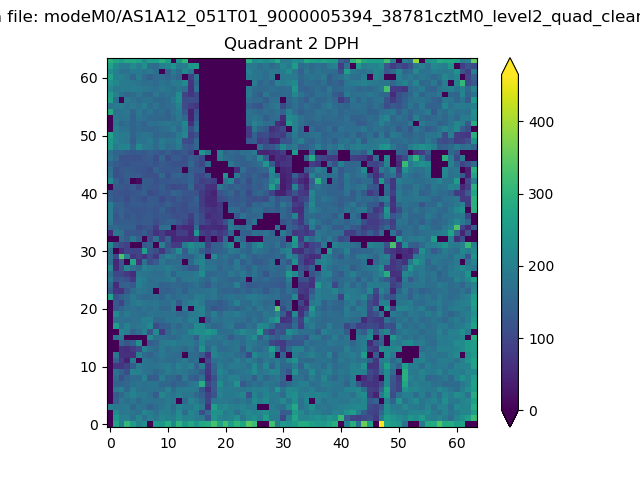
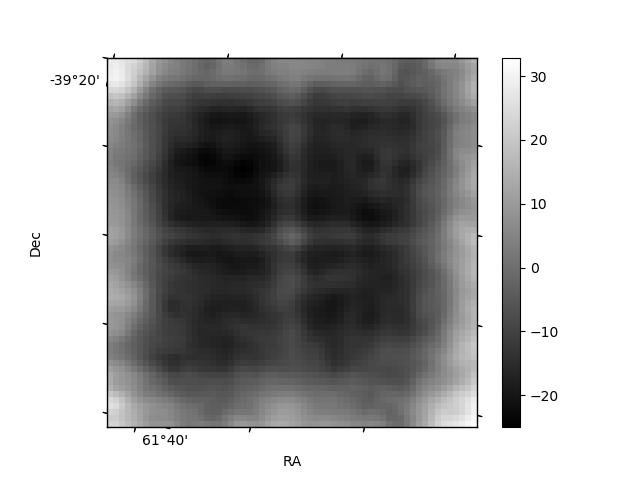
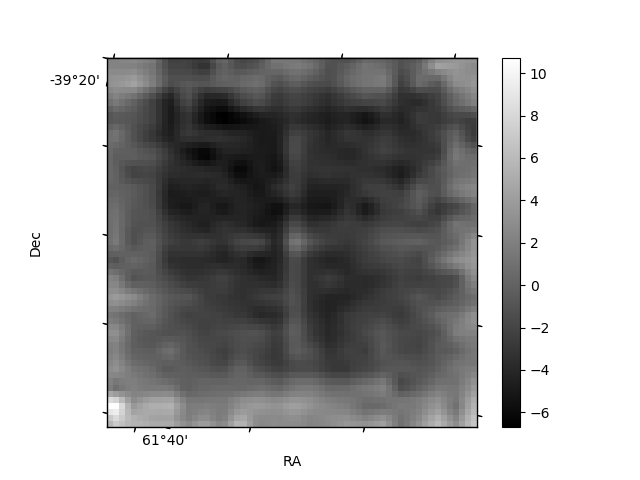
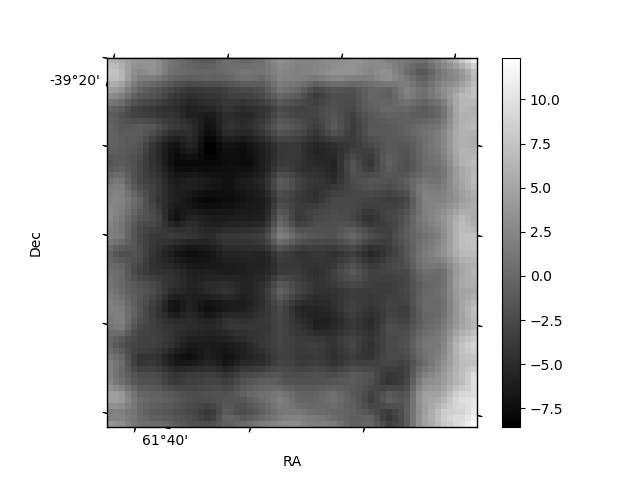
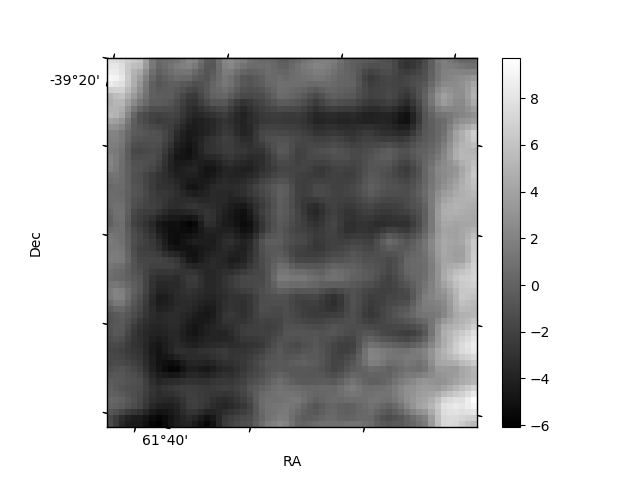
Histogram calculated using DETX and DETY for each event in the final _common_clean file
| Quadrant A | 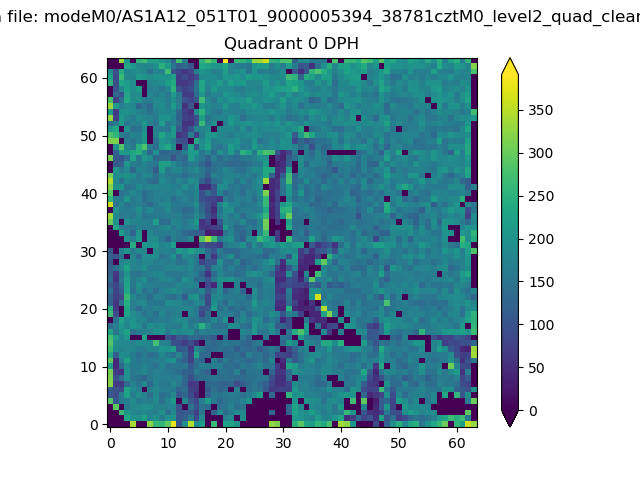 |
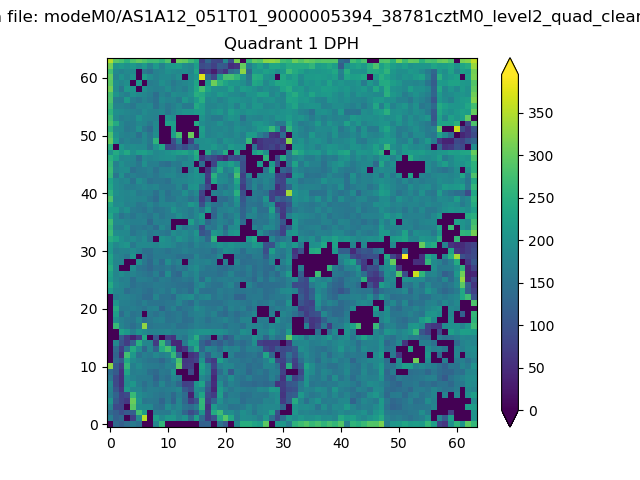 |
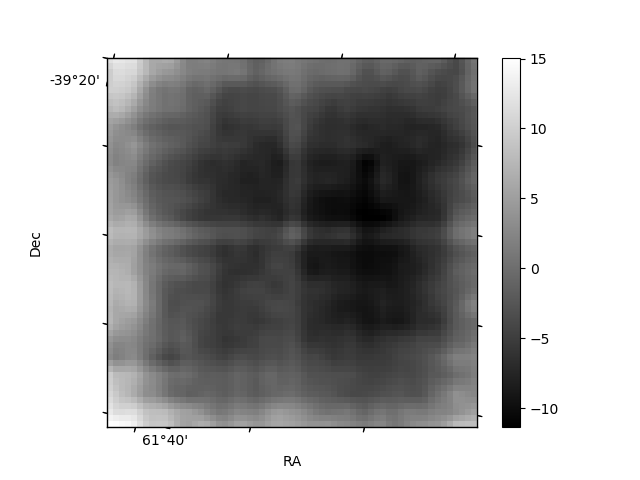
Quadrant B |
|---|---|---|---|
| Quadrant D | 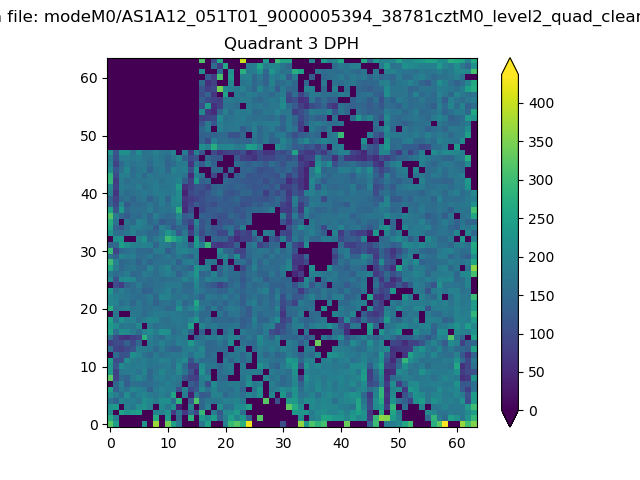 |
 |
Quadrant C |
| Plot type | Count rate plots | Images |
|---|---|---|
| Comparison with Poisson distribution Blue bars denote a histogram of data divided into 1 sec bins. Red curve is a Poisson curve with rate = median count rate of data. |
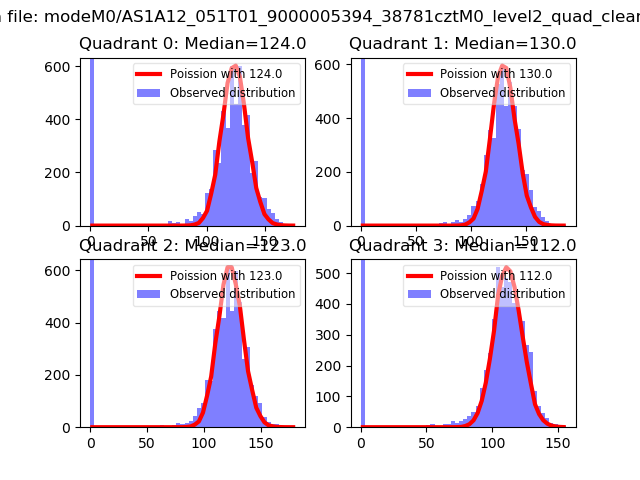 |
 |
| Quadrant-wise count rates Data is divided into 100 sec bins |
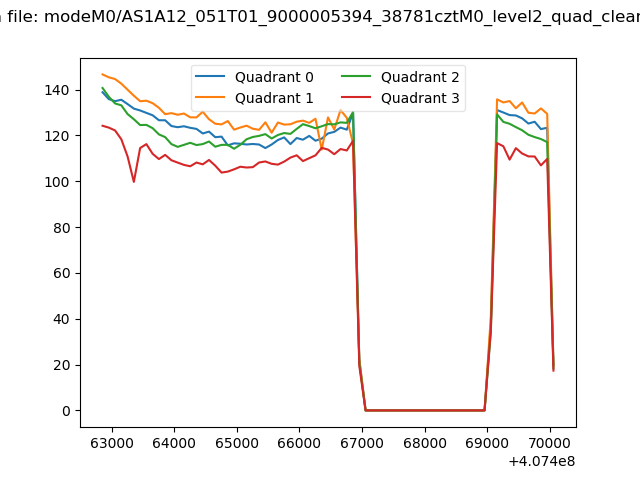 |
|
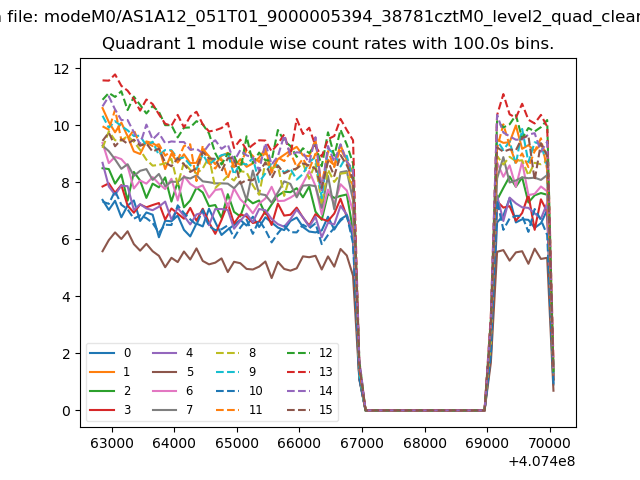
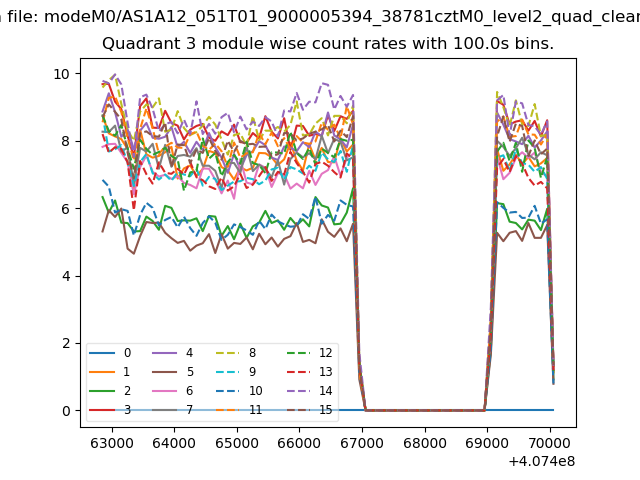
| Module-wise count rates for Quadrant A Data is divided into 100 sec bins |
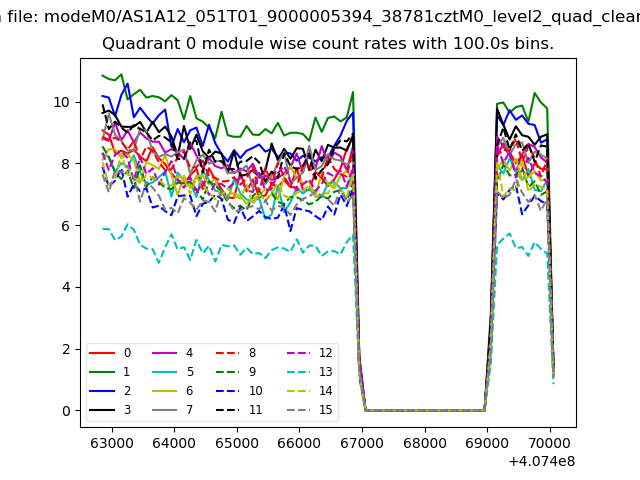 |
 |
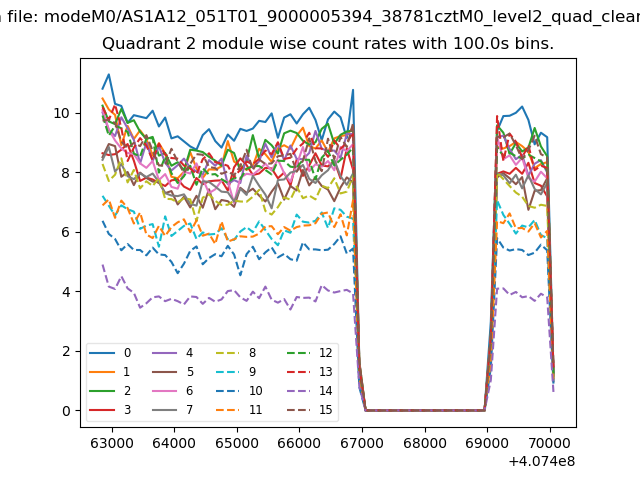
| Module-wise count rates for Quadrant B Data is divided into 100 sec bins |
 |
 |
| Module-wise count rates for Quadrant C Data is divided into 100 sec bins |
 |
 |
| Module-wise count rates for Quadrant D Data is divided into 100 sec bins |
 |
 |
| Parameter | Plot |
|---|---|
| CZT HV Monitor | 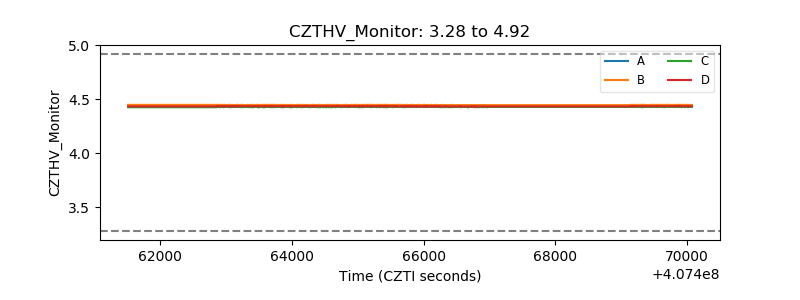 |
| D_VDD | 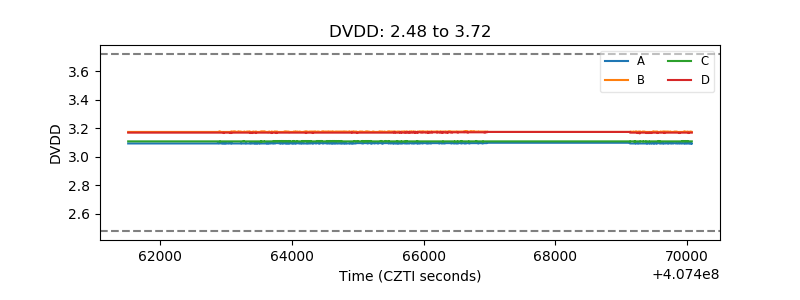 |
| Temperature 1 | 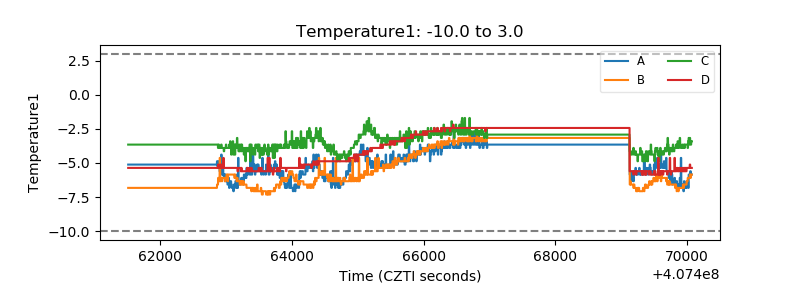 |
| Veto HV Monitor | 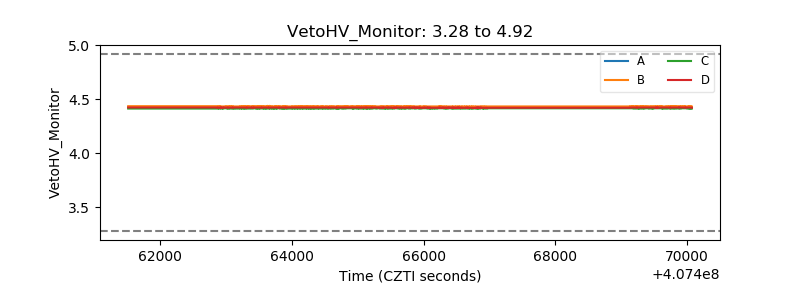 |
| Veto LLD | 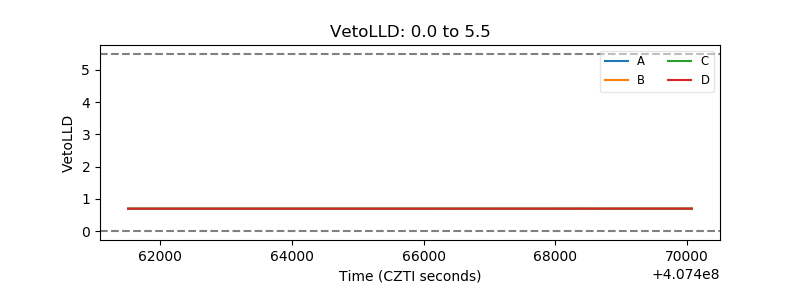 |
| Alpha Counter | 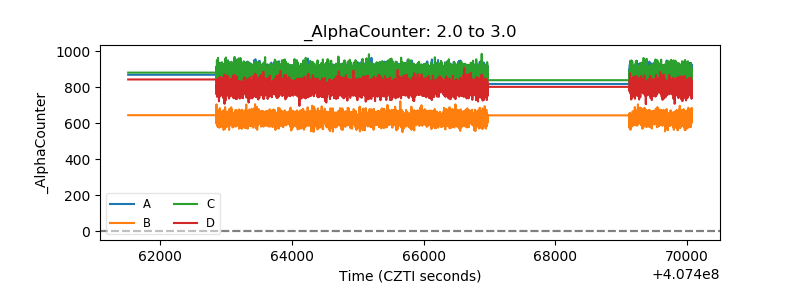 |
| _CPM_Rate | 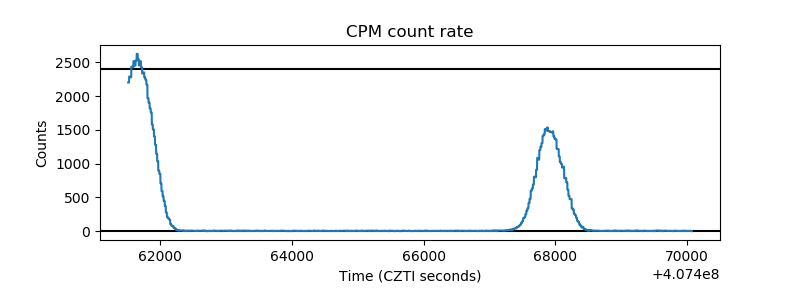 |
| CZT Counter | 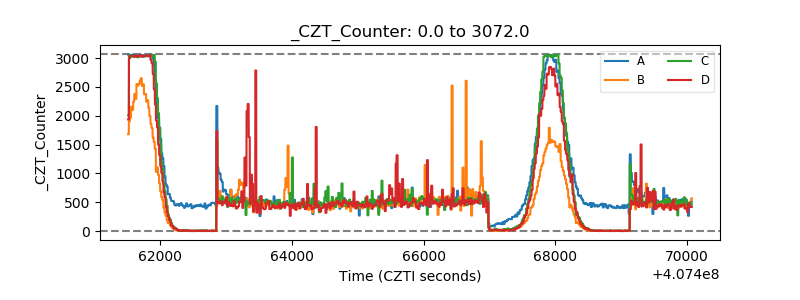 |
| +2.5 Volts monitor | 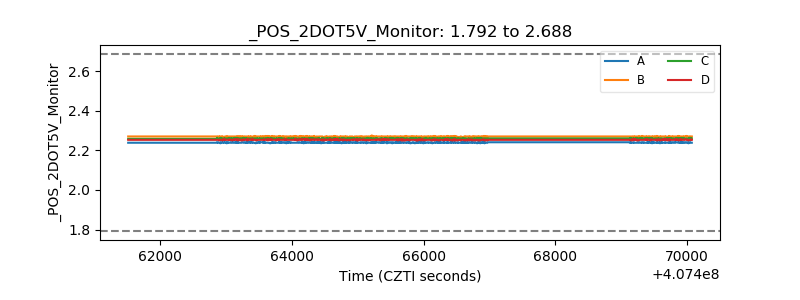 |
| +5 Volts monitor | 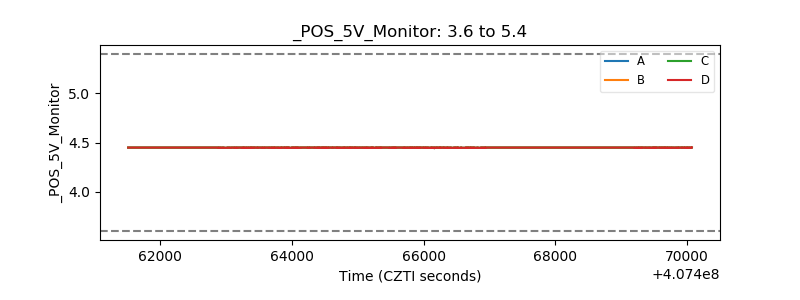 |
| _ROLL_ROT | 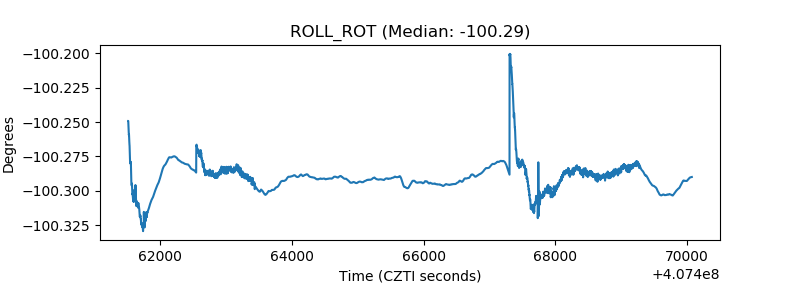 |
| _Roll_DEC | 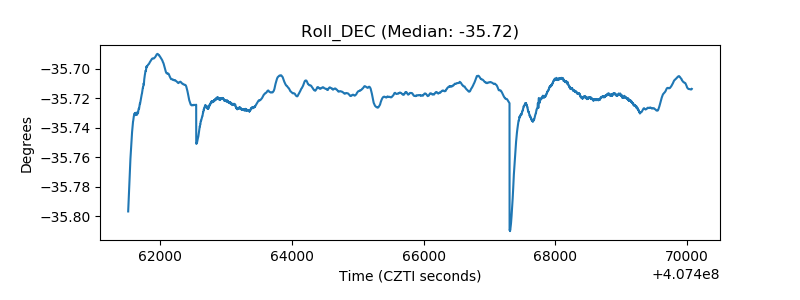 |
| _Roll_RA | 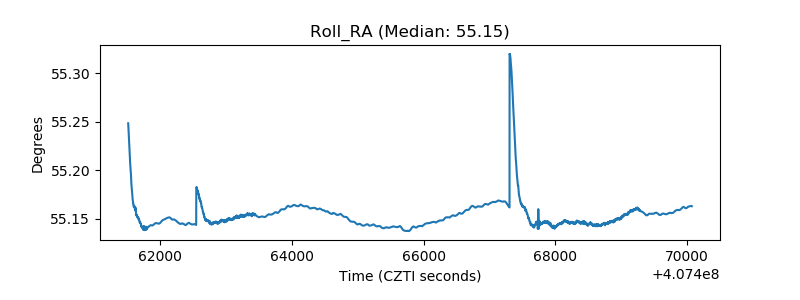 |
| Veto Counter | 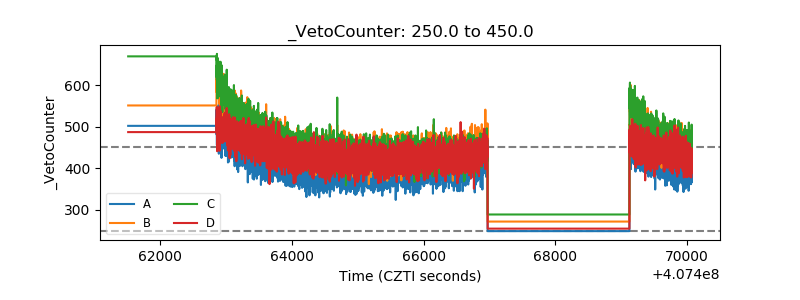 |