| Param | Original file | Final file |
|---|---|---|
| Filename | modeM0/AS1A12_051T01_9000005394_38782cztM0_level2.fits | modeM0/AS1A12_051T01_9000005394_38782cztM0_level2_quad_clean.evt |
| Size (bytes) | 306,273,600 | 87,837,120 |
| Size | 292.1 MB | 83.8 MB |
| Events in quadrant A | 2,860,887 | 585,514 |
| Events in quadrant B | 2,906,242 | 605,742 |
| Events in quadrant C | 2,534,959 | 585,230 |
| Events in quadrant D | 2,647,673 | 535,230 |
| Mode SS | |||
|---|---|---|---|
| Quadrant | BADHDUFLAG | Total packets | Discarded packets |
| A | 0 | 100 | 0 |
| B | 0 | 100 | 0 |
| C | 0 | 100 | 0 |
| D | 0 | 100 | 0 |
| Mode M0 | |||
|---|---|---|---|
| Quadrant | BADHDUFLAG | Total packets | Discarded packets |
| A | 0 | 11407 | 3 |
| B | 0 | 11852 | 2 |
| C | 0 | 10253 | 2 |
| D | 0 | 11235 | 2 |
| Mode M9 | |||
|---|---|---|---|
| Quadrant | BADHDUFLAG | Total packets | Discarded packets |
| A | 0 | 25 | 0 |
| B | 0 | 25 | 0 |
| C | 0 | 25 | 0 |
| D | 0 | 26 | 0 |
| Quadrant | Total seconds | Saturated seconds | Saturation percentage |
|---|---|---|---|
| A | 4970 | 93 | 1.871227% |
| B | 4970 | 179 | 3.601610% |
| C | 4970 | 10 | 0.201207% |
| D | 4970 | 29 | 0.583501% |
Noise dominated data is calculated using 1-second bins in cleaned event files. If a bin has >2000 counts, and if more than 50% of those come from <1% of pixels, then it is considered to be noise-dominated and hence unusable.
| Quadrant | # 1 sec bins | Bins with >0 counts | Bins with >2000 counts | High rate bins dominated by noise | Noise dominated (total time) | Noise dominated (detector-on time) | Marked lightcurve |
|---|---|---|---|---|---|---|---|
| A | 7063 | 4971 | 79 | 79 | 1.12% | 1.59% | 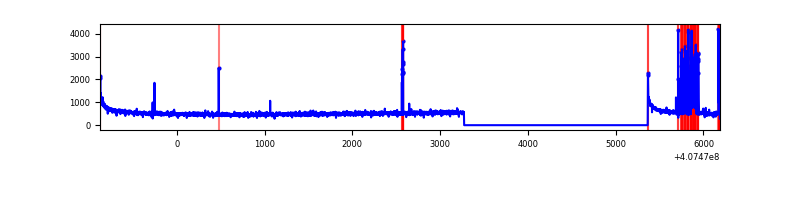 |
| B | 7063 | 4971 | 109 | 109 | 1.54% | 2.19% | 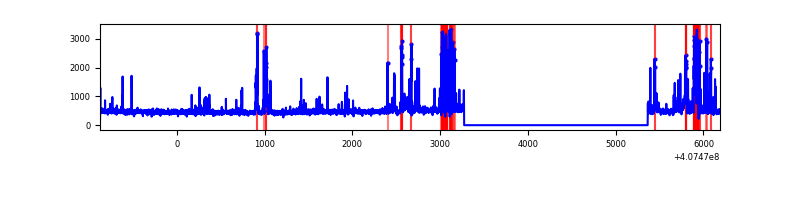 |
| C | 7063 | 4971 | 5 | 5 | 0.07% | 0.10% | 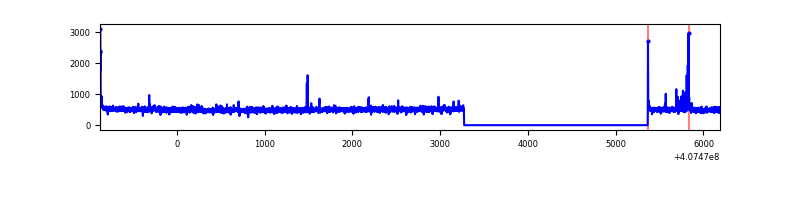 |
| D | 7063 | 4971 | 28 | 28 | 0.40% | 0.56% | 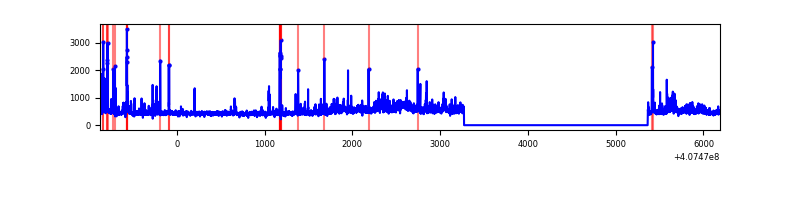 |
Top three noisy pixels from each quadrant. If the there are fewer than three noisy pixels in the level2.evt file, extra rows are filled as -1
| Pixel properties | Quadrant properties | ||||||
|---|---|---|---|---|---|---|---|
| Quadrant | DetID | PixID | Counts | Sigma | Mean | Median | Sigma |
| A | 10 | 83 | 374225 | 3252.68 | 569 | 559 | 114.9 |
| A | 7 | 3 | 246748 | 2143.02 | 569 | 559 | 114.9 |
| A | 15 | 223 | 32857 | 281.15 | 569 | 559 | 114.9 |
| B | 4 | 171 | 649383 | 5905.58 | 567 | 551 | 109.9 |
| B | 12 | 111 | 13613 | 118.89 | 567 | 551 | 109.9 |
| B | 11 | 111 | 12617 | 109.82 | 567 | 551 | 109.9 |
| C | 15 | 214 | 221898 | 1666.28 | 570 | 575 | 132.8 |
| C | 0 | 239 | 39722 | 294.73 | 570 | 575 | 132.8 |
| C | 0 | 10 | 25892 | 190.6 | 570 | 575 | 132.8 |
| D | 5 | 222 | 186427 | 1347.91 | 563 | 544 | 137.9 |
| D | 2 | 16 | 124062 | 895.67 | 563 | 544 | 137.9 |
| D | 10 | 118 | 89067 | 641.91 | 563 | 544 | 137.9 |
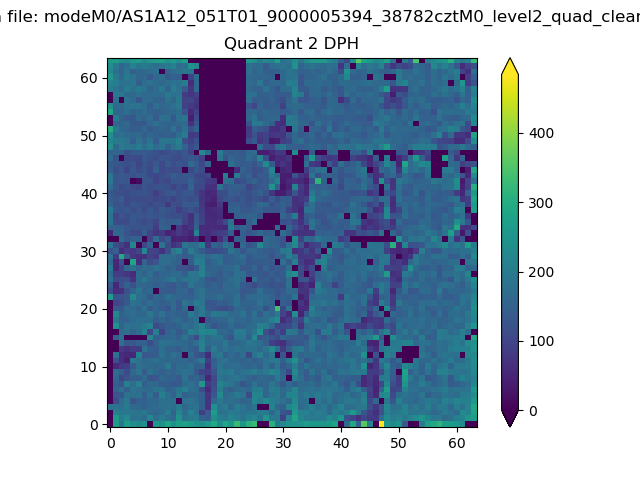
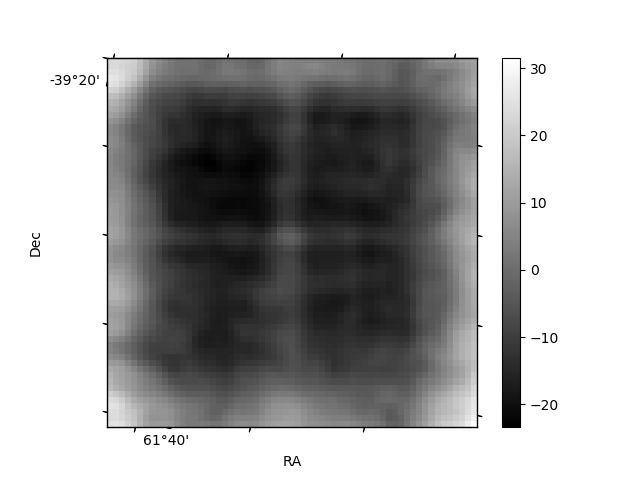
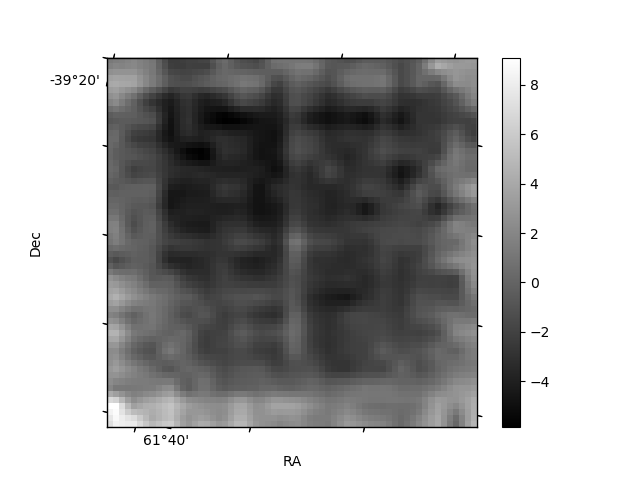
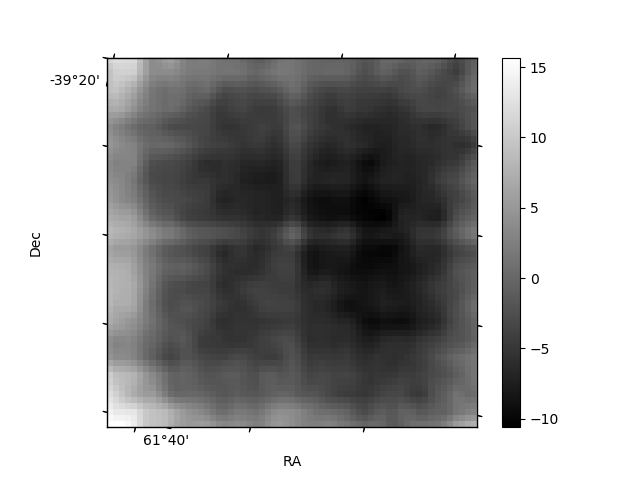
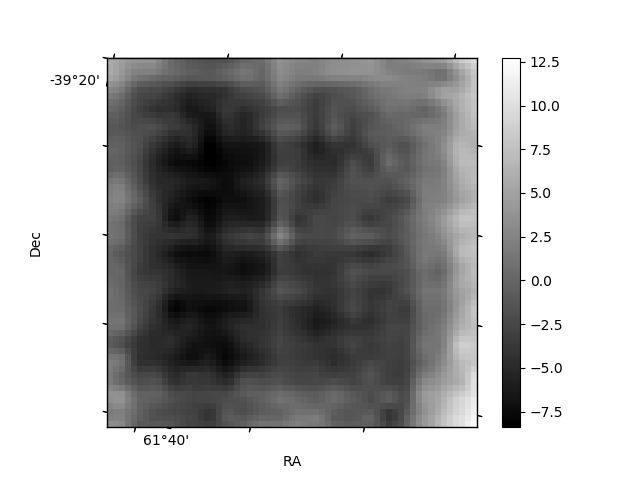
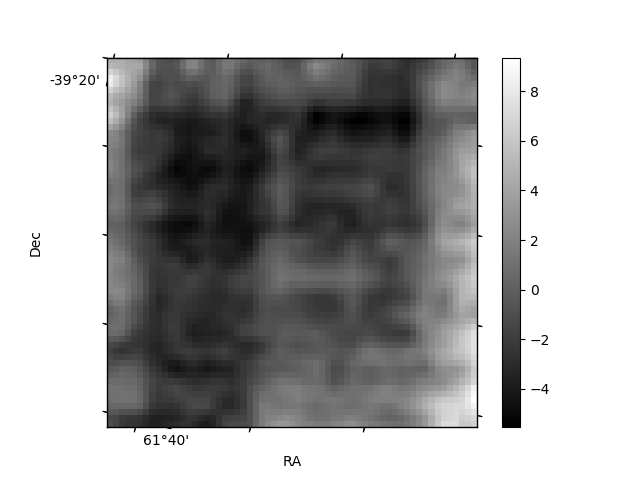
Histogram calculated using DETX and DETY for each event in the final _common_clean file
| Quadrant A | 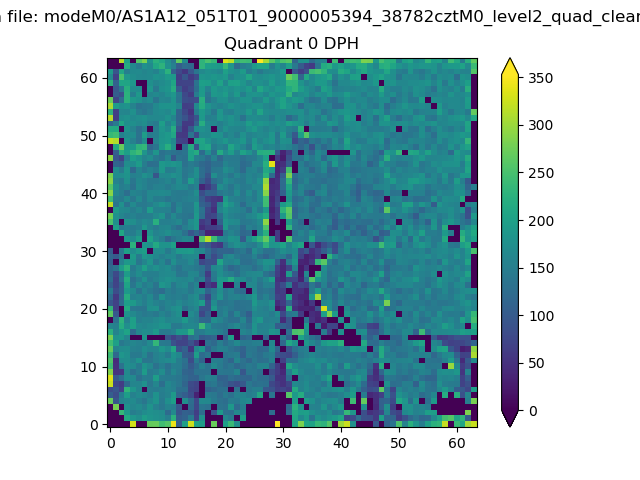 |
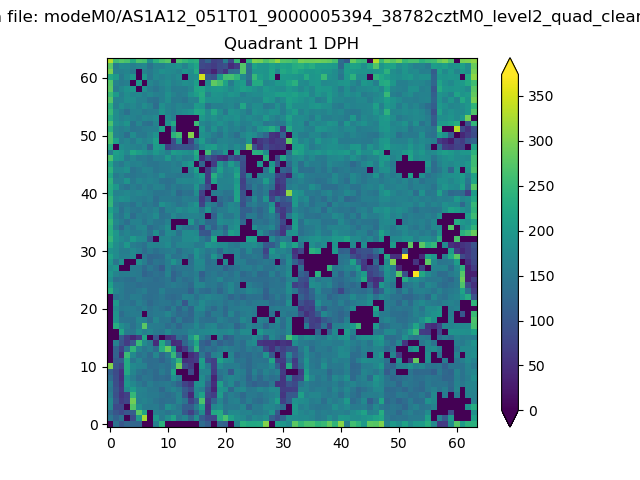 |
Quadrant B |
|---|---|---|---|
| Quadrant D | 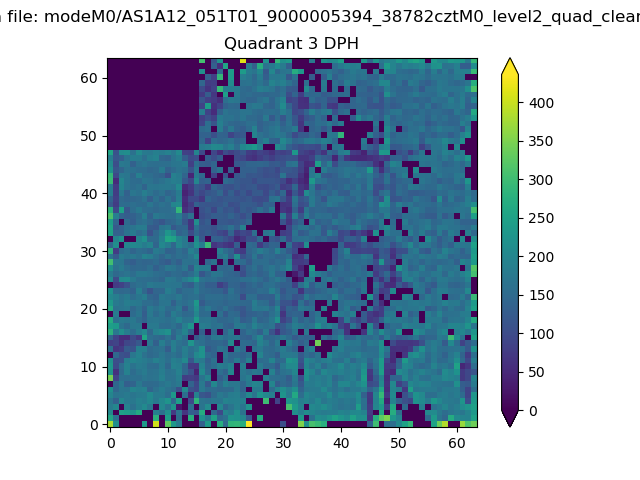 |
 |
Quadrant C |
| Plot type | Count rate plots | Images |
|---|---|---|
| Comparison with Poisson distribution Blue bars denote a histogram of data divided into 1 sec bins. Red curve is a Poisson curve with rate = median count rate of data. |
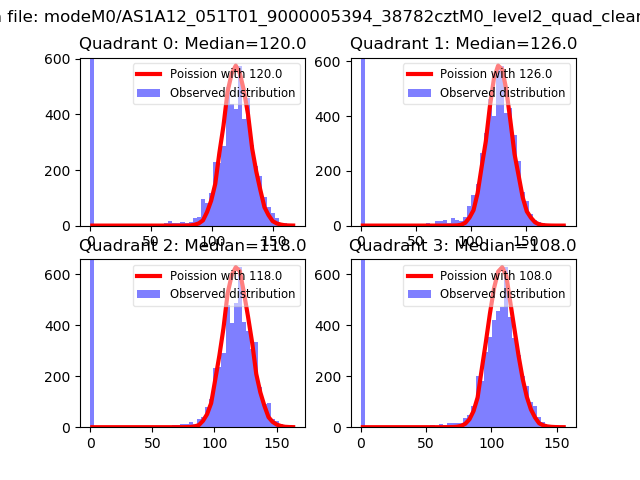 |
 |
| Quadrant-wise count rates Data is divided into 100 sec bins |
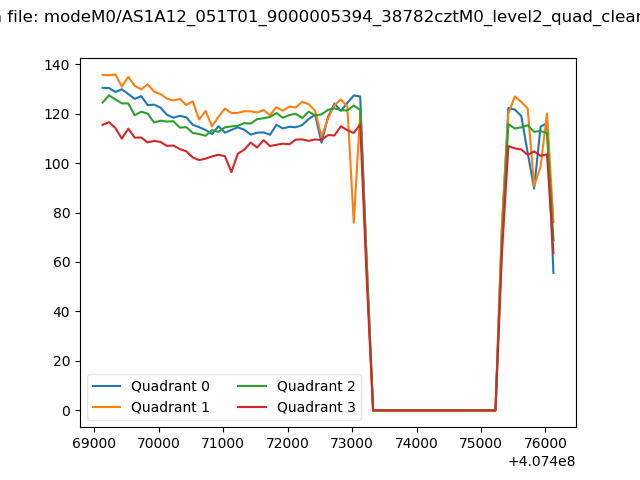 |
|
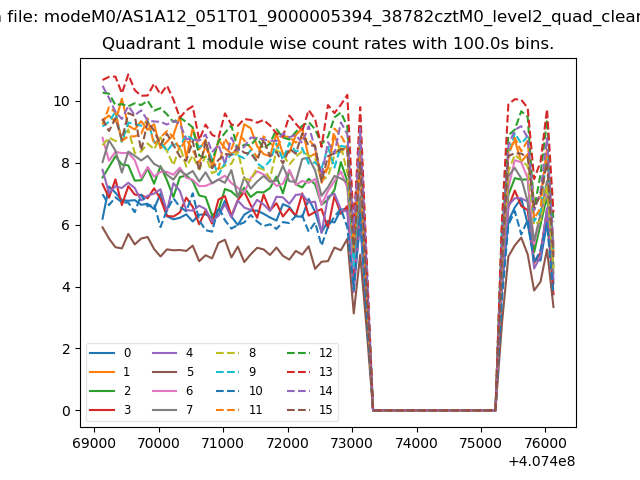
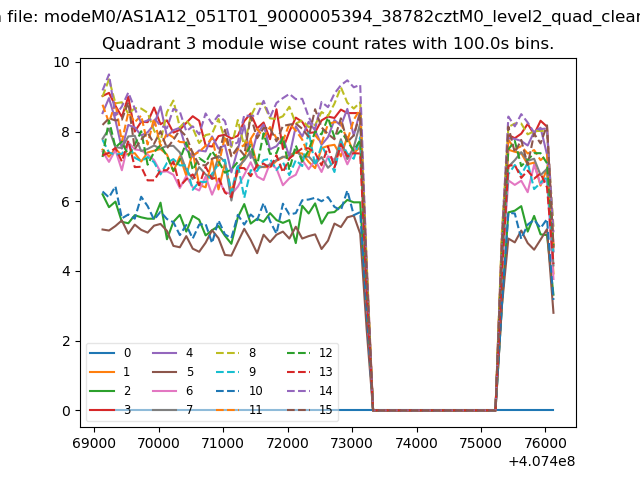
| Module-wise count rates for Quadrant A Data is divided into 100 sec bins |
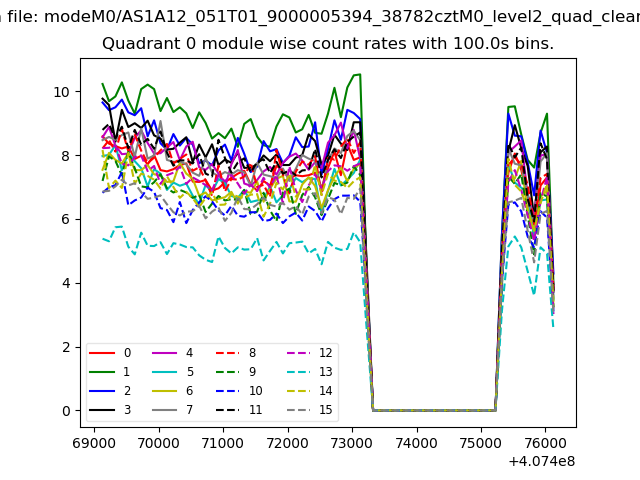 |
 |
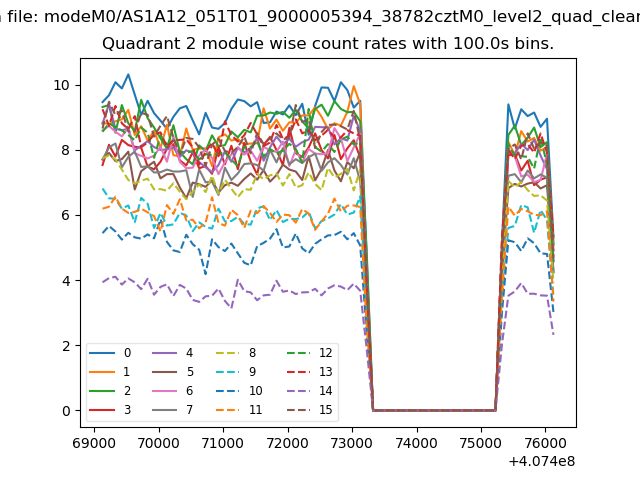
| Module-wise count rates for Quadrant B Data is divided into 100 sec bins |
 |
 |
| Module-wise count rates for Quadrant C Data is divided into 100 sec bins |
 |
 |
| Module-wise count rates for Quadrant D Data is divided into 100 sec bins |
 |
 |
| Parameter | Plot |
|---|---|
| CZT HV Monitor | 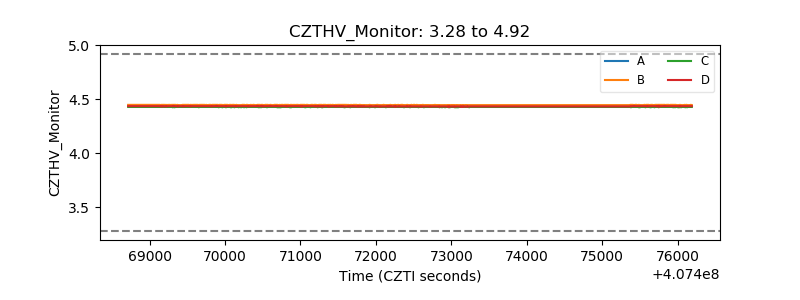 |
| D_VDD | 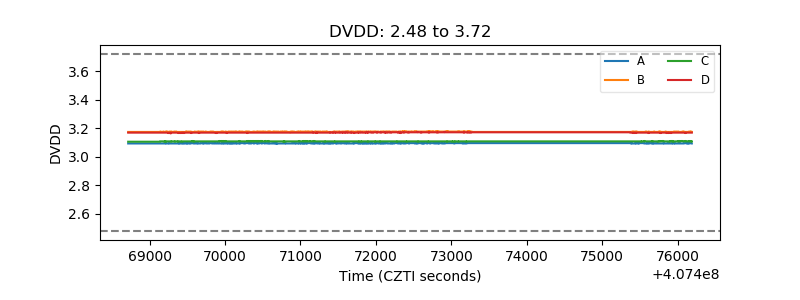 |
| Temperature 1 | 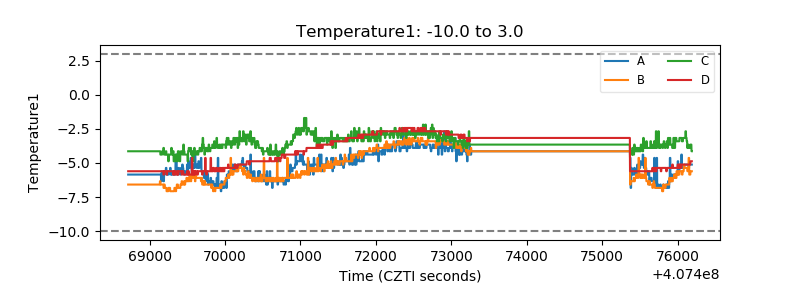 |
| Veto HV Monitor | 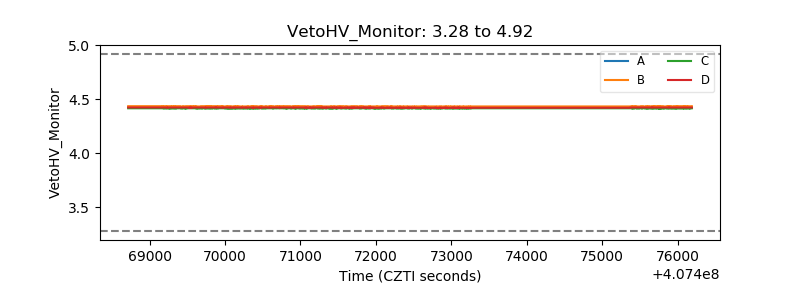 |
| Veto LLD | 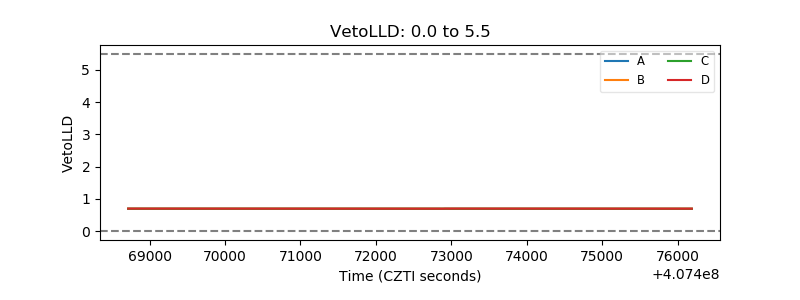 |
| Alpha Counter | 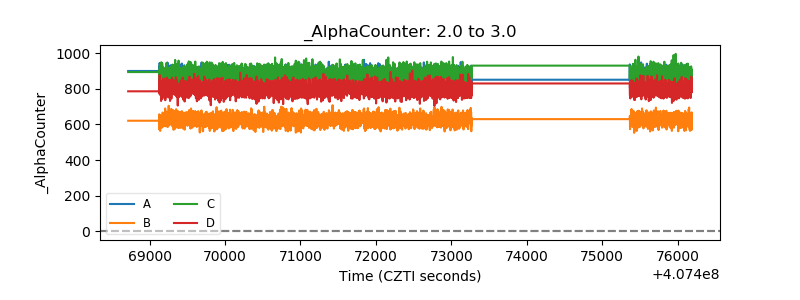 |
| _CPM_Rate | 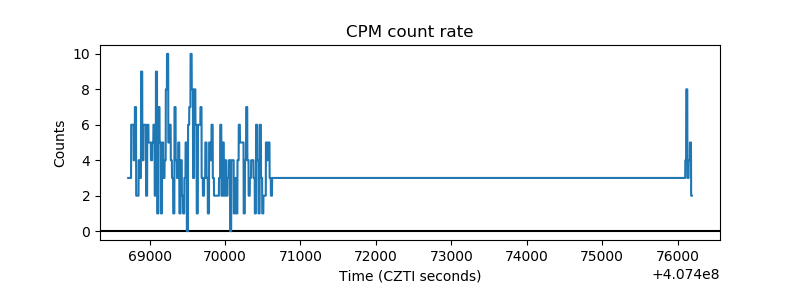 |
| CZT Counter | 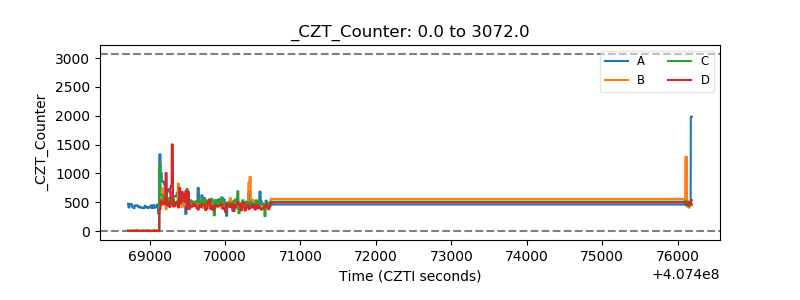 |
| +2.5 Volts monitor | 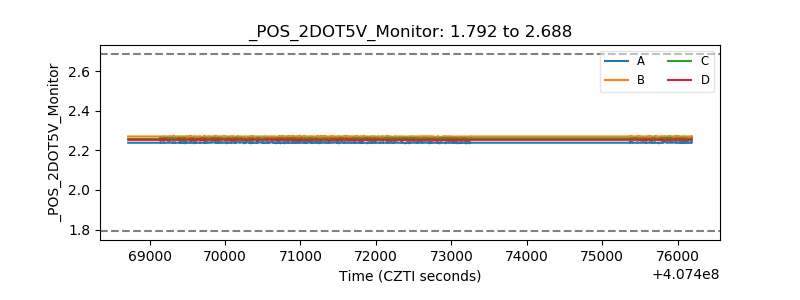 |
| +5 Volts monitor | 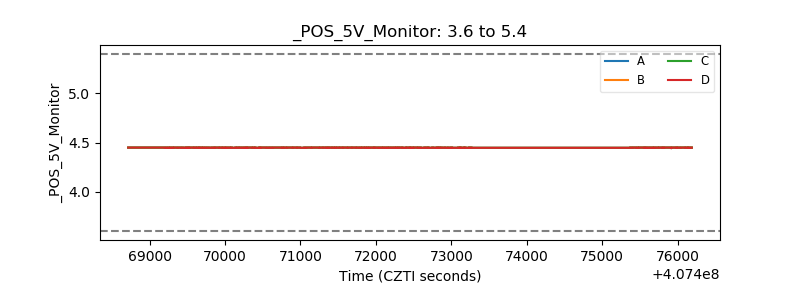 |
| _ROLL_ROT | 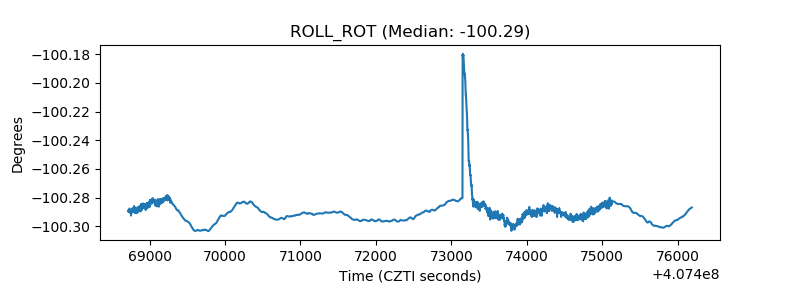 |
| _Roll_DEC | 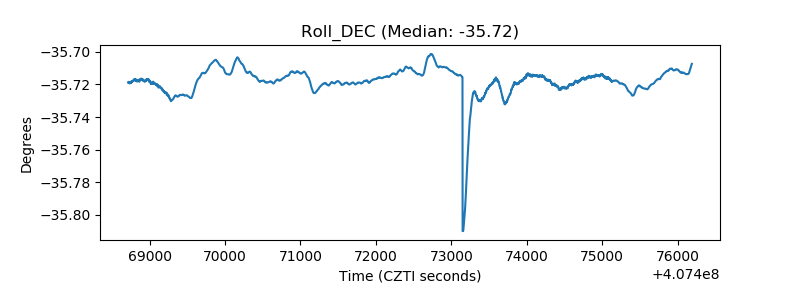 |
| _Roll_RA | 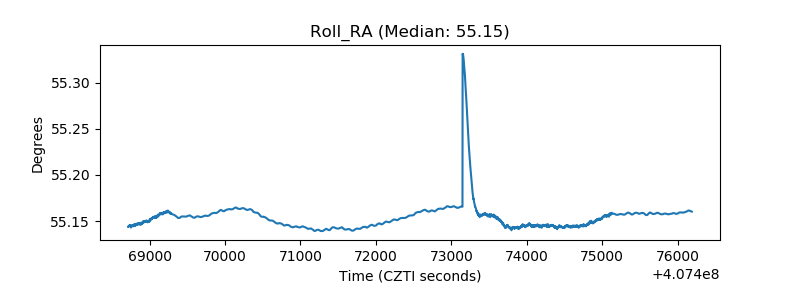 |
| Veto Counter | 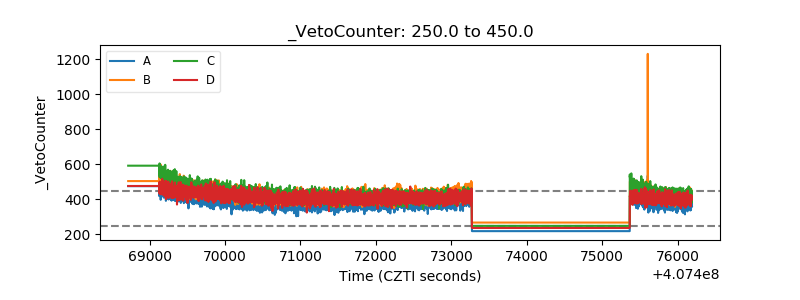 |