| Param | Original file | Final file |
|---|---|---|
| Filename | modeM0/AS1A12_051T01_9000005394_38783cztM0_level2.fits | modeM0/AS1A12_051T01_9000005394_38783cztM0_level2_quad_clean.evt |
| Size (bytes) | 307,664,640 | 84,003,840 |
| Size | 293.4 MB | 80.1 MB |
| Events in quadrant A | 2,879,541 | 557,239 |
| Events in quadrant B | 2,908,619 | 574,525 |
| Events in quadrant C | 2,460,267 | 557,956 |
| Events in quadrant D | 2,753,615 | 506,462 |
| Mode SS | |||
|---|---|---|---|
| Quadrant | BADHDUFLAG | Total packets | Discarded packets |
| A | 0 | 100 | 0 |
| B | 0 | 100 | 0 |
| C | 0 | 100 | 0 |
| D | 0 | 100 | 0 |
| Mode M0 | |||
|---|---|---|---|
| Quadrant | BADHDUFLAG | Total packets | Discarded packets |
| A | 0 | 11492 | 3 |
| B | 0 | 11940 | 2 |
| C | 0 | 10208 | 2 |
| D | 0 | 11318 | 2 |
| Mode M9 | |||
|---|---|---|---|
| Quadrant | BADHDUFLAG | Total packets | Discarded packets |
| A | 0 | 28 | 0 |
| B | 0 | 28 | 0 |
| C | 0 | 28 | 0 |
| D | 0 | 29 | 0 |
| Quadrant | Total seconds | Saturated seconds | Saturation percentage |
|---|---|---|---|
| A | 4957 | 107 | 2.158564% |
| B | 4957 | 179 | 3.611055% |
| C | 4957 | 11 | 0.221908% |
| D | 4957 | 87 | 1.755094% |
Noise dominated data is calculated using 1-second bins in cleaned event files. If a bin has >2000 counts, and if more than 50% of those come from <1% of pixels, then it is considered to be noise-dominated and hence unusable.
| Quadrant | # 1 sec bins | Bins with >0 counts | Bins with >2000 counts | High rate bins dominated by noise | Noise dominated (total time) | Noise dominated (detector-on time) | Marked lightcurve |
|---|---|---|---|---|---|---|---|
| A | 6930 | 4958 | 92 | 92 | 1.33% | 1.86% | 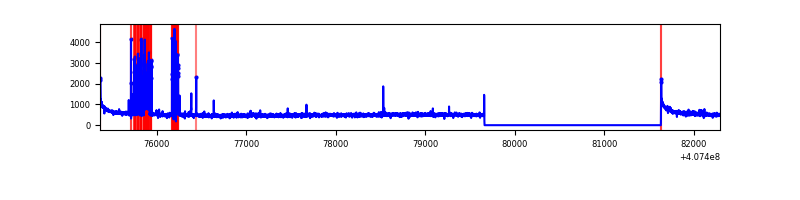 |
| B | 6930 | 4958 | 128 | 128 | 1.85% | 2.58% | 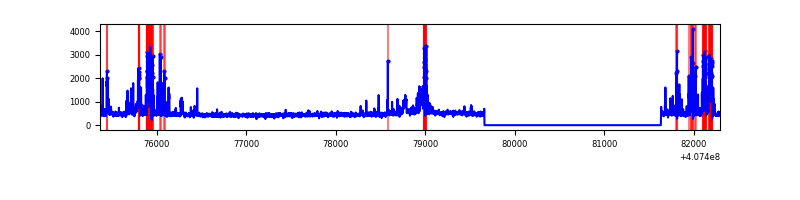 |
| C | 6930 | 4958 | 5 | 5 | 0.07% | 0.10% | 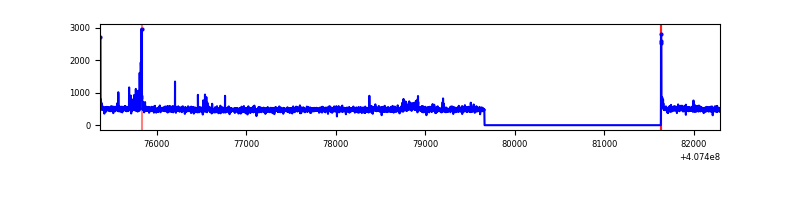 |
| D | 6930 | 4958 | 74 | 74 | 1.07% | 1.49% | 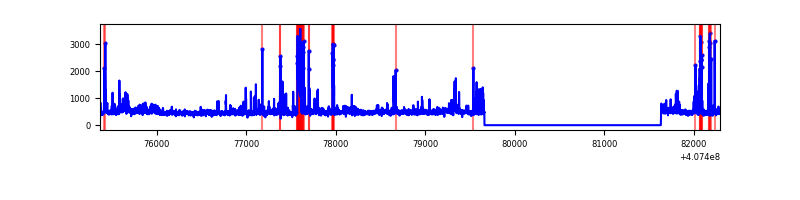 |
Top three noisy pixels from each quadrant. If the there are fewer than three noisy pixels in the level2.evt file, extra rows are filled as -1
| Pixel properties | Quadrant properties | ||||||
|---|---|---|---|---|---|---|---|
| Quadrant | DetID | PixID | Counts | Sigma | Mean | Median | Sigma |
| A | 10 | 83 | 377847 | 3366.35 | 553 | 543 | 112.1 |
| A | 7 | 3 | 332691 | 2963.46 | 553 | 543 | 112.1 |
| A | 15 | 223 | 16677 | 143.95 | 553 | 543 | 112.1 |
| B | 4 | 171 | 632965 | 5920.07 | 551 | 536 | 106.8 |
| B | 5 | 200 | 82020 | 762.76 | 551 | 536 | 106.8 |
| B | 12 | 111 | 13473 | 121.1 | 551 | 536 | 106.8 |
| C | 15 | 214 | 222811 | 1713.34 | 551 | 555 | 129.7 |
| C | 0 | 239 | 45104 | 343.42 | 551 | 555 | 129.7 |
| C | 0 | 10 | 21577 | 162.06 | 551 | 555 | 129.7 |
| D | 2 | 16 | 173729 | 1311.83 | 543 | 529 | 132.0 |
| D | 10 | 118 | 168690 | 1273.66 | 543 | 529 | 132.0 |
| D | 2 | 249 | 163237 | 1232.36 | 543 | 529 | 132.0 |
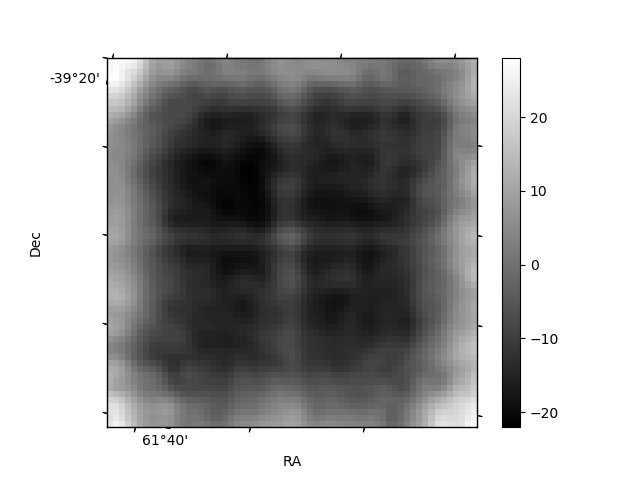
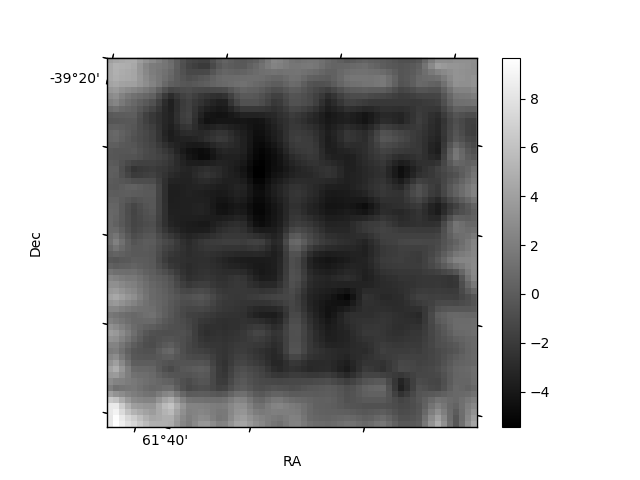
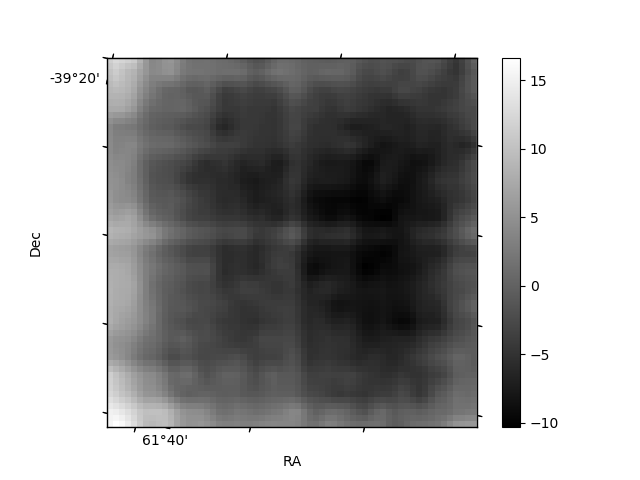
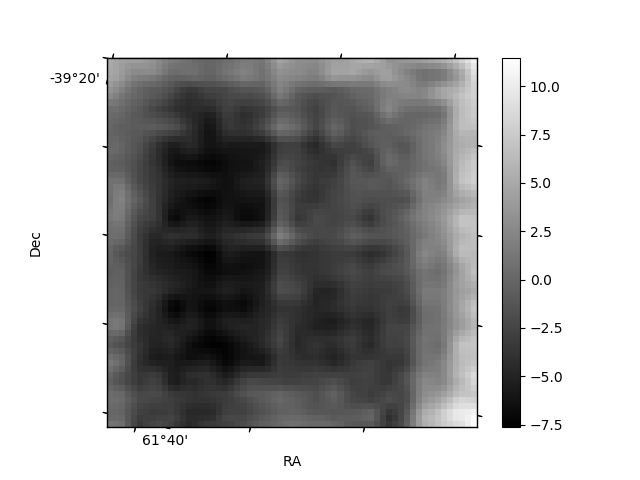
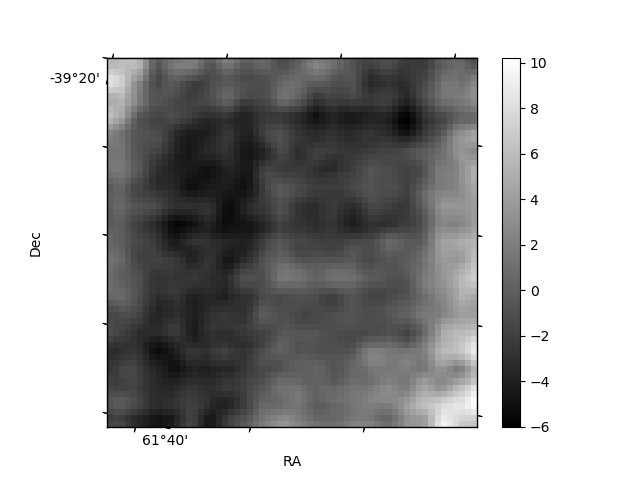
Histogram calculated using DETX and DETY for each event in the final _common_clean file
| Quadrant A | 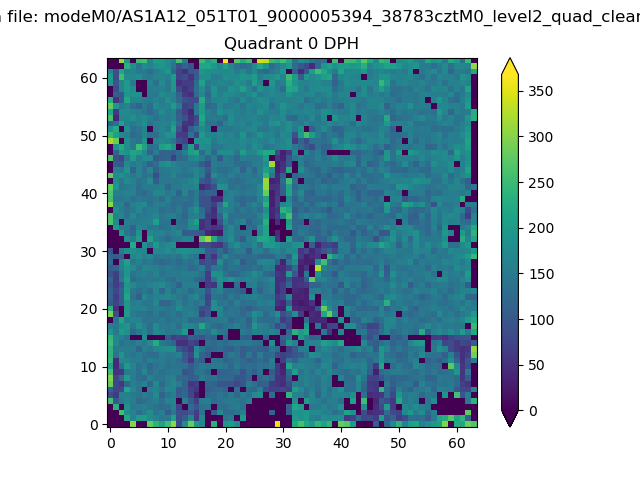 |
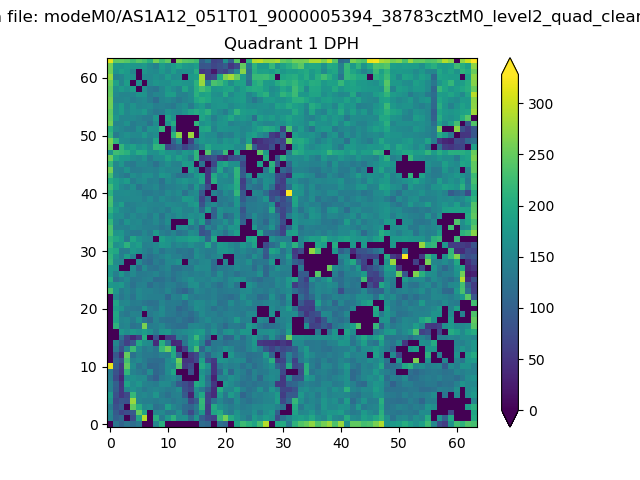 |
Quadrant B |
|---|---|---|---|
| Quadrant D | 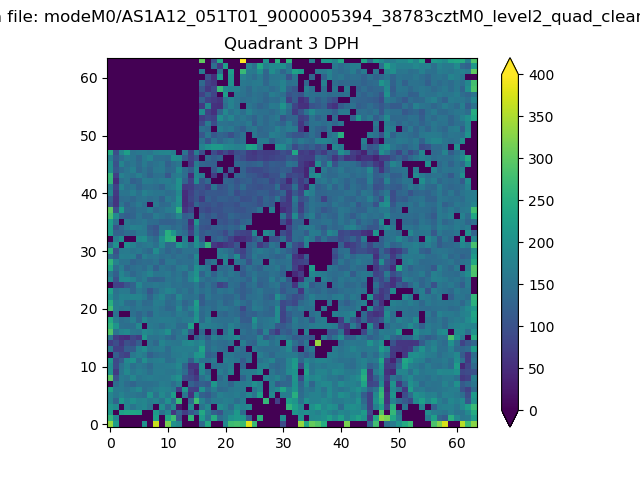 |
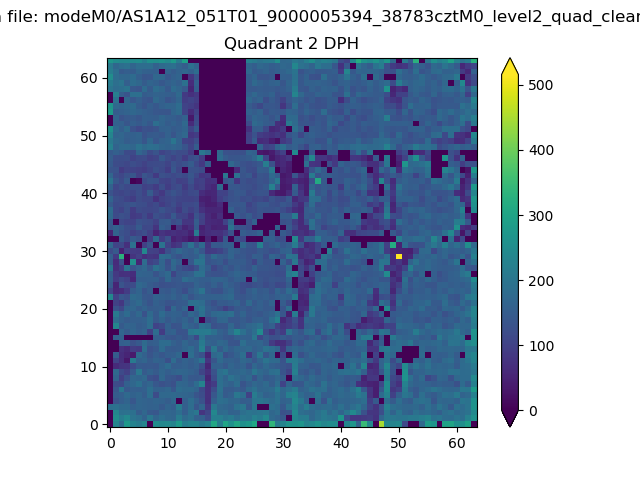 |
Quadrant C |
| Plot type | Count rate plots | Images |
|---|---|---|
| Comparison with Poisson distribution Blue bars denote a histogram of data divided into 1 sec bins. Red curve is a Poisson curve with rate = median count rate of data. |
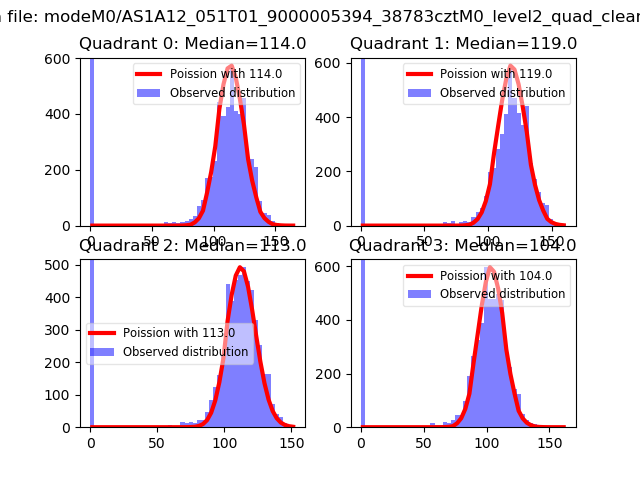 |
 |
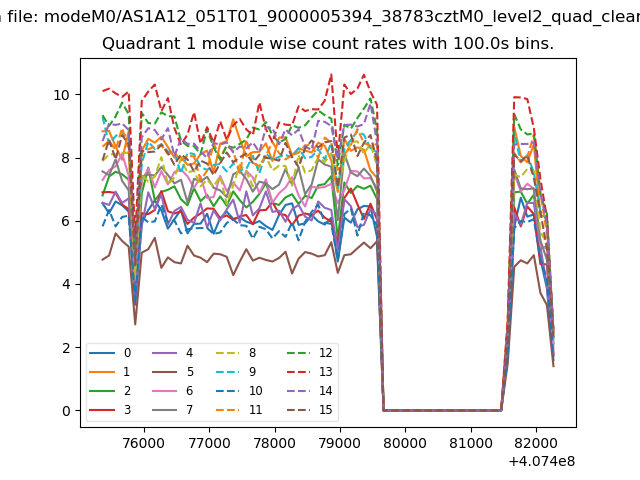
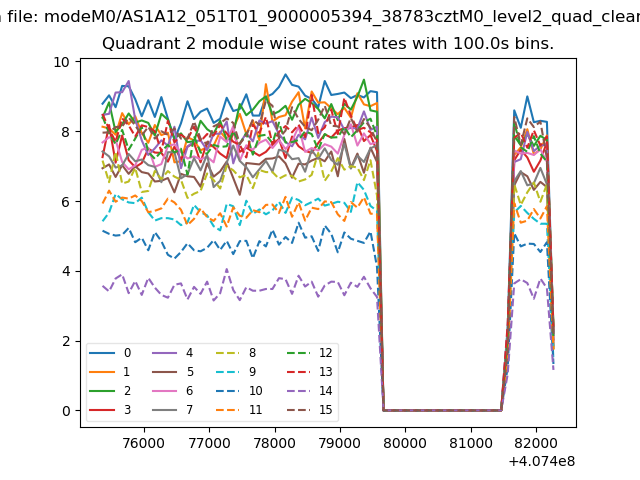
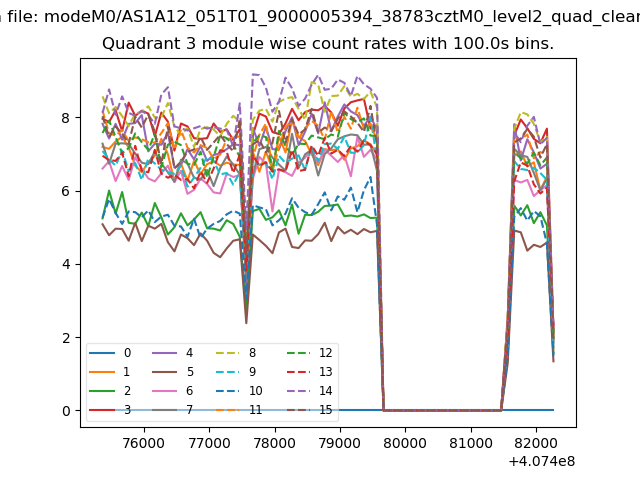
| Quadrant-wise count rates Data is divided into 100 sec bins |
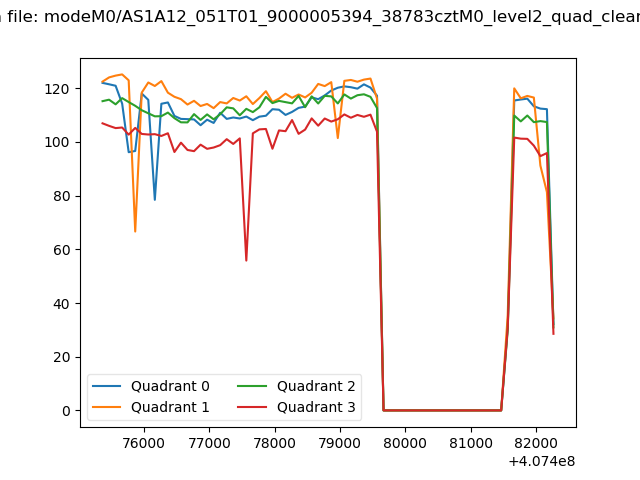 |
|
| Module-wise count rates for Quadrant A Data is divided into 100 sec bins |
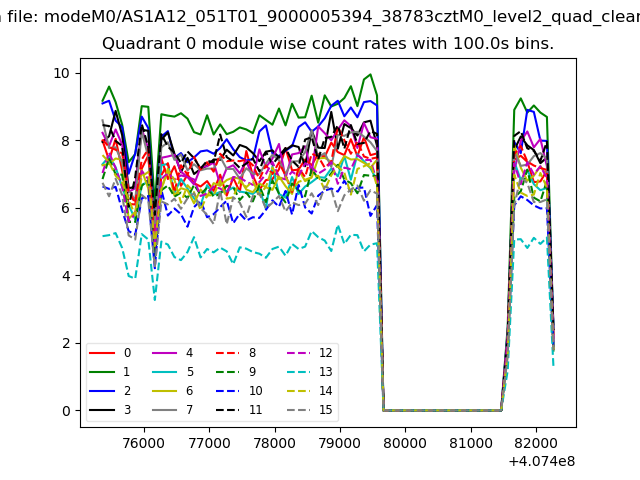 |
 |
| Module-wise count rates for Quadrant B Data is divided into 100 sec bins |
 |
 |
| Module-wise count rates for Quadrant C Data is divided into 100 sec bins |
 |
 |
| Module-wise count rates for Quadrant D Data is divided into 100 sec bins |
 |
 |
| Parameter | Plot |
|---|---|
| CZT HV Monitor | 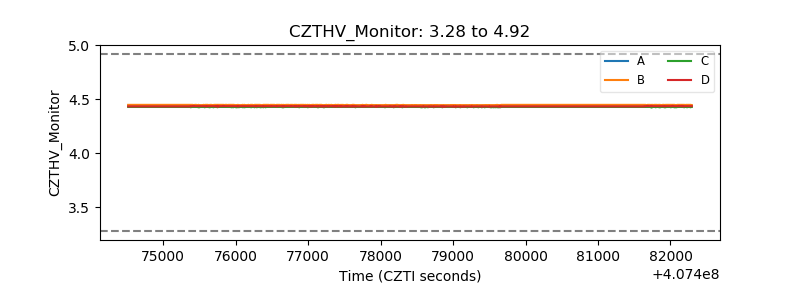 |
| D_VDD | 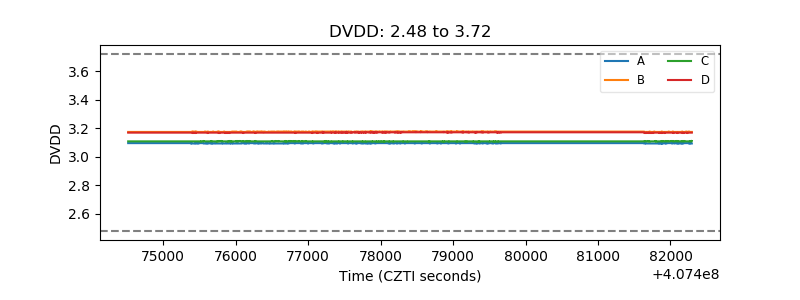 |
| Temperature 1 | 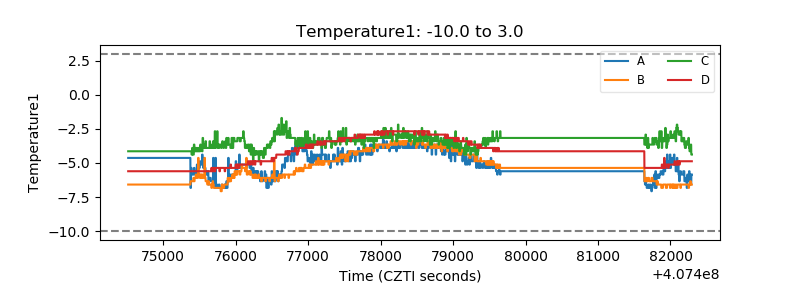 |
| Veto HV Monitor | 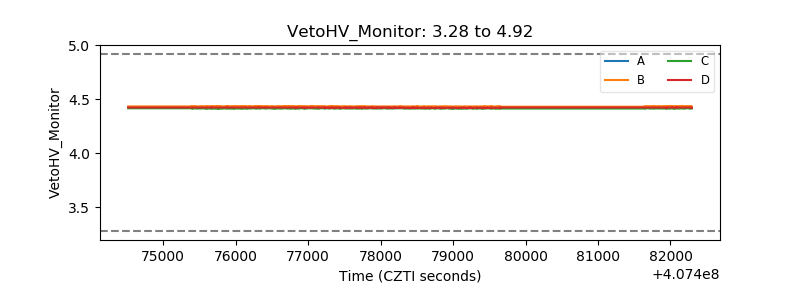 |
| Veto LLD | 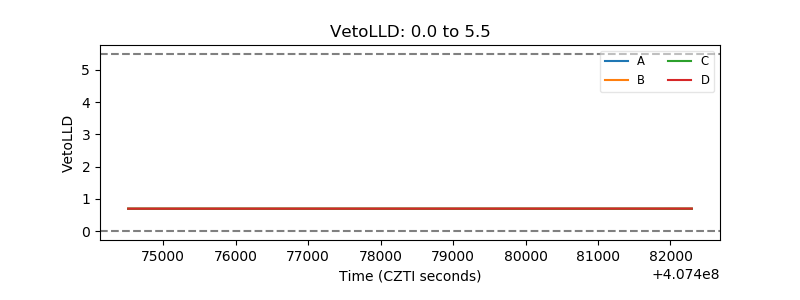 |
| Alpha Counter | 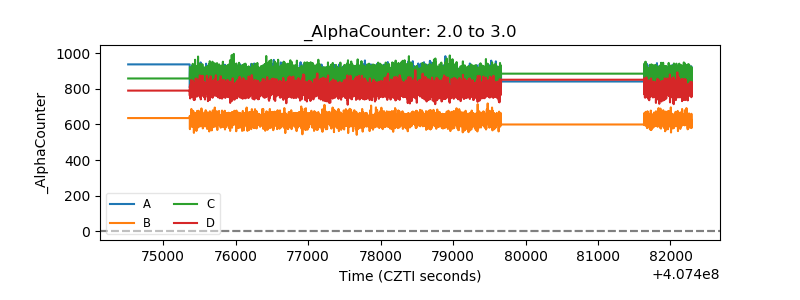 |
| _CPM_Rate | 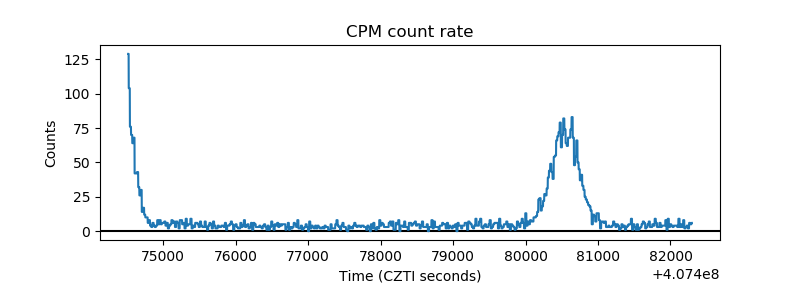 |
| CZT Counter | 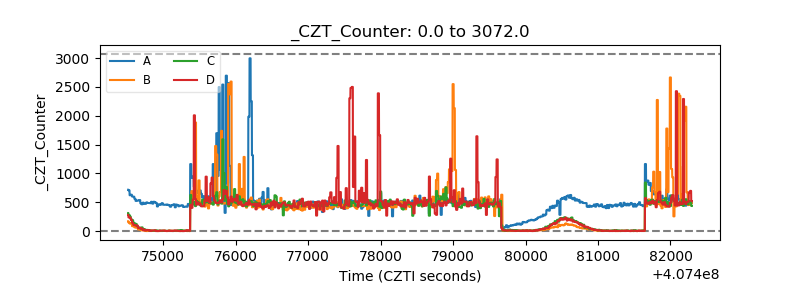 |
| +2.5 Volts monitor | 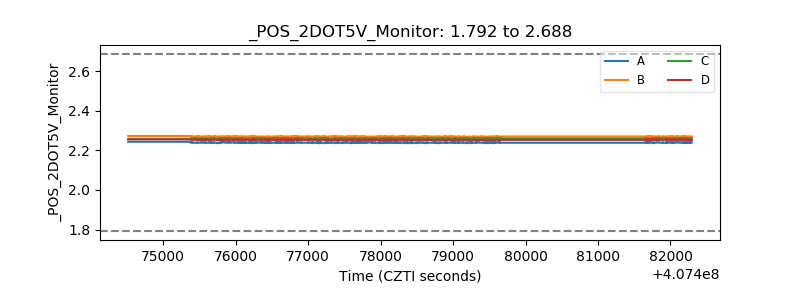 |
| +5 Volts monitor |  |
| _ROLL_ROT | 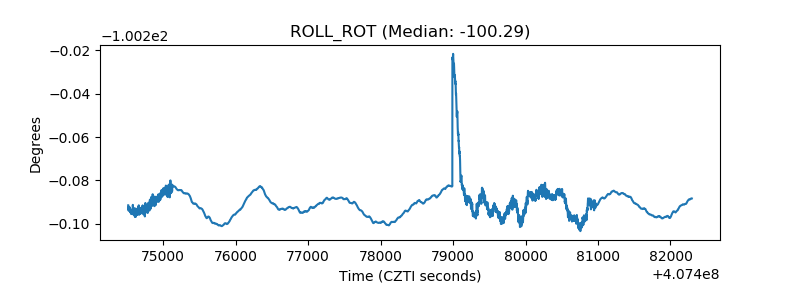 |
| _Roll_DEC | 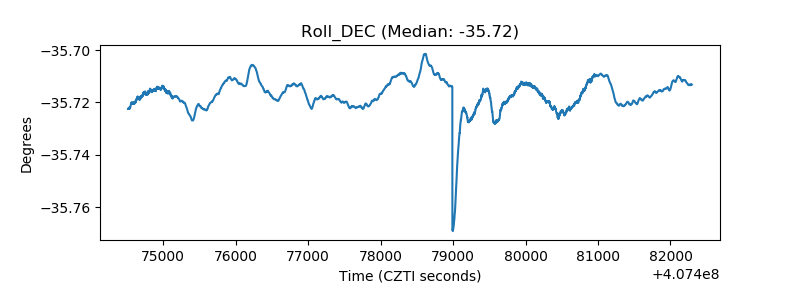 |
| _Roll_RA | 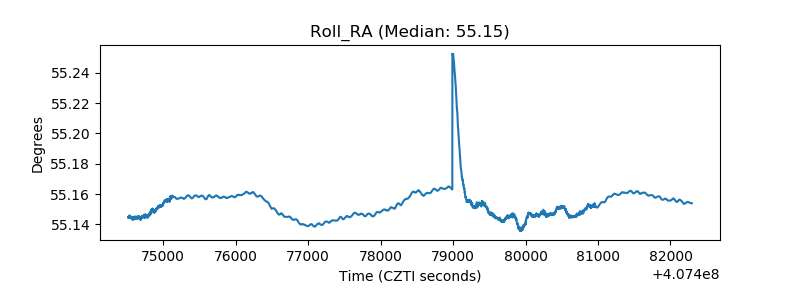 |
| Veto Counter | 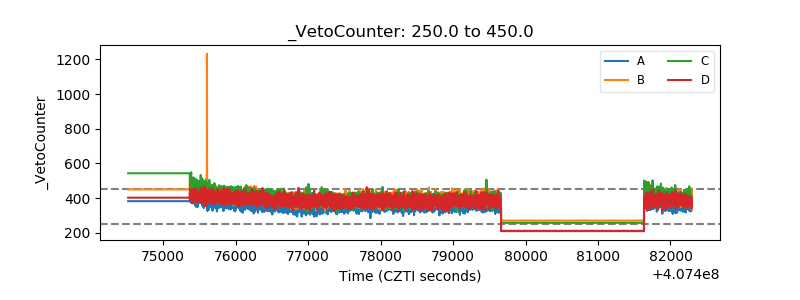 |