| Param | Original file | Final file |
|---|---|---|
| Filename | modeM0/AS1A12_051T01_9000005394_38785cztM0_level2.fits | modeM0/AS1A12_051T01_9000005394_38785cztM0_level2_quad_clean.evt |
| Size (bytes) | 443,638,080 | 99,639,360 |
| Size | 423.1 MB | 95.0 MB |
| Events in quadrant A | 3,168,998 | 687,589 |
| Events in quadrant B | 5,462,480 | 617,811 |
| Events in quadrant C | 2,912,450 | 678,192 |
| Events in quadrant D | 4,397,316 | 601,773 |
| Mode SS | |||
|---|---|---|---|
| Quadrant | BADHDUFLAG | Total packets | Discarded packets |
| A | 0 | 128 | 0 |
| B | 0 | 128 | 0 |
| C | 0 | 128 | 0 |
| D | 0 | 128 | 0 |
| Mode M0 | |||
|---|---|---|---|
| Quadrant | BADHDUFLAG | Total packets | Discarded packets |
| A | 0 | 13189 | 3 |
| B | 0 | 20334 | 2 |
| C | 0 | 12496 | 2 |
| D | 0 | 17178 | 2 |
| Mode M9 | |||
|---|---|---|---|
| Quadrant | BADHDUFLAG | Total packets | Discarded packets |
| A | 0 | 30 | 0 |
| B | 0 | 30 | 0 |
| C | 0 | 30 | 0 |
| D | 0 | 30 | 0 |
| Quadrant | Total seconds | Saturated seconds | Saturation percentage |
|---|---|---|---|
| A | 6182 | 11 | 0.177936% |
| B | 6182 | 939 | 15.189259% |
| C | 6182 | 6 | 0.097056% |
| D | 6182 | 265 | 4.286639% |
Noise dominated data is calculated using 1-second bins in cleaned event files. If a bin has >2000 counts, and if more than 50% of those come from <1% of pixels, then it is considered to be noise-dominated and hence unusable.
| Quadrant | # 1 sec bins | Bins with >0 counts | Bins with >2000 counts | High rate bins dominated by noise | Noise dominated (total time) | Noise dominated (detector-on time) | Marked lightcurve |
|---|---|---|---|---|---|---|---|
| A | 9198 | 6184 | 7 | 7 | 0.08% | 0.11% | 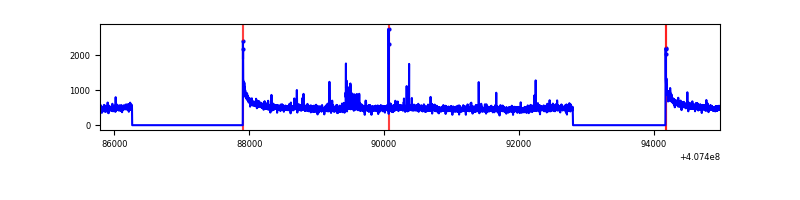 |
| B | 9198 | 6184 | 717 | 717 | 7.80% | 11.59% | 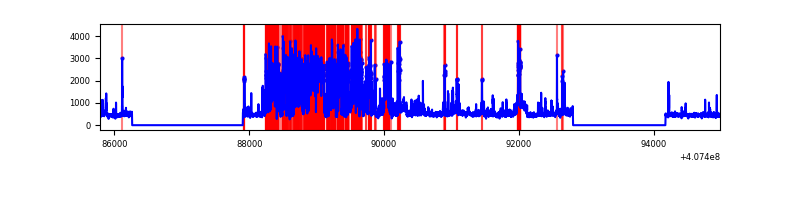 |
| C | 9198 | 6184 | 3 | 3 | 0.03% | 0.05% | 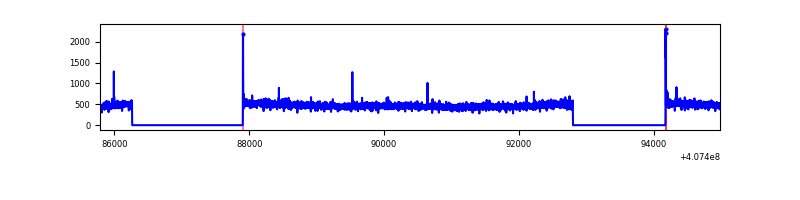 |
| D | 9198 | 6184 | 228 | 228 | 2.48% | 3.69% | 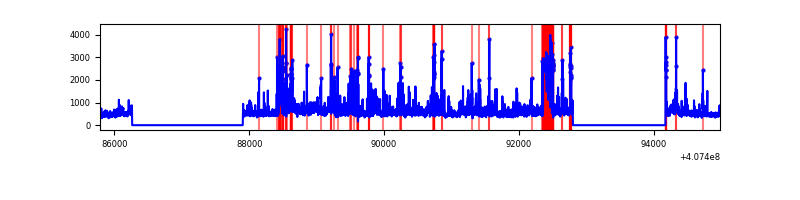 |
Top three noisy pixels from each quadrant. If the there are fewer than three noisy pixels in the level2.evt file, extra rows are filled as -1
| Pixel properties | Quadrant properties | ||||||
|---|---|---|---|---|---|---|---|
| Quadrant | DetID | PixID | Counts | Sigma | Mean | Median | Sigma |
| A | 10 | 83 | 431193 | 3110.99 | 681 | 669 | 138.4 |
| A | 12 | 16 | 60194 | 430.13 | 681 | 669 | 138.4 |
| A | 9 | 143 | 15592 | 107.83 | 681 | 669 | 138.4 |
| B | 4 | 171 | 2639499 | 21329.64 | 637 | 619 | 123.7 |
| B | 5 | 200 | 270084 | 2178.04 | 637 | 619 | 123.7 |
| B | 0 | 230 | 21011 | 164.82 | 637 | 619 | 123.7 |
| C | 15 | 214 | 273658 | 1740.19 | 667 | 670 | 156.9 |
| C | 0 | 10 | 16082 | 98.25 | 667 | 670 | 156.9 |
| C | 0 | 239 | 7323 | 42.41 | 667 | 670 | 156.9 |
| D | 13 | 249 | 333670 | 2107.66 | 652 | 635 | 158.0 |
| D | 2 | 16 | 326988 | 2065.37 | 652 | 635 | 158.0 |
| D | 5 | 222 | 302709 | 1911.72 | 652 | 635 | 158.0 |
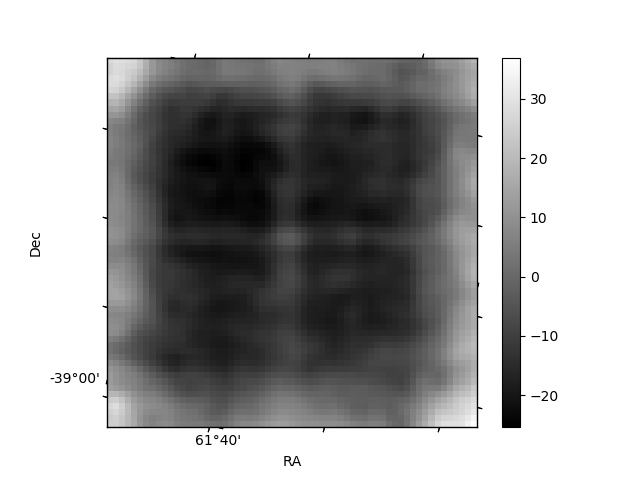
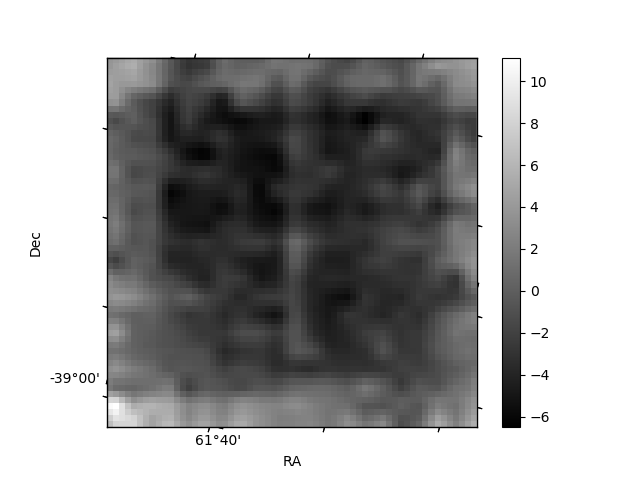
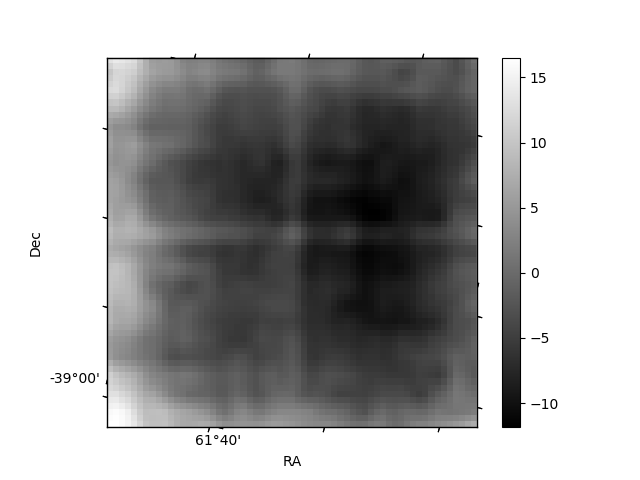
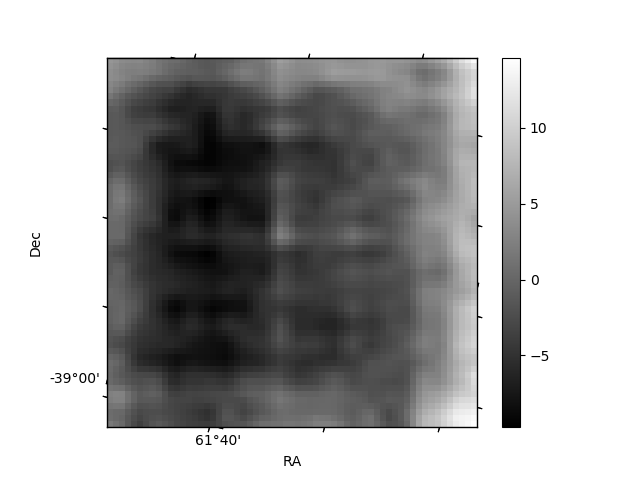
Histogram calculated using DETX and DETY for each event in the final _common_clean file
| Quadrant A | 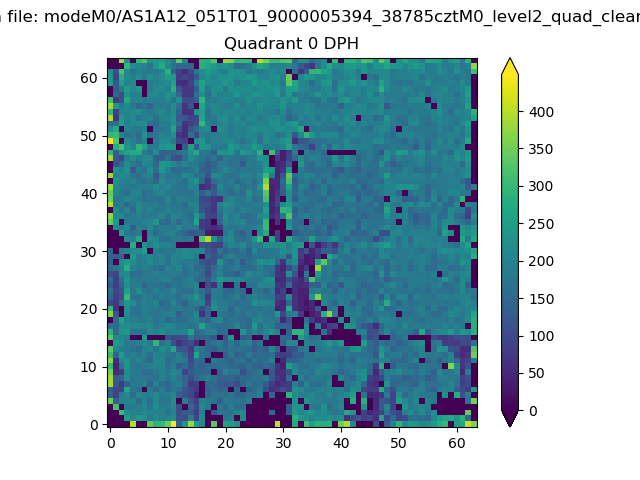 |
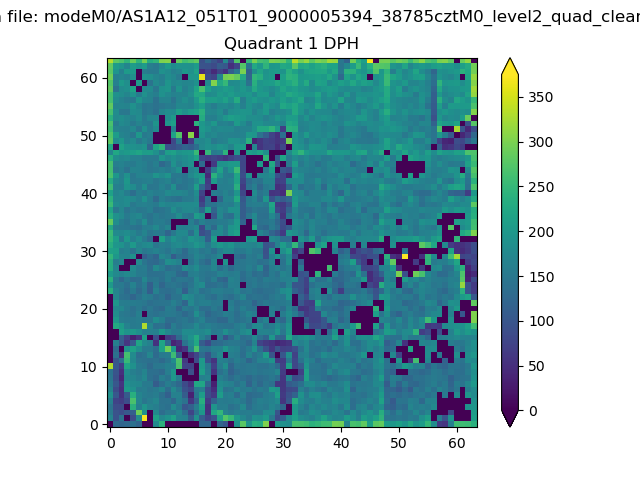 |
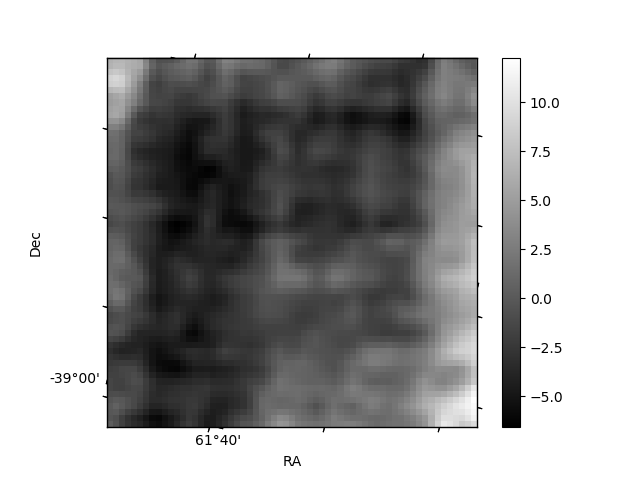
Quadrant B |
|---|---|---|---|
| Quadrant D | 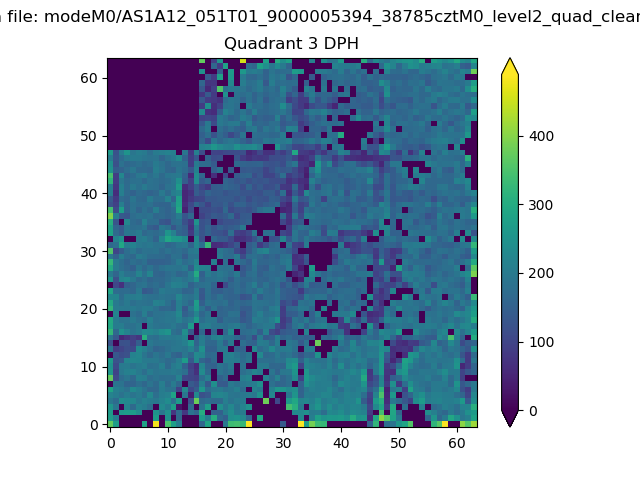 |
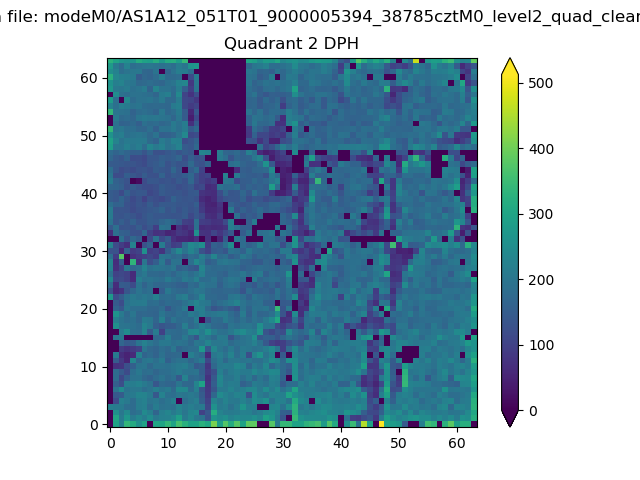 |
Quadrant C |
| Plot type | Count rate plots | Images |
|---|---|---|
| Comparison with Poisson distribution Blue bars denote a histogram of data divided into 1 sec bins. Red curve is a Poisson curve with rate = median count rate of data. |
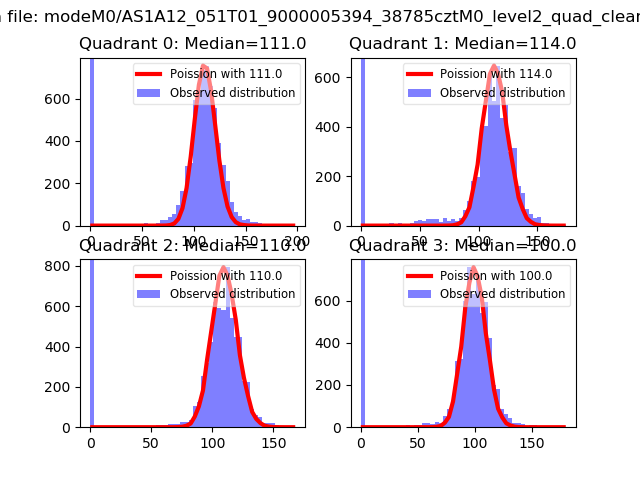 |
 |
| Quadrant-wise count rates Data is divided into 100 sec bins |
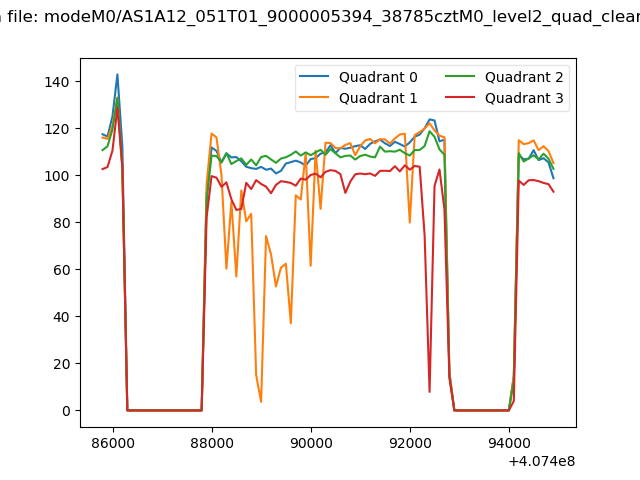 |
|
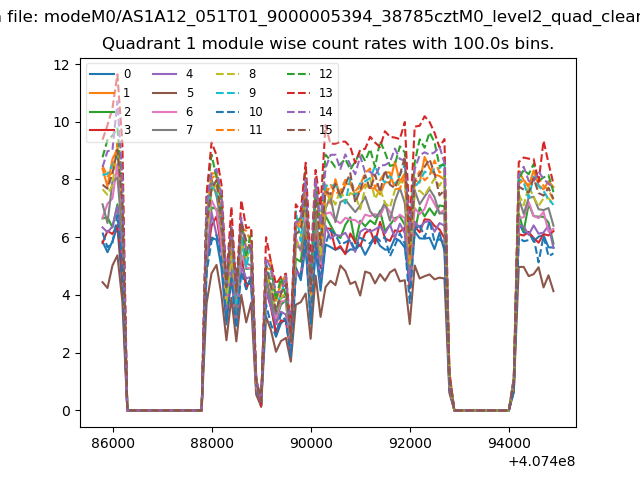
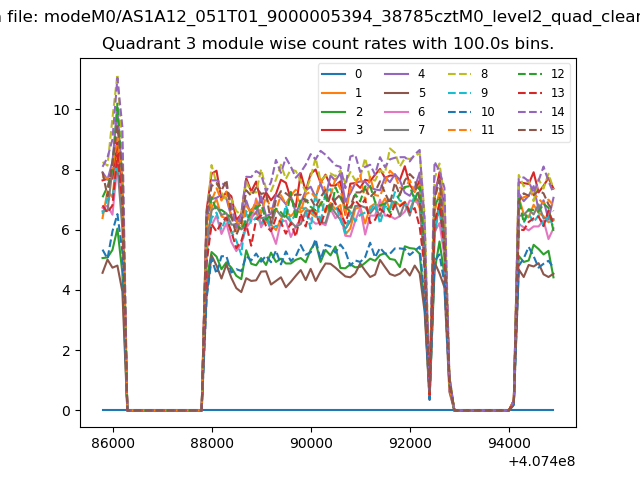
| Module-wise count rates for Quadrant A Data is divided into 100 sec bins |
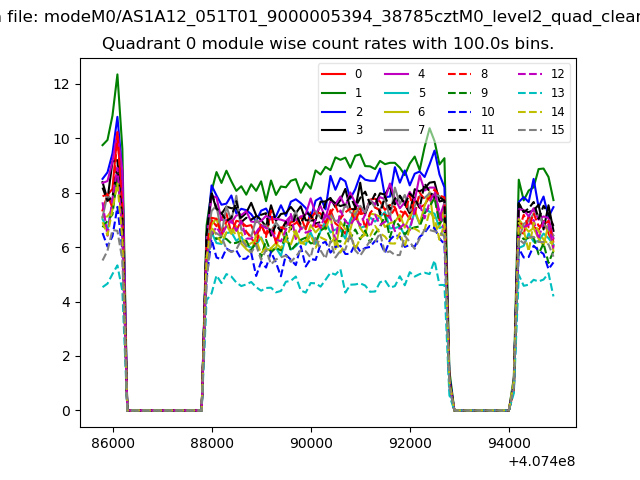 |
 |
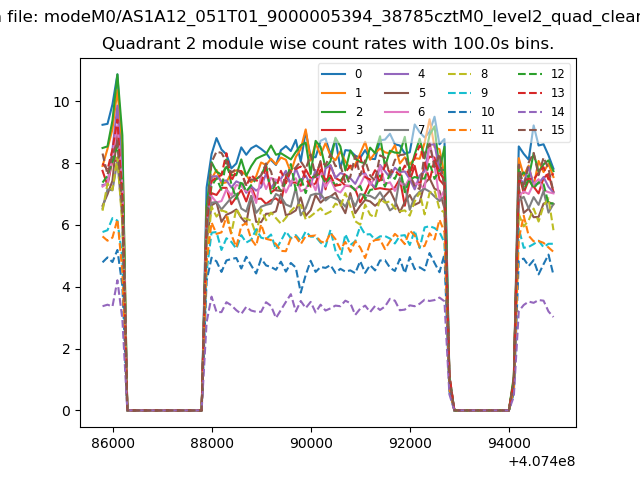
| Module-wise count rates for Quadrant B Data is divided into 100 sec bins |
 |
 |
| Module-wise count rates for Quadrant C Data is divided into 100 sec bins |
 |
 |
| Module-wise count rates for Quadrant D Data is divided into 100 sec bins |
 |
 |
| Parameter | Plot |
|---|---|
| CZT HV Monitor | 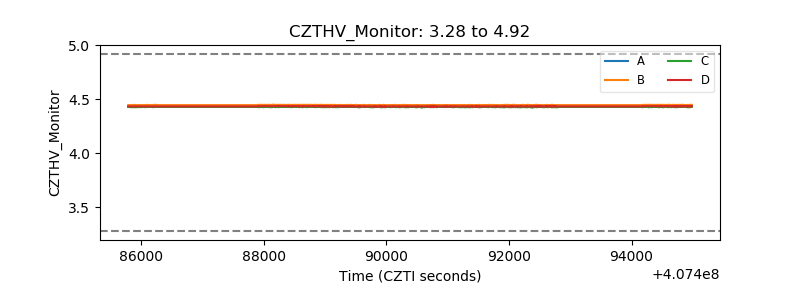 |
| D_VDD | 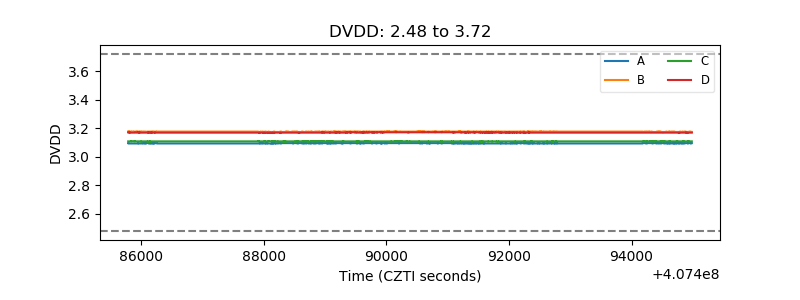 |
| Temperature 1 | 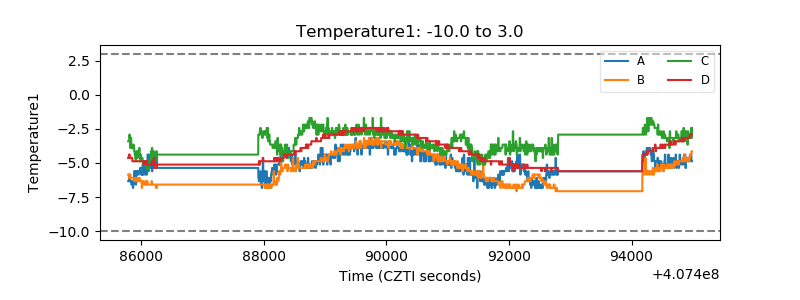 |
| Veto HV Monitor | 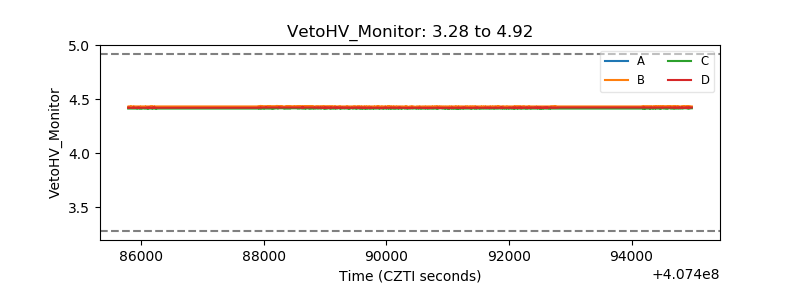 |
| Veto LLD | 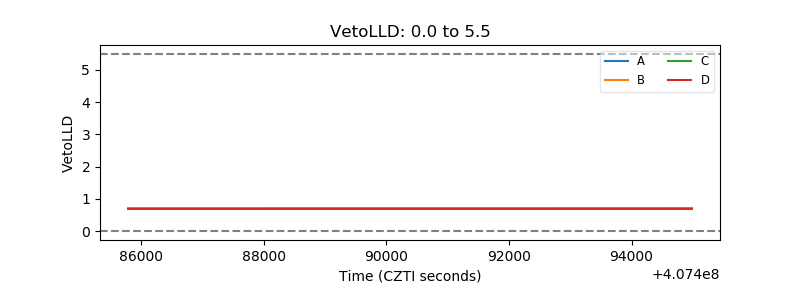 |
| Alpha Counter | 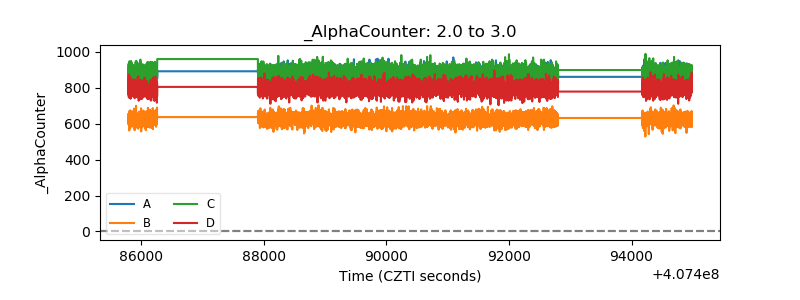 |
| _CPM_Rate | 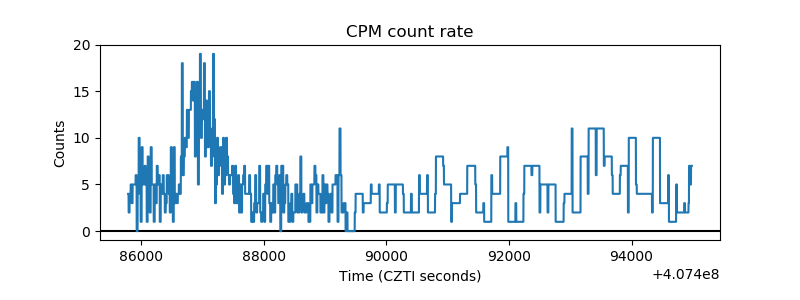 |
| CZT Counter | 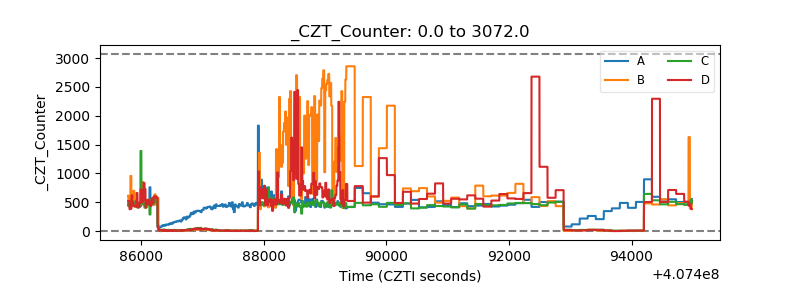 |
| +2.5 Volts monitor | 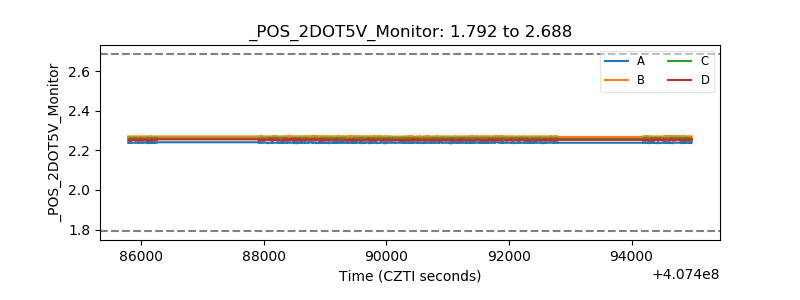 |
| +5 Volts monitor |  |
| _ROLL_ROT | 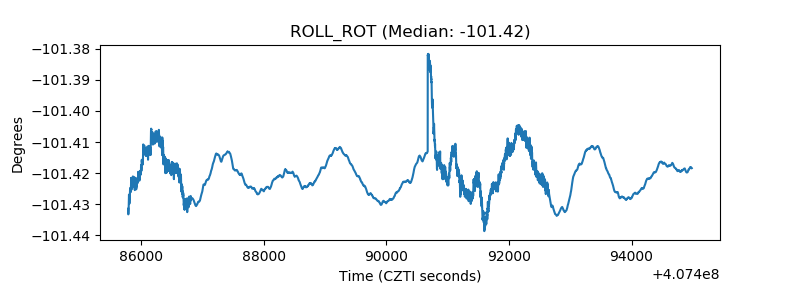 |
| _Roll_DEC | 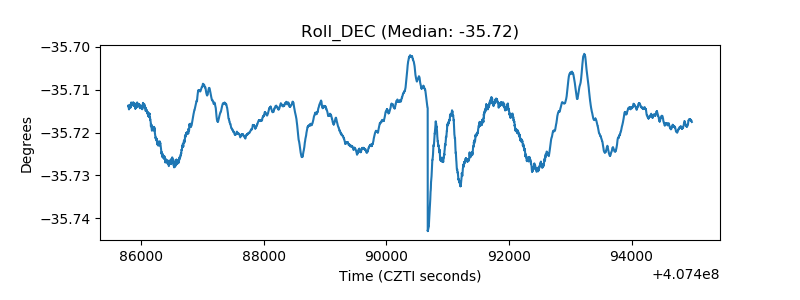 |
| _Roll_RA | 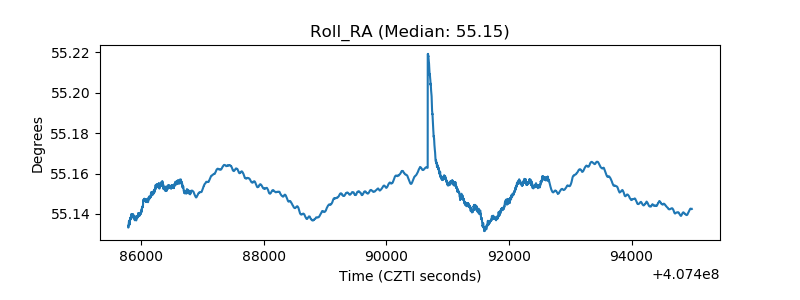 |
| Veto Counter | 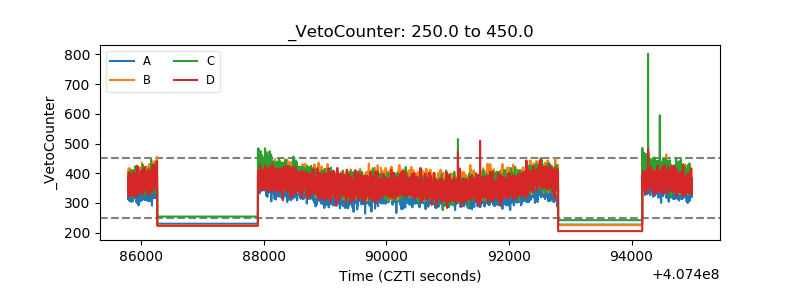 |