| Param | Original file | Final file |
|---|---|---|
| Filename | modeM0/AS1A12_051T01_9000005394_38786cztM0_level2.fits | modeM0/AS1A12_051T01_9000005394_38786cztM0_level2_quad_clean.evt |
| Size (bytes) | 357,814,080 | 98,605,440 |
| Size | 341.2 MB | 94.0 MB |
| Events in quadrant A | 3,094,038 | 655,251 |
| Events in quadrant B | 3,204,799 | 669,671 |
| Events in quadrant C | 2,833,886 | 650,387 |
| Events in quadrant D | 3,646,112 | 591,959 |
| Mode SS | |||
|---|---|---|---|
| Quadrant | BADHDUFLAG | Total packets | Discarded packets |
| A | 0 | 124 | 0 |
| B | 0 | 124 | 0 |
| C | 0 | 124 | 0 |
| D | 0 | 124 | 0 |
| Mode M0 | |||
|---|---|---|---|
| Quadrant | BADHDUFLAG | Total packets | Discarded packets |
| A | 0 | 12901 | 3 |
| B | 0 | 13587 | 2 |
| C | 0 | 12142 | 2 |
| D | 0 | 14734 | 2 |
| Mode M9 | |||
|---|---|---|---|
| Quadrant | BADHDUFLAG | Total packets | Discarded packets |
| A | 0 | 27 | 0 |
| B | 0 | 27 | 0 |
| C | 0 | 27 | 0 |
| D | 0 | 27 | 0 |
| Quadrant | Total seconds | Saturated seconds | Saturation percentage |
|---|---|---|---|
| A | 5990 | 42 | 0.701169% |
| B | 5990 | 106 | 1.769616% |
| C | 5990 | 12 | 0.200334% |
| D | 5990 | 120 | 2.003339% |
Noise dominated data is calculated using 1-second bins in cleaned event files. If a bin has >2000 counts, and if more than 50% of those come from <1% of pixels, then it is considered to be noise-dominated and hence unusable.
| Quadrant | # 1 sec bins | Bins with >0 counts | Bins with >2000 counts | High rate bins dominated by noise | Noise dominated (total time) | Noise dominated (detector-on time) | Marked lightcurve |
|---|---|---|---|---|---|---|---|
| A | 8676 | 5992 | 34 | 34 | 0.39% | 0.57% | 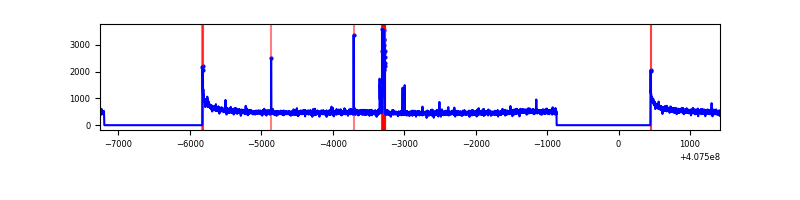 |
| B | 8676 | 5992 | 55 | 55 | 0.63% | 0.92% | 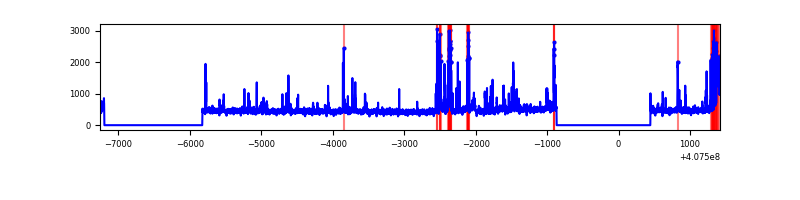 |
| C | 8676 | 5992 | 3 | 3 | 0.03% | 0.05% | 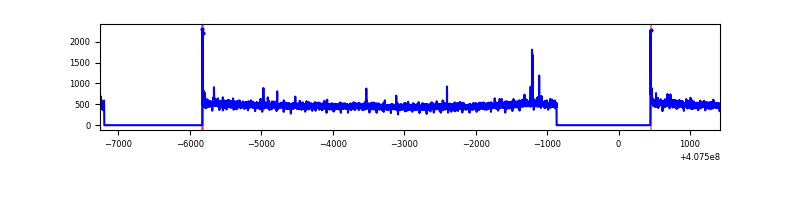 |
| D | 8676 | 5992 | 122 | 122 | 1.41% | 2.04% | 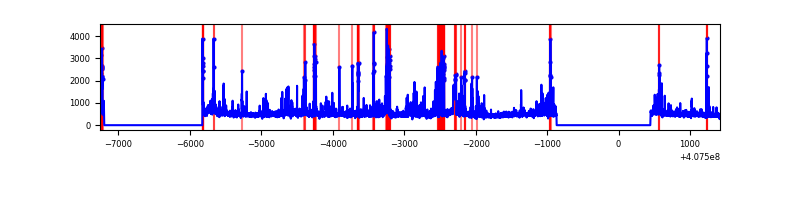 |
Top three noisy pixels from each quadrant. If the there are fewer than three noisy pixels in the level2.evt file, extra rows are filled as -1
| Pixel properties | Quadrant properties | ||||||
|---|---|---|---|---|---|---|---|
| Quadrant | DetID | PixID | Counts | Sigma | Mean | Median | Sigma |
| A | 10 | 83 | 423460 | 3172.5 | 659 | 645 | 133.3 |
| A | 9 | 143 | 108627 | 810.22 | 659 | 645 | 133.3 |
| A | 13 | 254 | 9181 | 64.05 | 659 | 645 | 133.3 |
| B | 4 | 171 | 363381 | 2828.75 | 656 | 637 | 128.2 |
| B | 5 | 200 | 205495 | 1597.53 | 656 | 637 | 128.2 |
| B | 5 | 172 | 31533 | 240.93 | 656 | 637 | 128.2 |
| C | 15 | 214 | 266180 | 1753.77 | 647 | 651 | 151.4 |
| C | 0 | 10 | 18286 | 116.48 | 647 | 651 | 151.4 |
| C | 14 | 254 | 14893 | 94.07 | 647 | 651 | 151.4 |
| D | 2 | 120 | 306709 | 1956.33 | 641 | 624 | 156.5 |
| D | 2 | 249 | 223574 | 1424.98 | 641 | 624 | 156.5 |
| D | 2 | 16 | 193159 | 1230.58 | 641 | 624 | 156.5 |
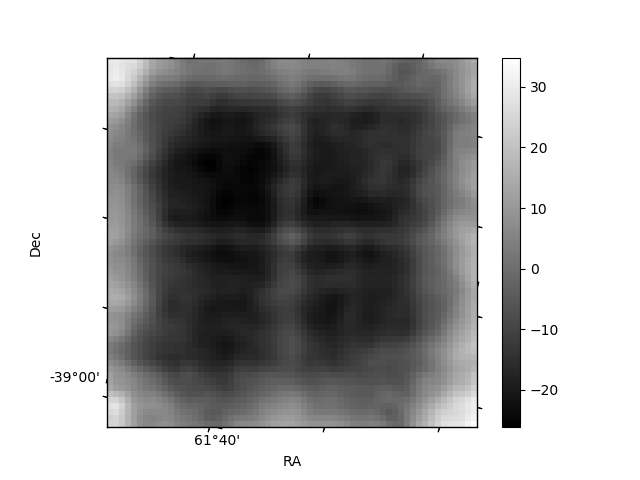
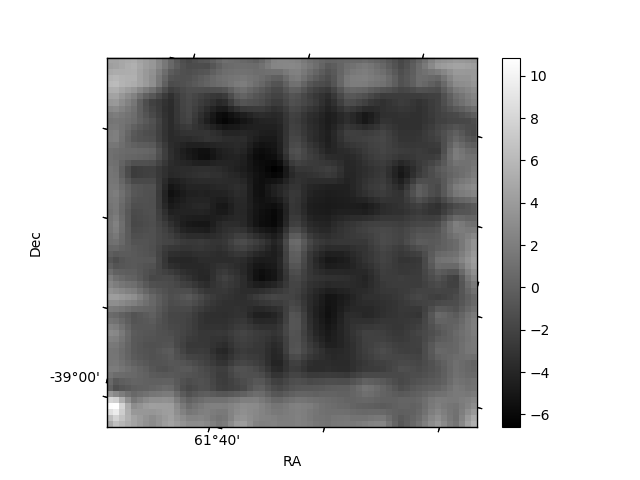
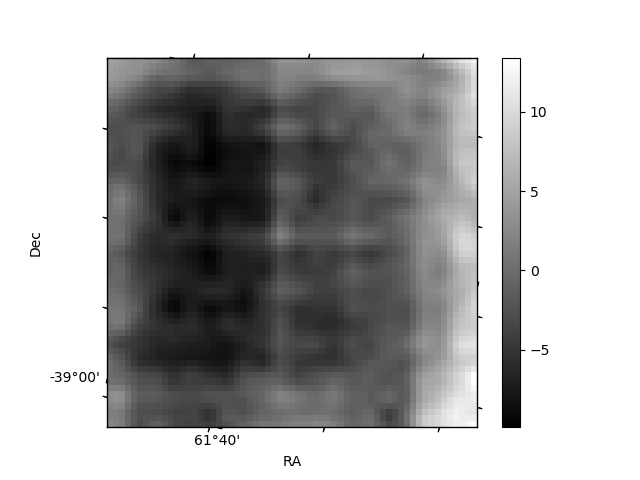
Histogram calculated using DETX and DETY for each event in the final _common_clean file
| Quadrant A | 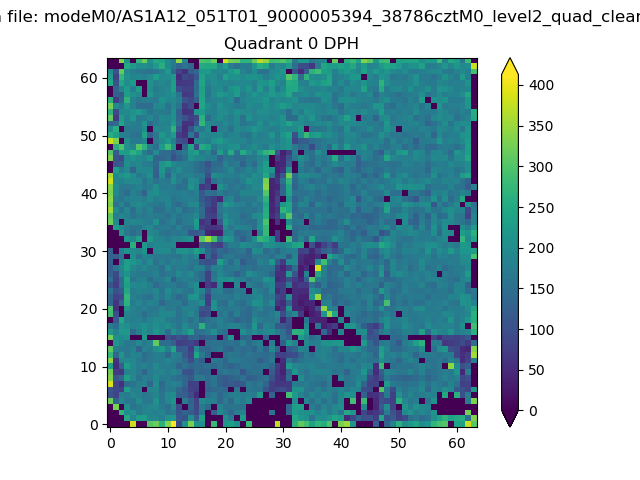 |
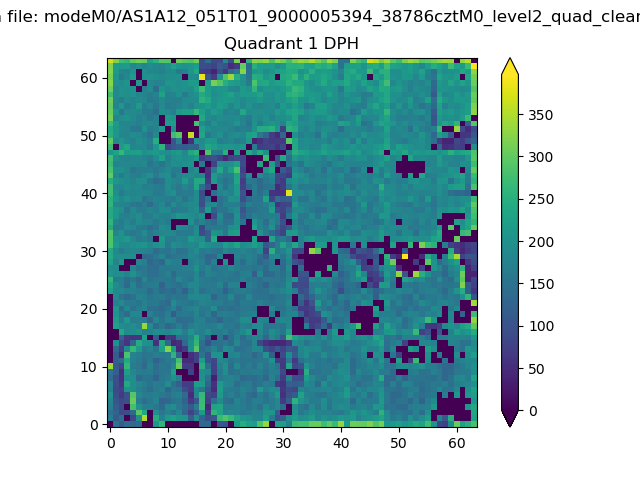 |
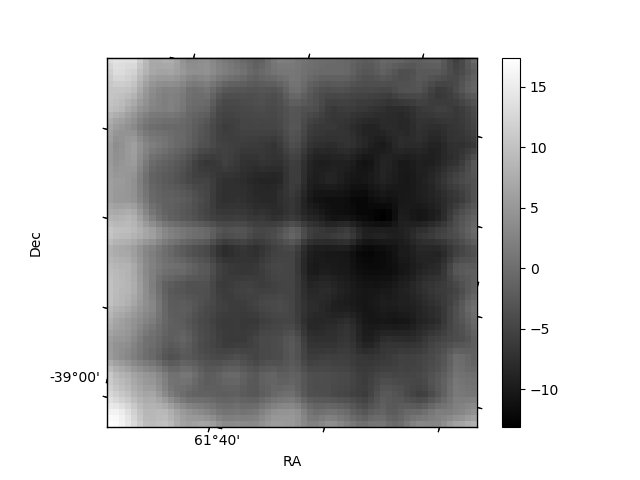
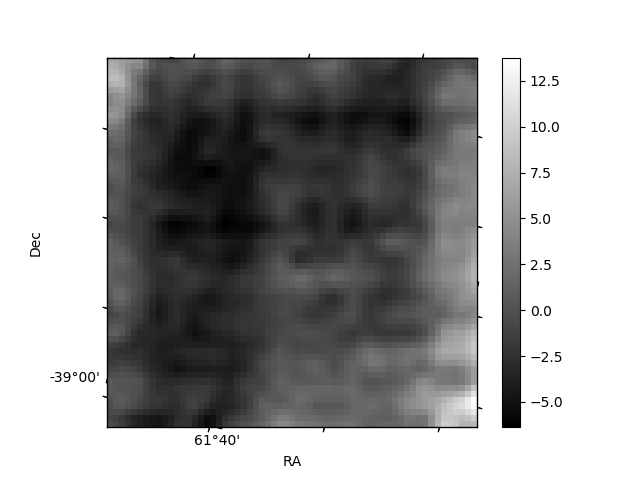
Quadrant B |
|---|---|---|---|
| Quadrant D | 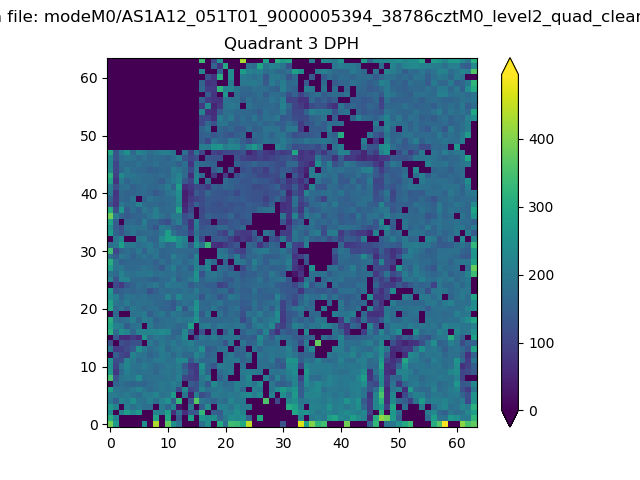 |
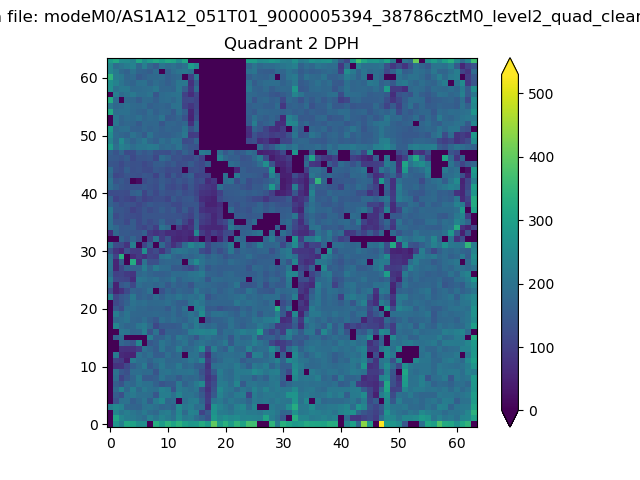 |
Quadrant C |
| Plot type | Count rate plots | Images |
|---|---|---|
| Comparison with Poisson distribution Blue bars denote a histogram of data divided into 1 sec bins. Red curve is a Poisson curve with rate = median count rate of data. |
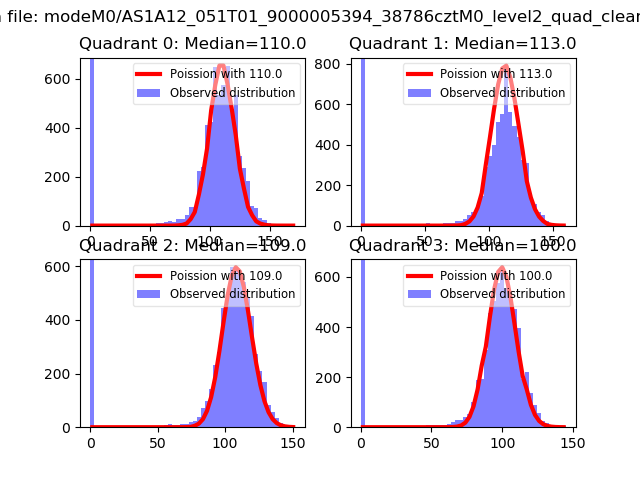 |
 |
| Quadrant-wise count rates Data is divided into 100 sec bins |
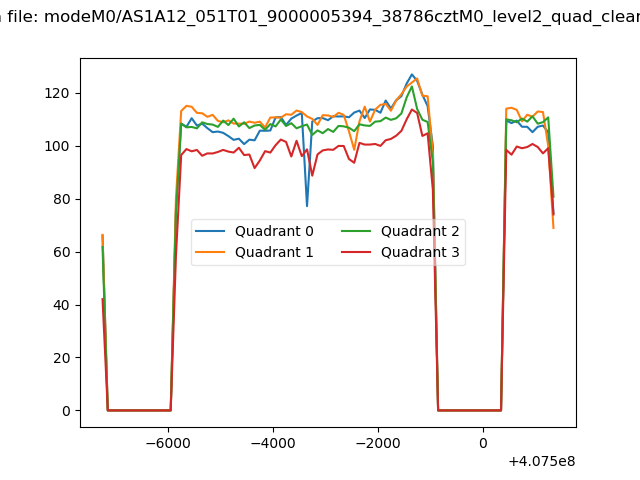 |
|
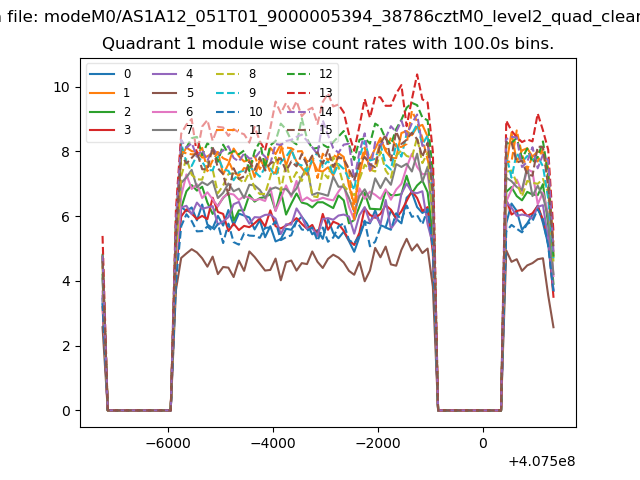
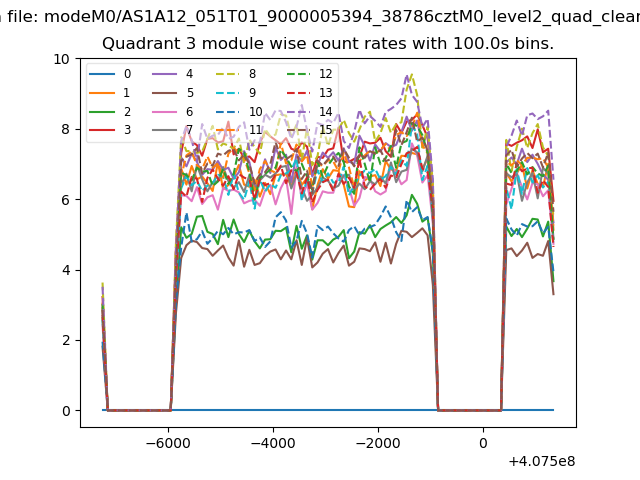
| Module-wise count rates for Quadrant A Data is divided into 100 sec bins |
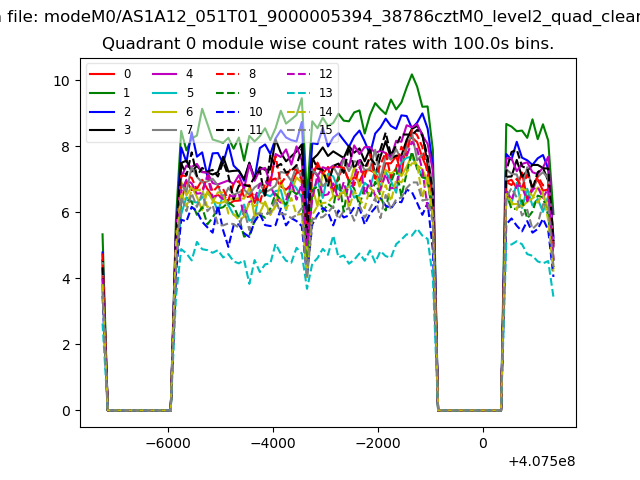 |
 |
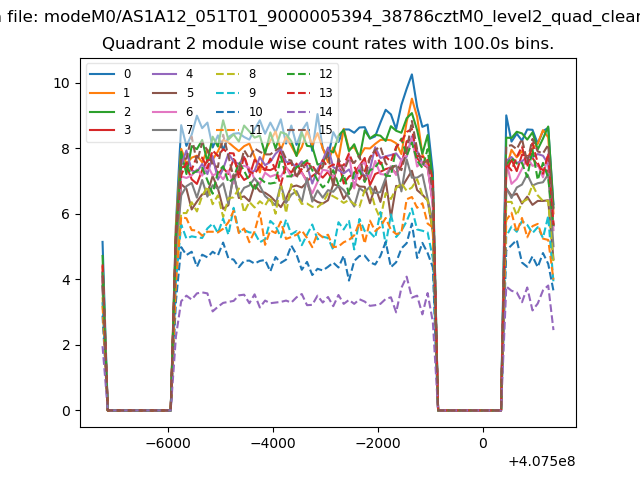
| Module-wise count rates for Quadrant B Data is divided into 100 sec bins |
 |
 |
| Module-wise count rates for Quadrant C Data is divided into 100 sec bins |
 |
 |
| Module-wise count rates for Quadrant D Data is divided into 100 sec bins |
 |
 |
| Parameter | Plot |
|---|---|
| CZT HV Monitor |  |
| D_VDD | 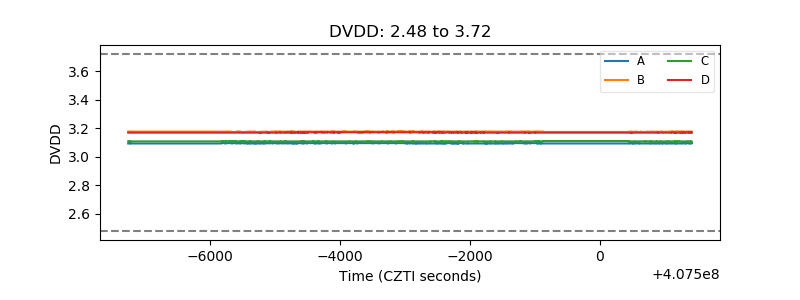 |
| Temperature 1 | 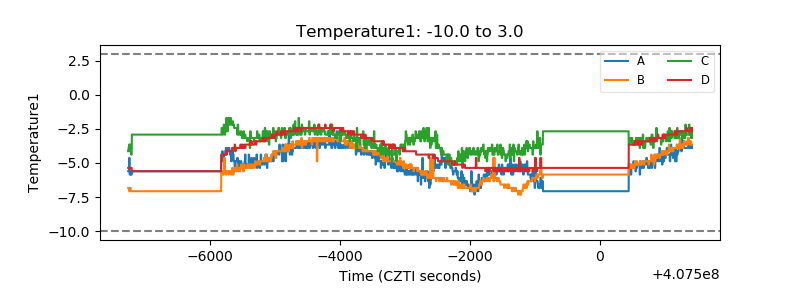 |
| Veto HV Monitor | 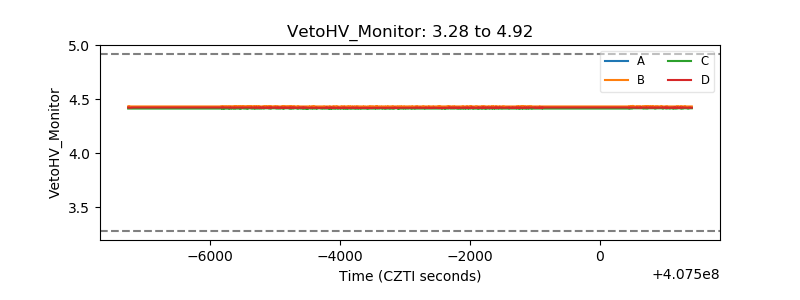 |
| Veto LLD | 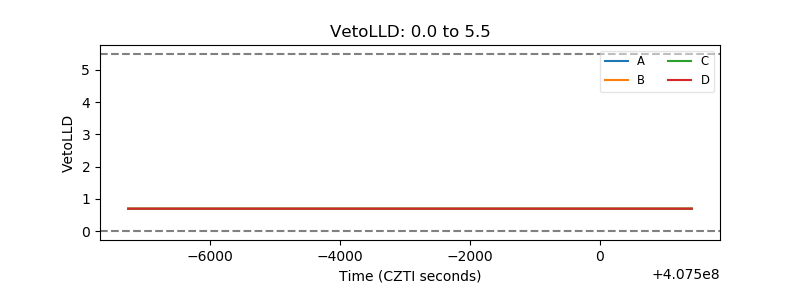 |
| Alpha Counter | 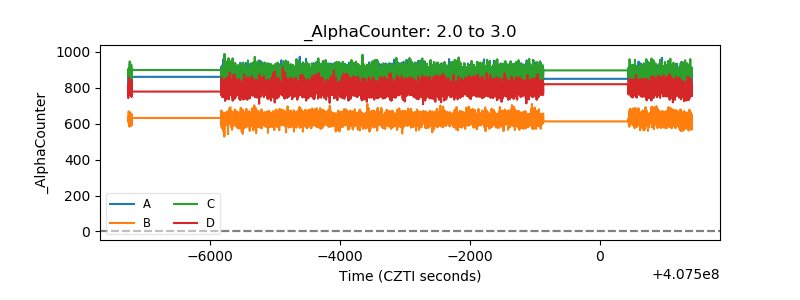 |
| _CPM_Rate | 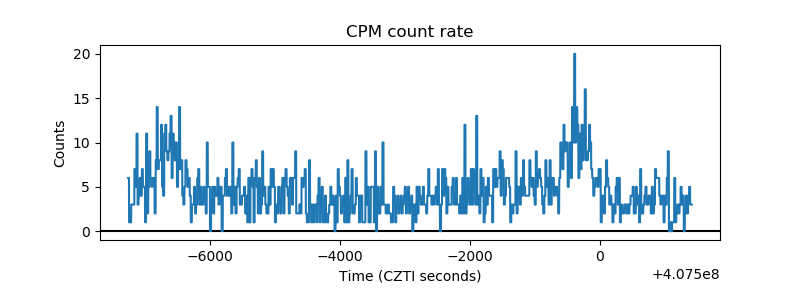 |
| CZT Counter | 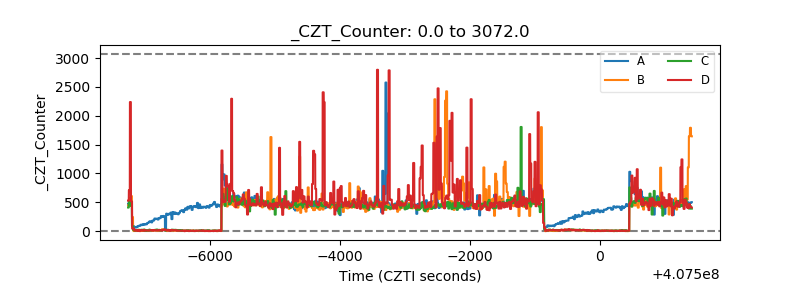 |
| +2.5 Volts monitor | 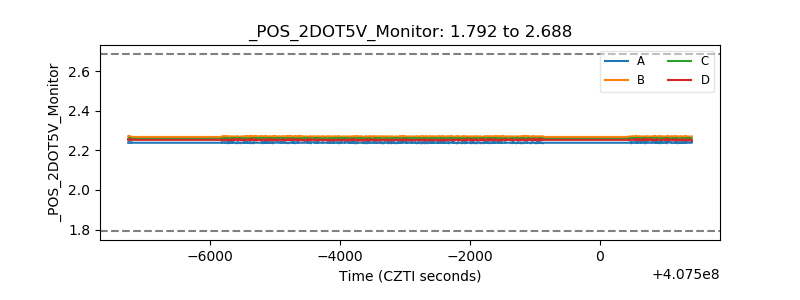 |
| +5 Volts monitor | 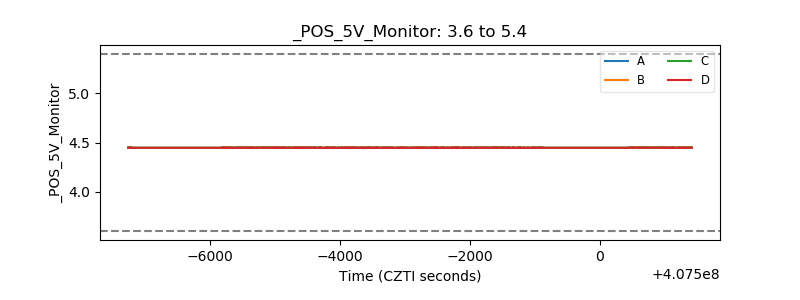 |
| _ROLL_ROT | 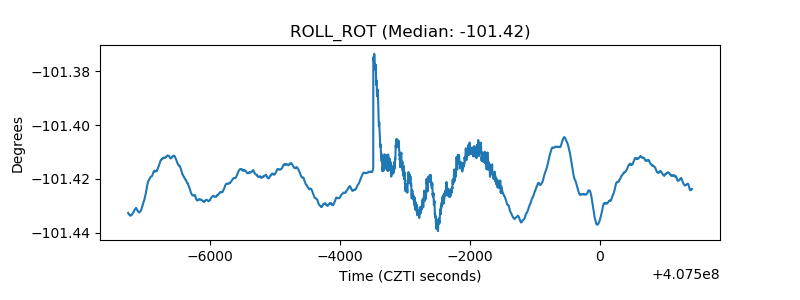 |
| _Roll_DEC | 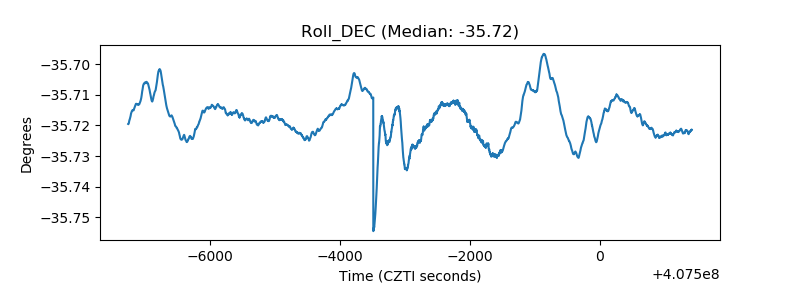 |
| _Roll_RA | 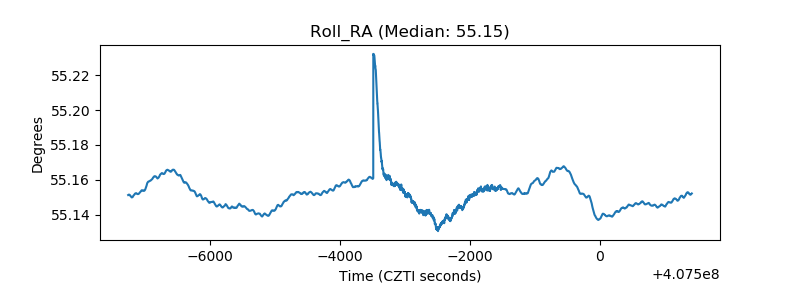 |
| Veto Counter | 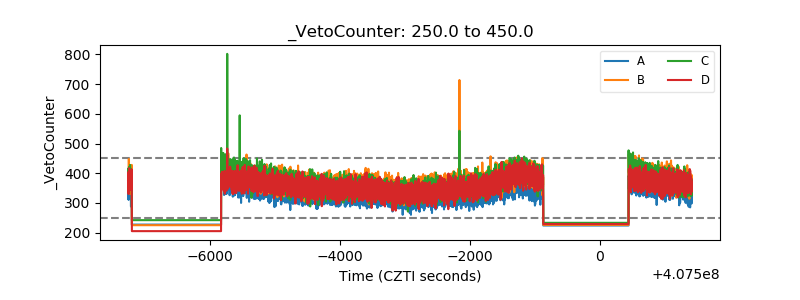 |